


3.3. Polarization
In simple geometrically thin, optically thick accretion disk models, the atmospheric opacities may be dominated by electron-scattering opacity. Also, as we discuss in Section 4 below, Compton scattering is often used to alleviate the Lyman edge problem. In a quasi-flattened geometry, the scattering of photons (both Thompson and Compton) leads to polarization of the photons. Thus polarization of the optical/UV continuum in AGNs can also be used as a diagnostic of accretion disk characteristics.
As we noted above at the end of Section 2, observations do not confirm the simple electron-scattering-dominated accretion disk predictions for polarization. Observed polarizations are low and are parallel to the inferred disk axis (Stockman et al. 1979, 1984; Antonucci 1988). These observations also found that there was no wavelength dependence of the polarization. Recent optical spectropolarimetry of intermediate and high redshift quasars by Berriman et al. (1990) and Antonucci et al. (1996) confirm the earlier results; i.e., unobscured AGNs show low optical polarization with no statistically significant wavelength dependence.
In the unified scheme for AGNs, the accretion disk will not be viewed over the full range of inclination angles because of the obscuring torus. Assuming that the accretion disk axis and the torus axis are aligned, then depending on the opening angle of the torus, the expected polarization range is no longer 0% - 11.7% (see Section 2) but is reduced. Figure 9 compares the observed polarization of PG QSOs to the predictions for an optically thick, pure electron-scattering slab. In this comparison the viewing angle ranges between 0° and 60°. The comparison shows that the theoretical predictions are inconsistent with the data, i.e., calculations predict more objects with higher polarization than are observed. But, if there is a range in the opening angle of the torus around 30°, then the expected polarization would be in the range 0%-0.5%, which could become consistent with the data. The slightly higher polarization seen in some sources could then be due to larger torus opening angles. Note that in this argument, we have assumed that the disk and torus are aligned, which may not be the case. The important point is that although it may be possible to explain to some extent the low magnitude of polarization that is observed in AGNs, the polarization angle is observed to be parallel to the inferred disk axis. This polarization angle dependence is perpendicular to that expected from a pure electron-scattering slab! Until recently, the disk axis has been inferred only in radio-loud AGNs by determining the radio jet axis. We now have the ability to resolve the central radio source in radio-quiet AGNs, and it will certainly be interesting to check the alignment of the polarization angle in these objects.
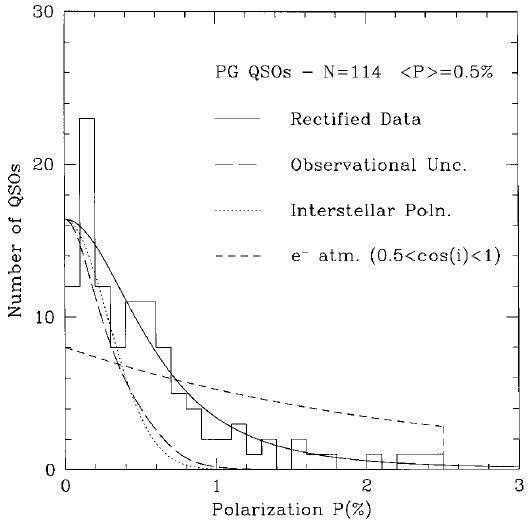 |
Figure 9. Observed optical polarization of PG QSOs compared to predictions (short-dashed line) for optically thick, pure electron-scattering slabs with viewing angles in the range of 0°-60° inclination angles. The comparison shows that the theoretical predictions are inconsistent with the data, i.e., calculations predict more objects with higher polarization than are observed. The polarization data are based on the figure by Berriman et al. (1990). The long-dashed line represents the polarization distribution given the observational errors. The dotted line represents the distribution for interstellar polarization only (courtesy E. Agol). |
HST/FOS spectropolarimetry allowed us to probe the ~ 700 Å
to ~ 1300 Å region of 10 intermediate-redshift quasars
(Koratkar et al. 1995;
Impey et al. 1995;
Koratkar et al. 1998).
Using ground-based spectropolarimetry,
Antonucci et al. (1996)
have observed three high-redshift AGNs shortward of the Lyman limit and
20 intermediate-redshift AGNs in the ~ 1100 Å to ~ 3000 Å
region. Although the current data cannot be used to make any
statistically significant conclusions, there are certain trends seen in
this small sample. The data show that polarization is not only low in
the optical region but also continues to remain low
( 1.5%) even in
the UV (up to ~ 1000 Å). Further, there is no statistical
wavelength dependence to the polarization for wavelengths greater than
1000 Å. Investigations shortward of the Lyman limit region found
that some radio-quiet AGNs are polarized in this region, and the
polarization has some wavelength dependence (see
Fig. 10). Approximately 30% of the objects
investigated in the Lyman limit region show a rise in polarization
shortward of the Lyman edge; i.e., these objects show higher
polarizations shortward of the Lyman edge and no polarization
longward of the Lyman edge. In one case, PG 1630+377, the
polarization is ~ 20%! The other 70% of the sample showed no significant
polarization (see Fig. 11). The 95% confidence
level upper limits on linear polarization shortward of the Lyman limit
for these objects is
4%. It must be
noted here that most of the objects that showed polarization shortward
of the Lyman limit also showed a candidate partial Lyman edge feature,
while except for one object, all the objects that had no detected Lyman
edge feature showed no polarization.
1.5%) even in
the UV (up to ~ 1000 Å). Further, there is no statistical
wavelength dependence to the polarization for wavelengths greater than
1000 Å. Investigations shortward of the Lyman limit region found
that some radio-quiet AGNs are polarized in this region, and the
polarization has some wavelength dependence (see
Fig. 10). Approximately 30% of the objects
investigated in the Lyman limit region show a rise in polarization
shortward of the Lyman edge; i.e., these objects show higher
polarizations shortward of the Lyman edge and no polarization
longward of the Lyman edge. In one case, PG 1630+377, the
polarization is ~ 20%! The other 70% of the sample showed no significant
polarization (see Fig. 11). The 95% confidence
level upper limits on linear polarization shortward of the Lyman limit
for these objects is
4%. It must be
noted here that most of the objects that showed polarization shortward
of the Lyman limit also showed a candidate partial Lyman edge feature,
while except for one object, all the objects that had no detected Lyman
edge feature showed no polarization.
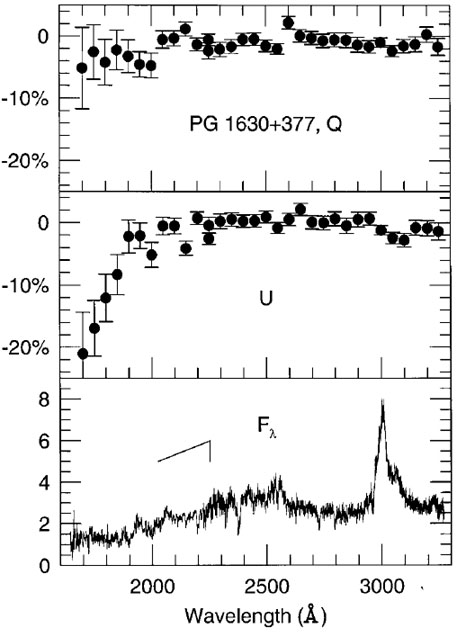 |
Figure 10. HST / FOS
spectropolarimetry of PG 1630+377 in the Lyman limit region. The
normalized Stokes parameters Q / I and U /
I are shown in the top two panels. The bottom panel shows the
total flux
(F |
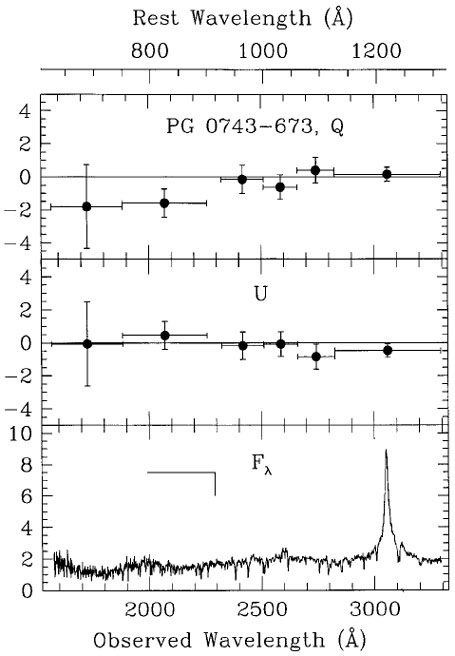 |
Figure 11. HST / FOS
spectropolarimetry of PG 0743-673 in the Lyman limit region. The
normalized Stokes parameters Q / I and U /
I are shown in the top two panels. The bottom panel shows the
total flux
(F |
 )
in units of 10-15 ergs s-1 cm-2
Å-1. Such a high degree of polarization is rare in
radio-quiet AGNs. Approximately 30% of the objects investigated in the
Lyman limit region show a rise in polarization shortward of the Lyman
edge.
)
in units of 10-15 ergs s-1 cm-2
Å-1. Such a high degree of polarization is rare in
radio-quiet AGNs. Approximately 30% of the objects investigated in the
Lyman limit region show a rise in polarization shortward of the Lyman
edge.