


Since the SED predicted by luminous accretion disks is generally bluer than the optical spectra observed in AGNs, traditionally theoretical fits to the data included an additional infrared power-law component that changed the optical slope that the accretion disk model had to fit. But, with mounting evidence that thermal dust emission produces the infrared, this ad hoc procedure is not valid, and such disk models do not provide a satisfactory fit to the observations. Driven by the challenges posed by observations to the standard model, much more sophisticated modeling of accretion disks has occurred in recent years.
Before turning to these more sophisticated models, it is important to be
clear as to what the elementary blackbody disk models can and cannot
do. Naively, one would expect these simple models to predict that the
SED should be F
 1/3. However, the
simplest thin disk models around supermassive (M
1/3. However, the
simplest thin disk models around supermassive (M
 106
M
106
M ) black
holes often do not produce
1/3 spectra
throughout the optical/UV. In order for the disk not to produce so much
radiation pressure that it becomes geometrically thick, the accretion
rate is limited to about 0.2-0.3 times the Eddington rate (see, e.g.,
Laor & Netzer 1989,
but see Section 5.2 below). Simple
blackbody disk models around supermassive black holes have maximum
temperatures less than 3-8 × 10⁵ K, depending on the
black hole spin, and their SED in the optical/UV can be significantly
redder than the 1/3
prediction (see Fig. 16), particularly when
viewed face-on.
) black
holes often do not produce
1/3 spectra
throughout the optical/UV. In order for the disk not to produce so much
radiation pressure that it becomes geometrically thick, the accretion
rate is limited to about 0.2-0.3 times the Eddington rate (see, e.g.,
Laor & Netzer 1989,
but see Section 5.2 below). Simple
blackbody disk models around supermassive black holes have maximum
temperatures less than 3-8 × 10⁵ K, depending on the
black hole spin, and their SED in the optical/UV can be significantly
redder than the 1/3
prediction (see Fig. 16), particularly when
viewed face-on.
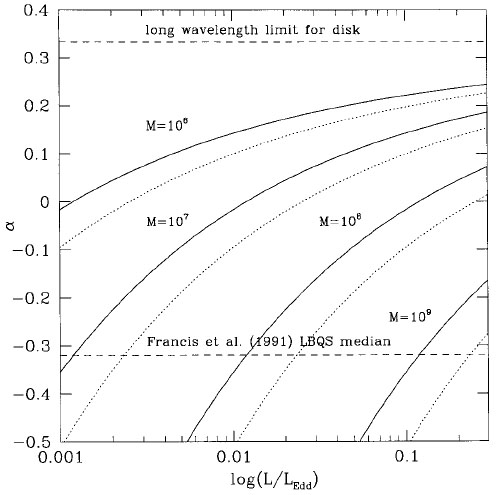 |
Figure 16. Optical/UV slopes predicted by
simple blackbody accretion disk models around Schwarzschild black
holes, as a function of luminosity. The relativistic transfer function
has been included here, with the upper (solid) and lower
(dotted) of each pair of curves corresponding to inclination
angles of 66° and 26°, respectively. (The former are close to
what one obtains when neglecting the transfer function.) The slopes are
calculated between 1450 and 5050 Å. These predicted slopes are
significantly redder than the
|
A fit to the
Francis et al. (1991)
composite spectrum is shown in Figure 17. There is
no problem fitting the data with a simple blackbody disk model, provided
the disk is cool. The Schwarzschild fit shown in this figure has
L / LEdd
 0.1(M /
109
M),
whereas the Kerr fit has L / LEdd
3 ×
10-3 (M / 109). Such cool disk spectra turn
over in the optical/UV, which is why they can have such red slopes. This
curvature in the disk spectrum immediately provides an explanation for
why the optical/UV continuum might get harder when brighter: varying the
maximum temperature, e.g., by varying the accretion rate, will change
the overall slope of the spectrum
(Collin-Souffrin 1991;
Molendi, Maraschi,
& Stella 1992).
However, such cool disks are probably not sufficiently luminous, at
least if they are around low-mass black holes, and they certainly do not
produce much in the way of ionizing photons! One possibility may be that
the optically thick portion of the disk does not extend all the way to
the innermost stable orbit, which allows it to have a smaller maximum
temperature as the flow transitions into some other, hotter phase (see,
e.g., Section 5.5 below).
0.1(M /
109
M),
whereas the Kerr fit has L / LEdd
3 ×
10-3 (M / 109). Such cool disk spectra turn
over in the optical/UV, which is why they can have such red slopes. This
curvature in the disk spectrum immediately provides an explanation for
why the optical/UV continuum might get harder when brighter: varying the
maximum temperature, e.g., by varying the accretion rate, will change
the overall slope of the spectrum
(Collin-Souffrin 1991;
Molendi, Maraschi,
& Stella 1992).
However, such cool disks are probably not sufficiently luminous, at
least if they are around low-mass black holes, and they certainly do not
produce much in the way of ionizing photons! One possibility may be that
the optically thick portion of the disk does not extend all the way to
the innermost stable orbit, which allows it to have a smaller maximum
temperature as the flow transitions into some other, hotter phase (see,
e.g., Section 5.5 below).
 |
Figure 17. Best-fit blackbody accretion
disk spectra to the line-free continuum windows of the composite quasar
spectrum of
Francis et al. (1991).
The solid curve shows the composite spectrum; the short-dashed curve, a
disk model around a Schwarzschild hole; and the long-dashed curve, a
disk model around a Kerr hole with a = 0.98M. The
relativistic transfer function has not been included in these
fits. Note that the data in the composite spectrum shortward of the
Ly |
The more difficult continuum SED problem with thin disk models is not how to explain a red optical/UV spectrum but rather how to explain the origin of the higher energy EUV/X-ray emission. In Figure 17 we see how the theoretical continuum SED falls off sharply in the EUV. This problem is highlighted when one tries to understand the AGN emission-line spectrum. For example, since the BBB drives the emission lines seen in the spectra of AGNs, Korista, Ferland, & Baldwin (1997) compared the predicted and observed emission-line strengths using the "observed" UV X-ray composite BBB SED (see Section 3.1) in photoionization models. The "observed" BBB SED does not reproduce the observed line strengths. MacAlpine et al. (1985) first showed that the He II line equivalent widths were indicative of substantial intrinsic UV excess seen by the broad-line clouds. To explain the discrepancies between the "observed" BBB and the theoretical predictions, we either have to assume that the observations are invalid or that the BLR clouds see a very different continuum than that observed by us. This exercise clearly indicates that geometry of the gas near the AGN central engine and/or the presence of another emission component that generates a significant amount of the ionizing radiation must also be considered.
If the accretion disk itself is to be hot enough to produce sufficient ionizing continuum, then the optical SED predicted by simple blackbody models will indeed be too blue to explain the observations. The accretion disk is not likely to emit locally as a blackbody, however. As noted in Section 2, for example, electron scattering can significantly flatten the spectrum in frequency (i.e., make it redder) if it dominates the opacity at the photosphere and produces a modified blackbody spectrum. Whether or not this happens depends on the very uncertain vertical structure of the disk. Laor & Netzer (1989) were the first to make a serious attempt at improving the simple models by calculating the vertical structure and radiative transfer in an approximate fashion, including bound-free as well as free-free and electron-scattering opacities. They found that the photosphere temperature is everywhere close to the effective temperature for most of their AGN disk models, which indicates that a blackbody spectrum is a better local approximation than a modified blackbody. However, this conclusion is uncertain, as it depends crucially on the density at the photosphere that in their models was equal to the midplane density. This may have artificially enhanced the role of absorption opacity to scattering opacity at the photosphere. Ross, Fabian, & Mineshige (1992) improved on the Laor & Netzer models by again assuming a constant density with height but including a better treatment of Comptonization in both the radiative transfer and thermal balance. They found that the overall spectrum did deviate significantly from the blackbody assumption, at least for their chosen viscosity. More detailed treatments of the vertical structure in such models, but that neglect bound-free and bound-bound opacities, have been performed by Shimura & Takahara (1993, 1995) and Dörrer et al. (1996).
One way of redistributing the energy in the BBB and changing the optical/UV continuum slope is to assume that the optical/UV arises from reprocessing of radiation from the inner disk. A flat disk irradiated by a central source still produces an r-3/4 temperature profile, so flaring or warping is required to change the spectral shape (see Section 5.4). Until recently, the reprocessing assumption was valid because the variability campaigns indicated that the optical/UV and X-ray variations were correlated with nearly no lag. However, the NGC 7469 campaign raises a number of issues that make this simple picture of reprocessing even more complicated (see Section 3.5.3).
 /
N V line is contaminated by intervening
absorption in the intergalactic medium.
/
N V line is contaminated by intervening
absorption in the intergalactic medium.