

In this section we will discuss how different star formation histories affect the evolution of galaxies of different morphological type and in particular how the abundance patterns are expected to change with the star formation.
5.1. Star formation and Hubble sequence
Sandage (1986), on the basis of a work of Gallagher, Hunter & Tutukov (1984) who measured SFR in galaxies, suggested a possible interpretation of the Hubble sequence in terms of different star formation histories. In this picture, ellipticals and bulges must have suffered an intense and strongly declining SFR, whereas late type galaxies must have undergone through a less intense, almost constant (spirals) and even increasing with time (irregulars) SFR. In Figure 39 is illustrated such a behaviour of the SFR for E, S0 and Sa galaxies: there are two important timescales tc, the gas collapse time, and ts, the star formation time, namely the timescale on which the gas in a galaxy is consumed by means of star formation (the inverse of the SF efficiency). The interplay between these two quantities can be crucial for the formation of the different galactic morphological types. In fact, if ts << tc, most of the stars form before the collapse is over and the gas does not have time to dissipate energy and settle into a disk. In this case, the resulting galaxy will be a spheroid, whereas if ts > tc the gas has time to dissipate energy and form a spiral galaxy. This picture is certainly too simplistic to fully describe the reality of galaxy formation but it seems to work well when we are going to interpret galaxy formation by studying the stellar populations in galaxies.
 |
Figure 39. Schematic representation of the change of the SFR with time for galaxies of types E, S0, and Sa. The dashed vertical line at the collapse time tc separates regions of low energy dissipation (to the left) from those of high energy dissipation (to the right). Bulges form in the left region, disks in the right. The integral under the curves gives the total number of stars formed (per unit galaxy mass). The integral under the S0 curve is shaded. Figure from Sandage (1986). |
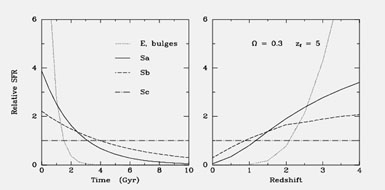
Later on, Kennicutt (1998a, b) measured again the SFR in star forming galaxies and suggested similar behaviours for the different galactic morphological types, as shown in Figure 40. In this Figure, the behaviour of the SFR in spirals is obtained by fitting the mean value of the parameter b, measured by Kennicutt et al. (1994). The parameter b is the ratio between the present time SFR and the average SFR in the past, as defined in eq. (16). Early type spiral galaxies are characterized by rapidly declining SFRs, with b ~ 0.01-0.1, whereas late type spirals have formed stars since a long time at an almost constant rate with b = 1. Finally, ellipticals and S0 have long ago ceased forming stars and have b = 0.
 |
Figure 40. Schematic illustration of the
stellar birthrate for different Hubble types. The left panel shows the
evolution of the relative SFR with time following
Sandage (1986).
The curves for spiral galaxies are exponentially declining SFRs which
fit the mean values of the birthrate parameter b as measured by
Kennicutt et
al. (1994).
The curve for elliptical galaxies and bulges is an arbitrary dependence
for an e-folding time of 0.5 Gyr, for comparative purposes only. The
right panel shows the corresponding evolution in SFR with redshift, for
an assumed cosmological density parameter
|
In Figure 41 we show the SF histories which
give rise to the
[ /Fe] vs. [Fe/H]
relations of Fig. 33.
 |
Figure 41. The predicted histories of SF in galaxies of different morphological type, with decreasing efficiency of SFR from ellipticals to irregulars. Figure from Calura (2004). |
In Figure 42 we show the predicted Type Ia SN rates according to the SFRs of Figure 41. The assumed progenitor model for Type Ia SNe is the single degenerate with the delay time distribution as in Matteucci & Recchi (2001).
 |
Figure 42. Predicted Type Ia SN rates (expressed in Gyr-1 obtained according to the SF histories of Figure 41. As one can see the elliptical (dotted line) reaches a maximum at 0.3 Gyr, whereas the spiral (continuous line) at ~ 2 Gyr and the irregular (dashed line) has a rate increasing to its maximum at around 5 Gyr and then is roughly constant for the rest of the galactic lifetime.The minimum time delay for the Type Ia SNe to appear is 30 Myr, hardly visible in this plot. |
The typical timescale for SN Ia enrichment
The predicted Type Ia SN rates for galaxies with different morphologies show a difference in the maximum SN Ia rate which is reached quite early in ellipticals and it occurs later and later moving to late types. Matteucci & Recchi (2001) suggested to assume the time for the occurrence of the maximum SNIa rate as the typical timescale for the chemical enrichment from these SNe. It depends on the star formation history of each galaxy, on the IMF and on the stellar lifetimes. As we have already shown, the IMF together with stellar lifetimes represent the distribution of the time-delays (DTD) with which SNe explode; therefore, when a DTD is specified, the Type Ia SN rate depends on the SF history only. In summary, in ellipticals and bulges this timescale is 0.3-0.5 Gyr since the beginning of star formation, in the solar vicinity there is a first peak at 1 Gyr then it decreases slightly and increases again till 3 Gyr (due to the two-infall episodes). In irregular galaxies the maximum is reached at ~ 4 Gyr and then the rate remains constant.