


We have seen in the previous section that the shape of the spectrum for a thermal equilibrium plasma is determined by the plasma temperature and the elemental abundances. This is therefore the basic information we derive from the spectral analysis of the ICM radiation: a temperature measurement and a chemical analysis. We consequently illustrate in this, and the next chapter, the scientific insights gained from temperature measurements from the state-of-the-art spectral analysis, and in section 5 the lessons learned from the chemical analysis of the ICM.
It is mostly the shape of the continuum spectrum, dominated by bremsstrahlung, that provides information on the temperature. The spectral energy distribution for the thermal bremsstrahlung spectrum for the collision of an electron with ion, i, is given by (e.g. Gronenschild & Mewe 1978):
 |
(4) |
where me and ne are the electron
mass and density, respectively, ni is the
respective ion density, Z is the effective charge of the ion, and
gff is the gaunt factor, a quantity close to
unity which must be calculated numerically through a quantum-mechanical
treatment. The most prominent spectral signature of
TX is the sharp cut-off of the spectrum at high
energies, due to the exponential term with the argument -
h /
kB T. As long as this
cut-off is seen in the energy window of the telescope, one has a good
handle on the temperature measurement. The element abundances are mostly
reflected in the intensity of the spectral lines. Only in well resolved
spectra of very high quality, where we can observe several lines of the
same element, is the temperature also constrained by line strength
ratios. A prominent such case occurs at temperatures around 2-3
keV where we can observe the K-shell and L-shell lines of iron
simultaneously in high photon count spectra. Another example of
temperature diagnostics based on the study of the hydrogen and helium
like Si and S lines is shown in Fig. 7 (taken
from
Matsushita
et al. 2002).
This work provides a further nice illustrations of
how different temperature indicators can be used to check the
consistency of the temperature measurement and to test if the plasma has
a distribution of temperature phases.
/
kB T. As long as this
cut-off is seen in the energy window of the telescope, one has a good
handle on the temperature measurement. The element abundances are mostly
reflected in the intensity of the spectral lines. Only in well resolved
spectra of very high quality, where we can observe several lines of the
same element, is the temperature also constrained by line strength
ratios. A prominent such case occurs at temperatures around 2-3
keV where we can observe the K-shell and L-shell lines of iron
simultaneously in high photon count spectra. Another example of
temperature diagnostics based on the study of the hydrogen and helium
like Si and S lines is shown in Fig. 7 (taken
from
Matsushita
et al. 2002).
This work provides a further nice illustrations of
how different temperature indicators can be used to check the
consistency of the temperature measurement and to test if the plasma has
a distribution of temperature phases.
 |
Figure 7. X-ray spectrum of the ICM plasma in the halo of M87 at a temperature around 1.7 keV observed with XMM-NewtonEMOS, showing exclusively the spectral range with the H- and He-like lines of Si and S ( (Matsushita et al. 2002). The spectrum is fitted with a one-temperature MEKAL model (black line) and a two-temperature model with the temperature components 1.4 keV and 3.3 keV (grey line). The one-temperature model provides a better fit, supporting the view that the temperature distribution is very narrow. For more details see the original publication. |
The first X-ray spectral observations of clusters lacked sufficient angular resolution and thus involved the total ICM emission of the targets and only provided us with information on the bulk temperature of the cluster ICM. What does this parameter tell us about a cluster? Galaxy clusters form from the gravitational collapse of overdense regions in the matter density distribution in the Universe and subsequently approach an equilibrium configuration characterized by a virial relation:
 |
(5) |
where the mass, M, refers to the total mass of the galaxy clusters including the dark matter. Analogously to the virial equilibrium of galaxies and dark matter particles, the ICM plasma thermalizes and attains a "virial temperature" which reflects the depth of the gravitational potential of the cluster. In the collapse process the potential energy of the ICM is converted to internal heat. If the gravitational potentials of clusters of different mass have a self-similar shape, as implied by numerical simulations of gravitational collapse (e.g. Navarro et al. 1995, Moore et al. 1999), then one finds the following self-similar relation between cluster mass and ICM temperature:
 |
(6) |
where  DM is
the velocity dispersion of the dark matter particles.
(The rightmost relation is due to M
DM is
the velocity dispersion of the dark matter particles.
(The rightmost relation is due to M
 R3
and
R3
and  DM
= const. in the self-similar model).
DM
= const. in the self-similar model).
The analysis of the first galaxy cluster spectra indirectly confirmed this trend by showing that the ICM temperature increases with the galaxy velocity dispersion. Fig. 8 shows one of the first such relations (Mushotzky 1984) with X-ray spectral observations from the HEAO-1 A2 satellite experiment. Modern versions of these relations - given here directly as M - TX relations - are shown in Fig. 9 for selected regular clusters from Arnaud et al. (2007) and for cluster sample from Kotov & Vikhlinin (2006), respectively. The spectroscopically determined ICM temperature thus turns out to be one of the best mass proxies as single observable parameter (e.g. Kravtsov et al. 2006). The tightest relations are obtained, if the core regions are excluded in the global temperature measurement, due to the disproportionate influence of the central cool cores as will become aparant below, and it has thus become standard to quote the mean temperature in the radial region r = 0.15 - 1 × r500 as the most reliable single observable mass proxy for clusters (e.g. Arnaud et al. 2005, Pratt et al. 2008) 1.
 |
Figure 8. Correlation of the ICM temperature with the velocity dispersion of the galaxies in clusters (Mushotzky 1984). The temperatures have been derived from X-ray spectra taken with the HEAO-1 satellite A-2 experiment. The dots are data for non-cD clusters and the open symbols for cD clusters (clusters with a central dominant, cD type galaxy). The lines show predictions of polytropic models with various indices (see Mushotzky 1984). |
 |
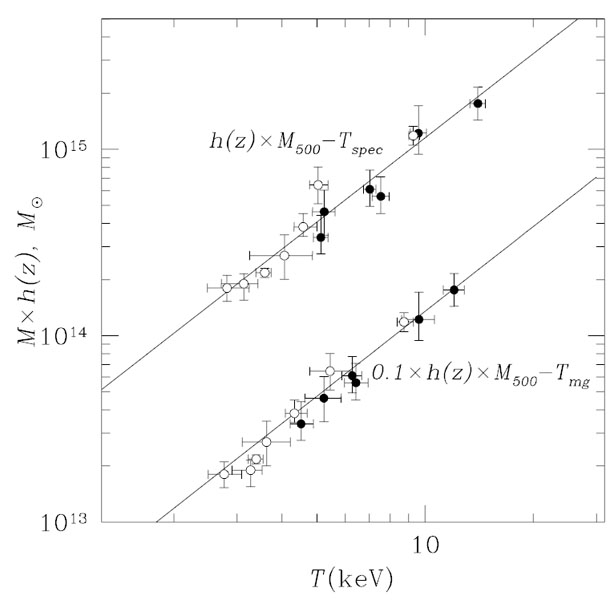 |
Figure 9. Left: The mass - temperature relation of a sample of regular clusters from (Arnaud et al. 2007). The best fitting slope (solid line) is 1.71 ± 0.09 slightly steeper than the self similar relation. Right : The mass - temperature relation of galaxy clusters and its evolution with redshift derived from two cluster samples at <z> ~ 0.05 and <z> ~ 0.55 (Kotov & Vikhlinin 2006). The relations have been displaced by a factor of 10 for better visibility. The model predicted redshift evolution (clusters of equal mass get hotter with look-back time) has been accounted for by scaling with the factor h(z). This predicted evolutionary trend is well supported by the data. |
|
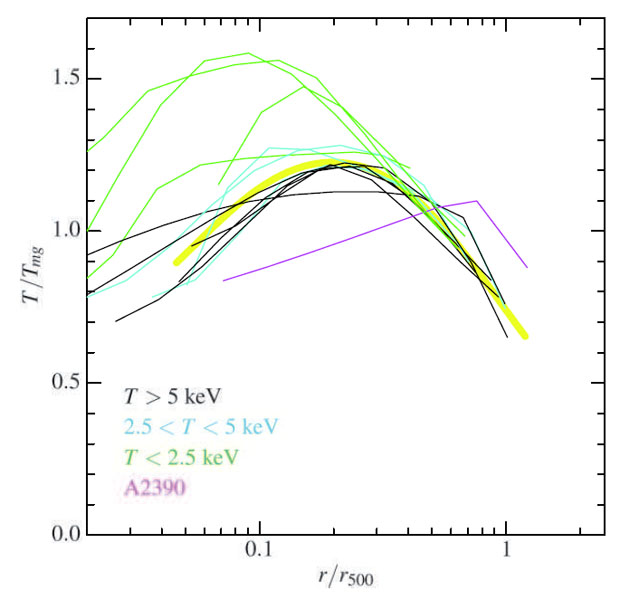
The advanced X-ray observatories Chandra and XMM-Newton now routinely also provide localized measurements of the ICM temperature. First attempts had already been made using observations with the ROSAT observatory e.g. to produce temperature maps featuring still large temperature uncertainties (Briel & Henry 1994, Henry & Briel 1995) and later by means of the ASCA observatory, but due to its comparably low angular resolution most of the results remained somewhat ambiguous and depended on the analysis method used (e.g. Ikebe et al. 1997, Markevitch et al. 1998, White 2000). With some studies by means of the Italian-Dutch X-ray mission BeppoSAX some overview on the temperature structure of clusters was obtained, with decreasing temperature profiles outside ~ 0.2r500 and a diversity of the behaviour in the core region depending on the thermal history of the cluster (De Grandi & Molendi 2002). This picture has become very precise with systematic studies with XMM-Newton and Chandra. Fig. 10 shows results on the temperature profiles of cluster samples studied with both observatories (Vikhlinin et al. 2006, (Pratt et al. 2007).
 |
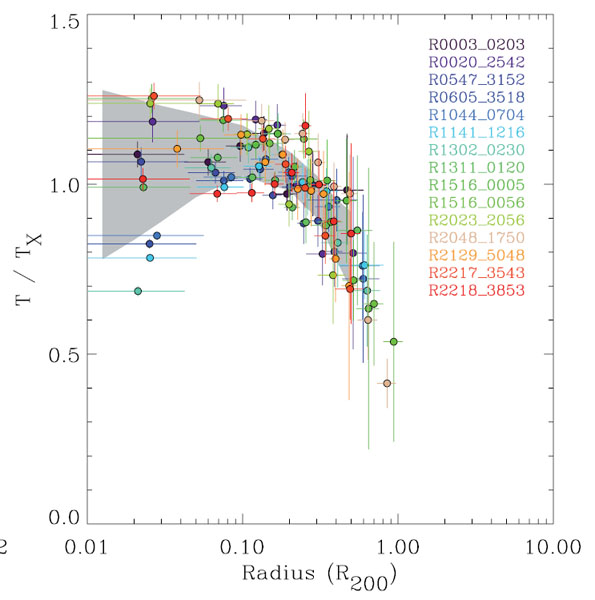 |
Figure 10. Scaled temperature profiles of galaxy clusters derived from spectroscopic observations with the Chandra satellite (left, Vikhlinin et al. 2006) and results obtained for a sample of clusters observed with XMM-Newton (right, (Pratt et al. 2007). |
|
To better understand these results, we have to make a brief excursion to scaling relations. For the comparison of the structure of galaxy clusters of different mass based on the model of self-similarity mentioned above, we need a fiducial radius which identifies corresponding scales in clusters of different mass. A useful definition of such a scale is the radius at which the mean mass density of the cluster is larger by a certain factor than the critical density of the Universe at the redshift of the cluster. One of the justifications of this picture comes from the spherical collapse model in a critical density universe. A good practical choice for the overdensity factor is 500 (see e.g. Evrard et al 1996 who show that inside a region of ~ r500 randomized galaxy and mass particle orbits dominate clearly over infalling material), not least from an X-ray observers point of view, since now a larger number of high quality Chandra and XMM-Newton data cover the cluster ICM spectroscopically out to this radius (e.g. Vikhlinin et al. 2006, Pratt et al. 2007). We will most often make use of this scaling radius of r500, but also use other values of overdensity depending on the literature from which we draw the examples.
In Fig. 10 the temperature profiles shown are scaled by the overdensity radii (with different overdensity values, which has no importance here). We note that there is a large diversity of the profiles at small radii. There are two classes of galaxy clusters: the clusters with dense ICM cores show temperature profiles with TX decreasing towards the center in the core regions, while in clusters with moderate central densities (typically below 10-2 cm-3) the temperature profiles are found to be flat or even slightly increasing towards the cluster center. The clusters will be called cool core and non-cool core clusters in the following. Due to the logarithmic display of the radial range, the inner regions appear more prominent in Fig. 10. Most of the cluster size and volume is in the outer region, where the temperature profiles become very similar and appear squeezed into a narrow zone in scaled radius. This shows that on large scale the thermal structure of clusters can be viewed as following closely a self-similar model. Characterizing this model and understanding the scatter around the mean model is one of the current important observational goals of X-ray cluster research.
One of the difficulties in deriving the temperature distribution of the ICM in clusters from X-ray spectroscopic observations is the fact that the observed radiation is the result of an integral of radiative emission along the entire line-of-sight through the cluster. Therefore one observational task is to "deproject" the cluster spectra, which can only be done by assuming a certain three-dimensional geometrical shape of the cluster, in general spherical symmetry. The requirements for successful spectral deprojection are very good photon statistics and an angular resolution of the data (instrument point spread function) that is better than the corresponding radial binning used. In general the deprojected spectra are much more noisy than the observed spectra, but most often the deprojection results show only small specific differences to the unprojected data (because most of the emission shaping the spectrum comes from the center-most region).
A further problem in deriving the temperature structure from spectroscopy arises if the plasma has more than one temperature phase locally, that is within the observed patch from which the spectrum is extracted and within the deprojection bin. The question is then: what determines the resulting temperature when this composite spectrum is fit with a single-phase spectral model? A first intuitive guess is to assume that it is an average of the temperatures weighted by the radiative emission contributions of the different phases, the so-called emission weighted temperature, Tew (e.g. Mathiesen & Evrard 2001). However, as shown by Mazzotta et al. (2004) the resulting fitted temperature is generally biased low compared to Tew. (Mazzotta et al. 2004) derive a simple analytical approximation to calculate the fitting result from a temperature mixture with an accuracy of a few percent for ICM temperatures above 3 keV. The resulting fitted temperature they call spectroscopic-like temperature, Tsl. This approach is based on the fact that the temperature dependence of the spectra according to Equ. 4 can be expressed as:
 |
(7) |
where E is the photon energy, m is the metallicity (heavy
element abudance) of the plasma, and
 (T,
m) includes
the temperature dependence of the gaunt factor and some effect of
emission lines. The right hand side is a Taylor series expansion for
low enough energies as covered by the energy window of X-ray telescopes
(for kB T > 3 keV). Then it is easy to show
that temperature phase addition with subsequent single temperature
fitting leads to the following expression for the spectroscopic like
temperature:
(T,
m) includes
the temperature dependence of the gaunt factor and some effect of
emission lines. The right hand side is a Taylor series expansion for
low enough energies as covered by the energy window of X-ray telescopes
(for kB T > 3 keV). Then it is easy to show
that temperature phase addition with subsequent single temperature
fitting leads to the following expression for the spectroscopic like
temperature:
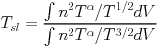 |
(8) |
with tests showing that  = 0.75 is a good approximation.
Vikhlinin
(2006)
has generalized this approach also to low temperatures using a method
that requires some more complex numerical simulations that take into
account the specifics of the spectroscopic instrument, energy band and
galactic absorption providing satisfying results with errors of a few
percent.
= 0.75 is a good approximation.
Vikhlinin
(2006)
has generalized this approach also to low temperatures using a method
that requires some more complex numerical simulations that take into
account the specifics of the spectroscopic instrument, energy band and
galactic absorption providing satisfying results with errors of a few
percent.
The latter approach allows us to derive Tsl for a known temperature distribution, but provides no means to correct for a temperature bias, if the distribution is unknown. For example the determination of cluster masses (as explained below) rests on a local average of the pressure which requires a mass weighted temperature average for known density. Since Tsl is always biased low with respect to mass averaging, the mass will be underestimated in the presence of unresolved multi-temperature structure (e.g. Rasia et al. 2005). A study by Rasia et al. (2006) showed that the temperature bias can easily lead to a mass underestimate by 10% on average. With current instrumentation it is difficult to unveil multi-temperature structure in the temperature range above 3 keV. A simple exercise that can be performed with XSPEC is to take an equal emission measure of 4 keV and 8 keV plasma and to simulate an analysis with the instruments of XMM-Newton. Even with a simulated exposure that gives several ten million photons, a single temperature model with T ~ 5.5 keV gives a perfect fit and we are unable to recover the original input phases. At lower temperatures and very good photon statistics more diagnostics can be performed as seen e.g. in the study shown in Fig. 7 (Matsushita et al. 2002) and similar studies in other cool core regions e.g. by Fabian et al. (2005) or Simionescu et al. (2008a) shown below, due to the emisson lines characteristic to the different temperature phases.
3.1. Cluster Mass Determination
One of the most important applications of the knowledge of the temperature structure in the ICM is the mass determination of galaxy clusters. Assuming the ICM is in hydrostatic equilibrium and the cluster has approximately spherical symmetry, the distribution of the total mass in the cluster is given by the density and temperature profiles by the following equation:
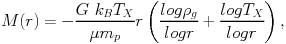 |
(9) |
where G and kB are the gravitational and
Boltzmann's constant, respectively, µ is the mean particle
mass (~ 0.6), mp the mass of the proton, and
g
the gas density.
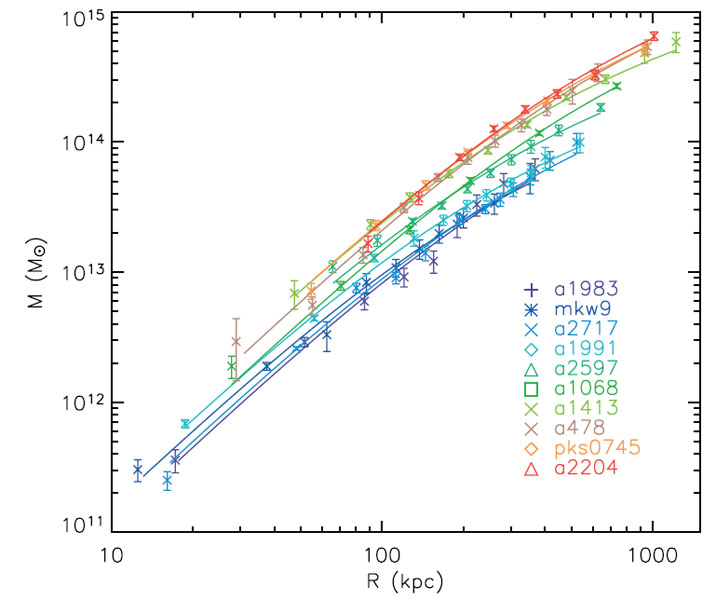
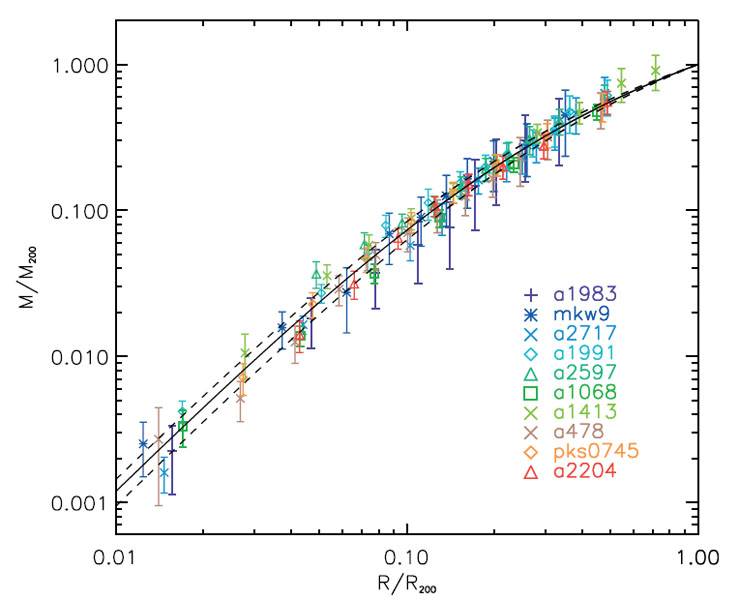
One of the generally interesting results from recent efforts of precise mass determination is the conclusion that the "NFW" dark matter halo model proposed by Navarro, Frenk & White (1995,1997) gives a consistent description of the mass distribution of seemingly relaxed clusters (clusters that show a high degree of symmetry in projection and no obvious signs of recent merger activity) as shown in Fig. 11 (Pratt (2006), Vikhlinin et al. (2005), see also Pratt & Arnaud (2002), Pointecouteau et al. (2005), Buote et al. (2007), Voigt & Fabian (2006)). First attempts have been made of a rigorous comparison of the cluster masses determined from an X-ray analysis and from gravitational lensing studies (Zhang et al. 2007, Mahdavi et al. 2008) showing that the X-ray mass determination provides a much smaller individual uncertainty. We also have first indications that the lensing masses are generally higher by about 12 (± 15) % which may partly reflect the above mentioned temperature bias and additional unaccounted turbulent pressure of the ICM if we assume that the lensing masses are essentially unbiased. This mass calibration by combining several methods will constitute an important effort in the coming years.
 |
 |
 |
|
Figure 11. Upper Left: Mass profiles for a sample of regular clusters with a range of temperatures derived from observations with XMM-Newton (Pointecouteau et al. 2005). Upper Right: Same mass profiles as in the left panel scaled in radius by r200 and in mass by M200, the mass at the radius of r200. The solid line shows the fit of a NFW mass distribution model which provides a good description of the data. Lower Panel: Scaled gas density profiles and scaled total density profiles for a sample of galaxy clusters observed with Chandra (Vikhlinin et al. 2006). The yellow line shows the best fitting NFW-model for the total density profile. |
|
3.2. Fossil Record of Structure and Galaxy Formation in the ICM Thermal Structure
The temperature distribution in the ICM is also the key to the characterization of the thermal history and thermal structure, most conveniently expressed by the entropy structure of the cluster's ICM. The definition of "entropy", S, as used in the astrophysical literature of galaxy clusters deviates from the general definition in physics:
 |
(10) |
This definition is related to the general definition of entropy, s, by s = kB ln(S3/2 (µmp)5/2) + s0 (Voit 2005). The S value can be seen as a parameter to lable adiabates, and thus S stays fixed in any hydrodynamic evolution of the ICM in which all processes are adiabatic; S increases e.g. in shock waves or with dissipation of turbulent motion and descreases with radiative cooling.
The most important application of studying the entropy structure in galaxy clusters is the distinction between heating by gravitational and non-gravitational processes. The term gravitational processes refers here to heat that comes from conversion of potential to heat energy in the formation of structure and the collapse of clusters. This form of heat is determined by structure formation processes that are mainly driven by the dark matter in the Universe. Non-gravitational processes are connected to energy input into the ICM in the form of star formation driven galactic winds (which at the same time lead to chemical enrichment of the ICM as discussed in section 5) and by AGN providing energy input via jets of relativistic plasma.
The way to distinguish the two forms of heating is the study of scaling
relations of thermal cluster properties. The gravitational heating of
the ICM during cluster formation is proportional to the depth of the
gravitational potential well of the cluster and thus the entropy gain is
proportional to the ICM temperature. Heating processes connected to
feedback from the galaxy population are expected to be related
(proportional) to the total stellar mass in the cluster. Assuming to
first order a constant stellar to gas mass ratio of the baryonic cluster
component, the amount of non-gravitational energy input per unit gas
mass is than also to first order constant. Therefore in this most simple
consideration the gravitational entropy contribution is proportional to
the virial and ICM temperature, while the non-gravitational entropy
contribution is an additive constant. The evidence for
non-gravitational entropy characterized in this way was provided by
Ponman et
al. (1999)
as illustrated in Fig. 12 (see also
David et
al. (1996)
who showed with ROSAT observations of cooler systems that groups
have flatter entropy profiles than clusters). The results imply a
so-called entropy floor of about 135 keV cm2
(Ponman et
al. 1999,
Lloyd-Davies et
al. 2000).
More modern results do not show the sudden
appearance of a step, but rather a slope of the entropy - temperature
relation which is shallower than the slope of 1 expected from purely
gravitational models: instead of the gravitational slope of
S(rscaled)
T, relations
around
T2/3 are found. Purely gravitational
models of smooth and cold accretion of gas into the cluster (e.g.
Tozzi &
Norman 2001)
predict entropy profiles in clusters of the form
S(r)
r1.1. Observations show
profiles which can be as steep as this prediction for the most massive
systems, but they are shallower for smaller clusters, which is again a
manifestation of the fact that non-gravitational processes have a larger
effect on systems with a smaller mass and thus a shallower gravitational
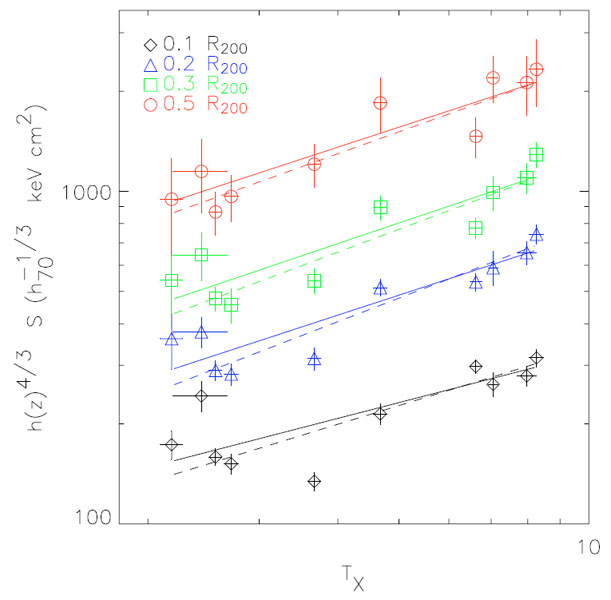
potential. As a representative result we show the study of
Pratt (2006)
involving 10 relaxed appearing clusters (Fig. 13),
which illustrates the radial and ICM temperature scaling behaviour of
the cluster ICM entropy. The diagnostics of entropy profiles has now
been pursued in detail for larger cluster samples by
Cavagnolo et
al. (2009)
and representative cluster samples by Prat et
al. (2009, in preparation) providing a more detailed picture, the proper
interpretation of which has to be assisted by simulations.
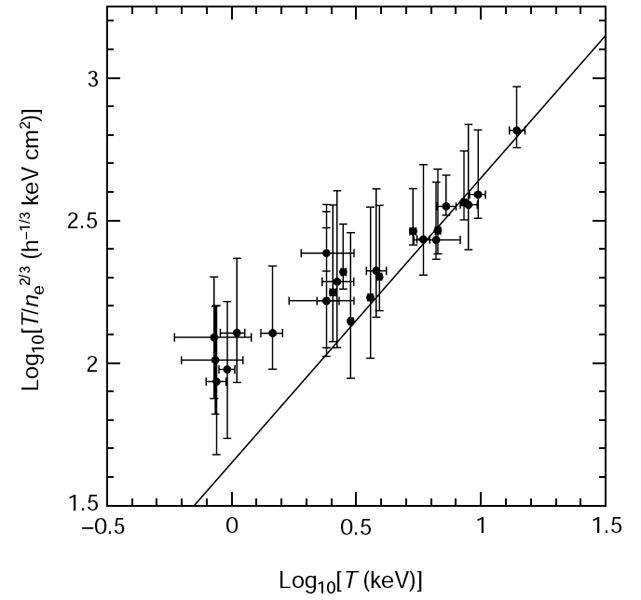 |
Figure 12. Entropy in groups and clusters measured at a fiducial radius of 0.1 rvirial as a function of the system's ICM temperature (Ponman et al. 1999). It was inferred from this plot that the entropy appears to converge at low TX to a characteristic floor value of ~ 100 h-1/3 keV cm2. |
 |
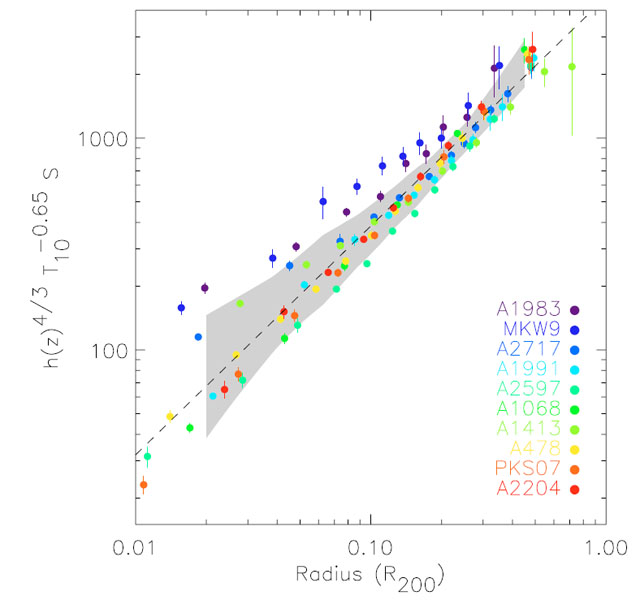 |
Figure 13. Left: The entropy -
temperature relation for 10 regular galaxy clusters
determined at four different fiducial radii
(Pratt 2006).
The slopes of the relations
as determined from the orthogonal BCES method
(Akritas & Bershady 1996)
are for increasing radii: 0.49 ± 0.15, 0.62 ± 0.11, 0.64
± 0.11, and 0.62 ± 0.08. Right: Scaled radial entropy
profiles for the same 10 clusters. The radius is scaled by
r200. The entropy, S, has been scaled with an
entropy-temperature relation proportional to T0.65
using the global cluster temperature. The grey shaded area corresponds
to the 1 |
|
Theoretical modeling to explain the quantitative entropy scaling behaviour involves "preheating" (early entropy increase of the intergalactic medium due to star formation before the formation of the cluster), cooling and condensing of the low entropy material which increases S in the remaining gas phase, and feedback heating processes in the cluster. A complicated balance of all these processes seems to be necessary to reproduce the entropy profiles, the scaling relations, and the amount of baryons that are converted into stars in the cluster volume and efforts to obtain a completely consistent and satisfying model are still ongoing (e.g. Borgani et al. 2004, Borgani et al. 2005, Voit et al. 2003, Voit 2005, McCarthy et al. 2008).
3.3. At and beyond the virial radius
The low, stable, and well understood instrumental and particle
background properties of the Suzaku satellite allowed to
perform the first pioneering studies of clusters out to and beyond their
virial radius.
Reiprich et
al. (2008)
determined the temperature profile for the rich,
massive, cooling core cluster Abell 2204 from
~ 10-1800 kpc, close to the estimated
r200. They find that the temperature profile between
0.3-1.0r200 is consistent with a drop of 0.6, as
predicted by simulations. The first temperature, density, and entropy
profiles beyond r200 were reported for another rich,
massive cooling core cluster PKS 0745-191
(George et
al. 2009).
Between 0.3-1r200 they measure an average
temperature drop of ~ 70%. They find that near to the virial radius the
observed entropy profile is lower than that expected for the heating by
gravitational collapse. Fig. 14 shows
the observed profiles in four directions and the average profiles. The
dotted curve at the bottom shows the expected entropy profile for
heating by gravitational collapse, S
r1.1, and the vertical dashed line shows the estimated
r200. The fall of entropy beyond
r200 in the NW direction is interpreted by the authors
as evidence for an accretion shock from cooler material falling on the
cluster along a filament.
X-ray emission from hot plasma associated with a filament connecting two
massive clusters of galaxies, Abell 222 and Abell 223, was
recently detected using XMM-Newton
(Werner et
al. 2008).
The detection of the tenuous gas permeating the
filament was possible because of its favorable orientation approximately
along our line-of-sight. The temperature of the detected gas is
kT = 0.91 ± 0.25 keV and assuming that the length of the
filament along the line-of-sight is l = 15 Mpc its baryon
density is  3.4 ×
10-5 cm-3, which corresponds to a baryon
over-density of
150. The entropy of the gas in the filament is S
870 keV cm2 l1/3, which
suggests strong preheating. We note that if the detected emission would
be associated with the outer region of radially asymmetric clusters
(deriving the gas density by means of the usual geometric deprojection),
the corresponding entropy of
420 keV cm2
would be much lower than that expected for the virialised cluster gas
( 1000 keV
cm2) which has already passed through an accretion shock.
3.4 ×
10-5 cm-3, which corresponds to a baryon
over-density of
150. The entropy of the gas in the filament is S
870 keV cm2 l1/3, which
suggests strong preheating. We note that if the detected emission would
be associated with the outer region of radially asymmetric clusters
(deriving the gas density by means of the usual geometric deprojection),
the corresponding entropy of
420 keV cm2
would be much lower than that expected for the virialised cluster gas
( 1000 keV
cm2) which has already passed through an accretion shock.
 |
Figure 14. Temperature, density and entropy
profiles of PKS 0745-191 determined by Suzaku
out to and beyond the virial radius in each direction. The dotted curve
at the bottom shows the expected entropy profile for heating by
gravitational collapse S
|
3.4. Diagnostics of Cluster Mergers
Galaxy clusters grow throughout the recent history of our Universe by accreting matter from their surroundings, preferentially by clumpy accretion from the cosmic network matter filaments in the intersections of which they are embedded (e.g. Braglia et al. 2007). From time to time major merger events happen in this accretion process, where two larger systems are attracted to each other and merge violently. These cluster mergers have always been very attractive study objects (see e.g. Feretti et al. 2002) for a review). The thermal structure of the ICM again offers good perspectives to unveil the merger configuration and its history as well as to understand the heating processes of the ICM resulting from the energy release of the merger.
We will illustrate the diagnostic potential of X-ray spectroscopy in these studies by concentrating here mostly on the example of the most dramatic merging system, 1E0657-56. But before we describe an earlier result obtained with XMM-Newton for the diagnostics of the off-axis merger in the cluster A3921 shown in Fig. 15 by Belsole et al. (2005). The temperature map has been obtained by applying the multi-scale spectro-imaging technique based on a wavelet analysis described by Bourdin et al. (2004). The general result of this analysis was subsequently confirmed by spectroscopy of the regions highlighted in the temperature map. While the general gas temperature of the undisturbed Eastern region of the main cluster has a temperature around 4.9 keV, a hot, bar like region with an extent of about 160 x 280 kpc is observed in the highly distorted North-Western side which has been found to have a temperature around 7.25 keV. The signatures have been interpreted as an off-axis merger Belsole et al. (2005). The observed features have been found to be similar to those in the simulations of an off axis merger with a mass ratio of 1:3 an impact parameter of b = 5 rs (where rs is the scale radius of the NFW profile describing the density distribution of the cluster) and a time of less than about 1 Gyr after the X-ray luminosity reaches its peak as shown by Ricker & Sarazin (2001) in their Fig. 7. This system seems to show the typical appearance of an intermediate stage off-axis merger similar to other cases (e.g. Reiprich et al. 2004).
 |
Figure 15. Temperature map of the merging cluster A3921 by Belsole et al. (2005). The temperature map has been produced from XMM-Newton observations obtained with the detectors EMOS1 and EMOS2 with the multi-scale spectro-imaging technique of Bourdin et al. (2004). The barlike hot region to the NE is interpretated as the signature of an off-axis merger at a stage short after the first close encounter similar to features observed in simulations (Belsole et al. 2005, Ricker & Sarazin 2001). Superposed to the temperature map are the contour lines of the surface brightness distribution in the 0.3 - 10 keV band which was adaptively smoothed. The contours are spaced logarithmicly. |
The most detailed and interesting data set on a merging cluster system is that of 1E0657-56 at a redshift of z = 0.297. This cluster was observed in a very deep observation with Chandra with an exposure of 500 ksec (Markevitch 2006) and also with XMM-Newton (Zhang et al. 2006, Finoguenov et al. 2005). As a first exercise to get an overview on the thermodynamic structure of the cluster ICM, it has become standard for such deep, high photon statistic observations to produce maps of the temperature and density distributions of the ICM and to infer the pressure and entropy distribution from these quantities. Fig. 16 shows such maps produced by Million & Allen (2008). The temperature is determined from spectroscopy of about 100 image pixels, each containing at least 3000 photons. The binning of these pixels has been guided by regions of similar surface brightness (Sanders 2006). The ICM density is derived from the surface brightness distribution by assuming a certain geometry to deproject the emission distribution along the line-of-sight. Although the so derived temperature in the temperature map is a projected quantity, it still gives a good impression about the temperature in the central bin in the line-of-sight because of the large weight of the innermost bin due to the square density dependence of the emissivity and the steep density profile. From these maps of approximate temperature and density distribution in a cross section of the cluster, the approximate distribution of pressure, P = nkB Tx, and entropy, S = T / n2/3, can be constructed. The surface brightness image in Fig. 16 shows a disturbed larger cluster component and a compact, cone like structure to the West. The latteris identified with a compact subcluster, flying through the main cluster at high relative velocity, for which optical images provide further evidence. This component has been named "the bullet" from which the popular name of the whole system, "the bullet cluster", originates. In the temperature map the bullet shows up as a cool core which also has the lowest entropy in the entropy map. The Mach cone like shape of the bullet suggest that it may fly with supersonic velocity. In the temperature map we observe that the region in front of the bullet has a strongly enhanced temperature that goes hand in hand with high pressure and elevated entropy. This is the signature of a region heated by a shock preceding and being detached from the bullet. The high temperature/entropy region shows a sharp edge at the shock. In the pressure map the region of the bullet shows little enhancement (apart from the narrow band of shock compressed ICM), while the highest pressure values are found in the center of the overall system structure. Thus, despite the disturbances, the pressure maximum is most probably still indicating the region of the deepest gravitational potential.
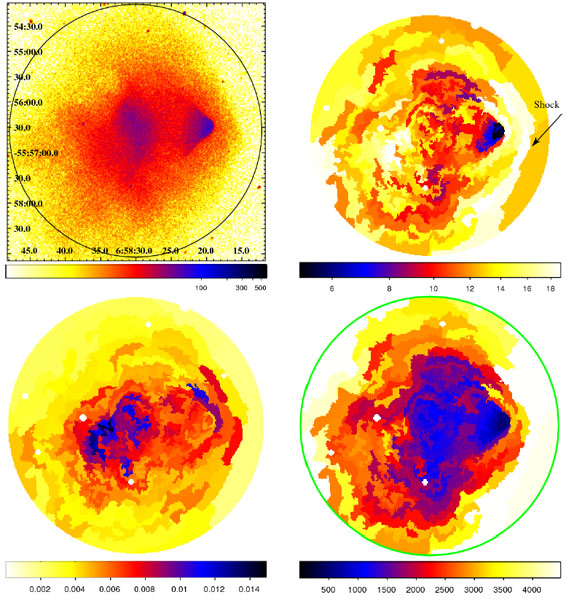 |
Figure 16. Thermodynamic maps for the ICM of the "Bullet cluster", 1E0657-56 (Million & Allen 2008) produced from a 500 ksec observation of this cluster with Chandra. The panels show the X-ray surface brightness in the 0.8 to 7 keV band (upper left), the temperature, kB T, in units of keV (upper right), the projected pressure in units of keV cm-5/2 arcsec-1 (lower left) and projected entropy in units of keV cm5/3 arcsec-1 (lower right). The shock front preceding the bullet is marked by an arrow in the temperature map. |
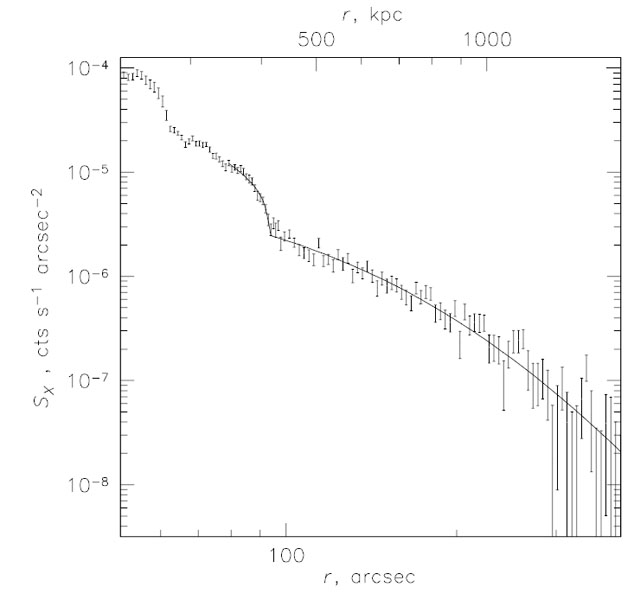
To obtain more quantitative information about the nature of the shock in front of the bullet, Markevitch et al. (2002) has studied the temperature and density distribution around the region of the shocked ICM in more detail. Fig. 17 shows two sharp edges in the surface brightness profile in the left panel. The inner bump is the contact discontinuity that separates the bullet from the shock heated ICM, the second bump at 90'' is the shock. From a density model that fits the projected surface brightness one infers a density jump that corresponds to Mach number 3 ± 0.4 shock. The corresponding temperature jump as derived from the projected spectra, is shown in the right panel. The relatively high Mach number implies a relative velocity of the bullet and the ICM of about 4700 km/s. For an explanation of this high velocity see recent simulations that try to reconstruct the merger configuration of 1E0657-56 and recover such high velocities which are partly boosted by the accretion inflow of ICM at the position of the bullet (Springel & Farrar 2007, Mastropietro & Burkert 2008). In section 6.2 we discuss the use of the observed shock structure in this cluster to study the processes controlling the thermalization of the plasma behind the shock.
 |
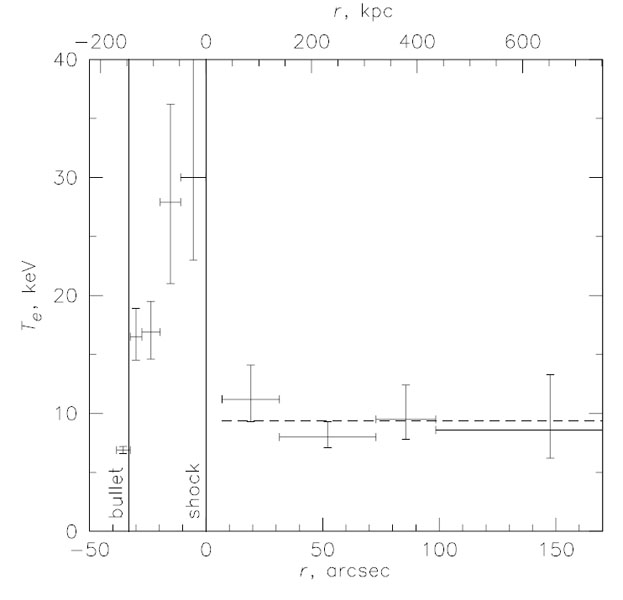 |
Figure 17. Left: Surface brightness profile across the shock front preceding the bullet (Markevitch et al. 2002). The solid line shows the best fit model for the three-dimensional density distribution with a sharp spherical discontinuity at the shock. Right : Projected temperature profile in a narrow sector across the shock front. The vertical lines show the boundary of the bullet and the shock. The dashed line shows the average pre-shock temperature (Markevitch 2006). Both data sets have been derived from deep Chandra observations. |
|
So far only two more cases of clear shock signatures in merging clusters are known: A520 (Markevitch et al. 2005, Markevitch & Vikhlinin 2007); A2219 (Million & Allen 2008).
Another type of interesting structures in the ICM are the so called cold fronts, which also show up in the surface brightness images of clusters as sharp surface brightness discontinuities. But thanks to the spectroscopically determined temperatures one can show that the pressure across the cold fronts is continuous, such that they are boundaries between colder denser plasma and a more tenuous, hotter environment. Markevitch & Vikhlinin (2007) provide a nice recent review about the X-ray observations and the physics of cold fronts and ICM shocks.
3.5. Observational Studies of Turbulence of the ICM
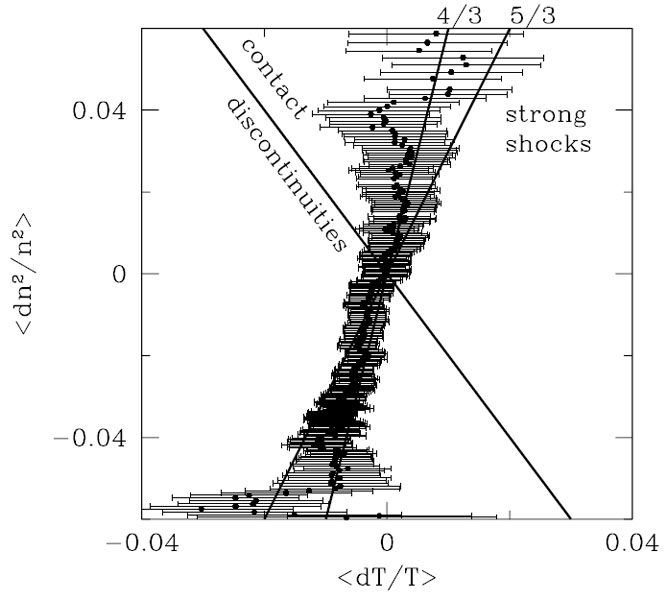
Galaxy cluster mergers are expected to induce turbulent motions into the ICM (Sunyaev et al. 2003). An investigation of the presence of stochastic turbulence has been performed by means of a spectral reduction of deep XMM-Newton observations of the Coma galaxy cluster by Schuecker et al. (2004). The turbulence fluctuation spectrum was studied in the projected pressure map of the ICM in the central region of the Coma cluster. The Coma cluster has a very flat appearance, characterized by a very large core radius of the X-ray surface brightness of ~ 400 kpc (Briel et al. 1992). This enables us to treat the configuration of the central region of Coma in the first approximation as a slab geometry, with corrections to the power spectrum applied later. The analysis of the fluctuation spectrum testing for a turbulent power law spectrum was performed, with the pressure rather than with density or temperature fluctuations, not to confuse the turbulent fluctuations with static entropy fluctuations in pressure equilibrium, which would be characterized by contact discontinuities. In fact, Fig. 19 (left) shows that turbulent pressure fluctuations dominate also the density fluctuations rather than contact discontinuities.
The map of the projected pressure distribution in the center of the Coma ICM as shown in Fig. 18 was obtained by calculating the gas density from the X-ray surface brightness (with an assumed depth of the ICM in the line of sight) and deriving the temperature by a spectral analysis of the data in pixels of 20 by 20 arcsec2 and alternatively 40 by 40 arcsec2, yielding the pressure by means of the ideal gas equation of state. We see the pressure fluctuations clearly in Fig. 18. A Fourier analysis of these fluctuations seen in projection results in the power spectrum shown in Fig. 19 (right). This spectrum has been corrected for the contribution of Poisson noise and the overall shape of the ICM surface brightness in Coma. The observed power spectrum is characterized by a shape very close to a power law. In Fig. 19 we show how different 3-dimensional power law functions compare to the observed spectrum if they are projected in the same way as the observed spectrum. The observations lay in between a power law exponent of 5/3 and 7/3. An exponent of 7/3 is the one expected for the pressure fluctuation spectrum of the classical prediction of Kolmogorov (1941) and Oboukhov (1941). The original work by Kolmogorov was developed for an incompressible fluid, and in the ICM also magnetic fields play a not fully quantified role, and therefore the the case of the cluster ICM is not easily comparable to the classical picture. Nevertheless, a very similar dimensional consideration of turbulence (see e.g. Landau & Lifshitz Vol. VI) is surely applicable to the cluster ICM where most importantly a scale free spectrum is expected between the driving and dissipation scale. The observed signature of a nearly scale free power law power spectrum is thus a very interesting result. The observations have therefore been interpreted in the way that a nearly classical turbulence configuration has been established in the Coma cluster ICM (Schuecker et al. (2004). This can most probably be explained by the fact that Coma is generally believed to be a post-merger cluster (White et al. (1993).
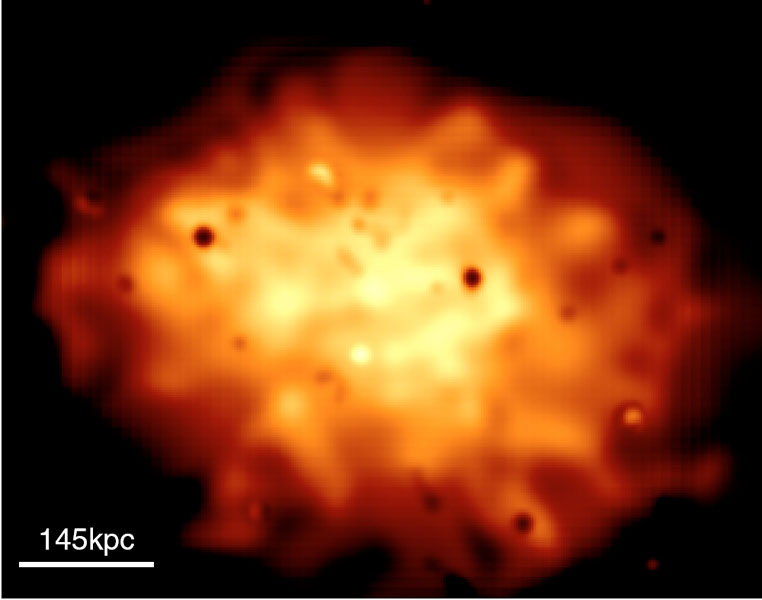 |
Figure 18. Map of the projected pressure distribution of the ICM in the central region of the Coma galaxy cluster. The scale size of 145 kpc corresponds to the largest turbulent eddies traced by the observed pressure fluctuation power spectrum (Schuecker et al. 2004). |
 |
 |
Figure 19. Left:
Correlation of the relative fluctuations in squared density,
n2, and temperature, T, and their
1 |
|
Important information on the amount of turbulence and turbulent pressure support can also be obtained by measuring the level of resonant scattering in emission lines observed in the ICM. The ICM is generally assumed to be optically thin. This is certainly true for most of the emitted X-ray photons, but for the strongest resonance lines the ICM can be moderately optically thick (Gilfanov et al. 1987). What happens is that for strong resonance lines the transition probabilities are large, photons get absorbed, but since the time between the absorption and emission is extremely short they get very quickly reemitted into a different direction. Because of the very short time between the absorption and the emission of the photon the process can be effectively regarded as scattering. Gilfanov et al. (1987) pointed out that because the optical depth of the resonance line depends on the characteristic velocity of small-scale gas motions, measurements of this optical depth give important information about the turbulent velocities in the hot plasma.
The first constraints on turbulent velocities using resonant scattring
were obtained by
Churazov et
al. (2004),
who used XMM-Newton EPIC data to compare the
relative fluxes of the He-like Fe
K and Fe
K lines in the core and in an annulus around
the core of the Perseus cluster. Since the Fe
K at
6.7 keV has a much larger optical depth than the
K
line a difference in their ratios in the two spatial regions with
different column densities would be an evidence for resonance scattering
in the core of Perseus.
Churazov et al. (2004)
found no evidence for resonance scattering in Perseus,
indicating that differential gas motions on scales smaller than
~100 kpc in the core of the cluster must have a range of velocities
of at least half of the sound speed. Independently,
Gastaldello
& Molendi (2004)
reached similar conclusions.
lines in the core and in an annulus around
the core of the Perseus cluster. Since the Fe
K at
6.7 keV has a much larger optical depth than the
K
line a difference in their ratios in the two spatial regions with
different column densities would be an evidence for resonance scattering
in the core of Perseus.
Churazov et al. (2004)
found no evidence for resonance scattering in Perseus,
indicating that differential gas motions on scales smaller than
~100 kpc in the core of the cluster must have a range of velocities
of at least half of the sound speed. Independently,
Gastaldello
& Molendi (2004)
reached similar conclusions.
The first unambiguous evidence for resonant scattering was found using high-resolution spectra of the hot halo around the giant elliptical galaxy NGC 4636 obtained by XMM-Newton RGS (Xu et al. 2002). The plasma with temperatures below 0.9 keV observed in elliptical galaxies, groups of galaxies, and in the cool cores of some clusters emits three strong Fe XVII lines. While the line at 15.01 Å has a very strong oscillator strength and is expected to be optically thick, the blend of lines at 17.05 and 17.1 Å have negligible optical depths. The radial profile of the ratios of these two lines (Fe XVII 17.1Å / Fe XVII 15.0 Å) derived using RGS shows a clear gradient with the peak in the center of the galaxy NGC 4636, proving that many of the 15.01 Å photons get scattered before exiting its core (see Fig. 20 Xu et al. 2002).
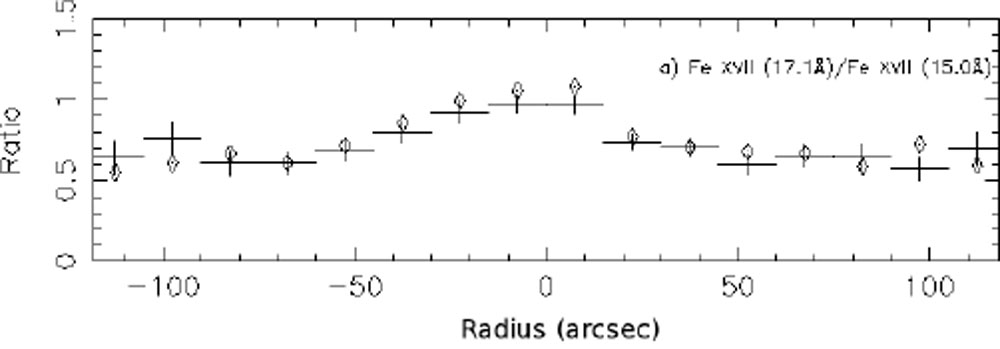 |
Figure 20. Ratio of the 2p-3s lines of Fe XVII at 17.05 & 17.10 Å to the 2p - 3d line of the same ion at 15.01 Å. The ratio has a significant peak at the center of the galaxy, NGC 4636. Since the lines originate from the same ion, the ratio cannot be due to a spatial abundance gradient. Given the narrow temperature range and the weak dependence of the line ratio on temperature it cannot be due to a temperature gradient either. This trend is the best evidence so far for resonant scattering of the line at 15.01 Å in a hot galactic halo. |
Following up the work by
Xu et al. (2002),
Werner et al. (2009)
analyzed the XMM-Newton RGS data of five
nearby bright elliptical galaxies and found that the Fe XVII lines in
the cores of four galaxies show evidence for resonance scattering in the
innermost region. The data for NGC 4636 in particular allowed the effects of
resonant scattering to be studied in detail.
Werner et al. (2009)
used deprojected density and temperature profiles obtained by
Chandra to model the radial intensity profiles of the strongest
resonance lines, accounting for the effects of resonant scattering, for
different values of of the characteristic turbulent velocity. Comparing
the model to the data they found that the isotropic turbulent velocities
on spatial scales smaller than
1 kpc are less than 100 km
s-1 and the turbulent pressure support in the galaxy core is
smaller than 5% of the thermal pressure at the 90% confidence level, and
less than 20% at 95% confidence. Note that the spatial scales of
turbulence probed in the cores of elliptical galaxies by RGS are much
smaller than those probed in Perseus
(Churazov et
al. 2004)
or Coma
(Schuecker
et al. 2004).
The Fe XVII lines are the most sensitive probes of turbulence using resonant scattering, but because they are present only at temperatures less than ~ 1 keV they cannot be used to probe turbulence in the much hotter clusters of galaxies. High-resolution spectra obtained by X-ray calorimeters on the future satellites like Astro-H and IXO will allow us to probe turbulence also in higher mass systems and at larger radii (see Sect. 7).
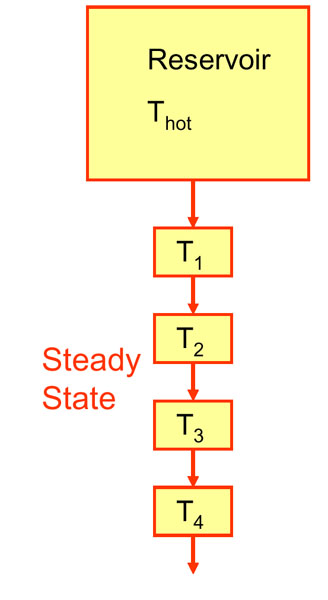 |
Figure 21. Sketch of the temperature
evolution of a classical cooling flow model, with
a reservoir of only slowly cooling hot gas at low density and a steady
cooling of the fraction of gas with a mass cooling rate,
|
1 r500 is the radius where the mean total density of the cluster is 500 times the mass density of a Universe with critical density. This radius describes the same relative scale of clusters of different mass in the self-similar scenario. See also explanation later in the text. Back
 = 5/3
(ideal gas) and
= 5/3
(ideal gas) and
 ,
down to lower temperatures. The spectrum of this cooling flow is then
determined by the integral of the spectra of the transient temperature
phases, where each temperature phase contribution is fixed by the
amount of heat that has to be radiated in the given temperature
interval to cool an amount of ICM with mass
,
down to lower temperatures. The spectrum of this cooling flow is then
determined by the integral of the spectra of the transient temperature
phases, where each temperature phase contribution is fixed by the
amount of heat that has to be radiated in the given temperature
interval to cool an amount of ICM with mass