


It is clear that if dark matter dominates in the matter budget of the Universe, then the properties of dark matter particles determine the formation and evolution of the structure of the Universe. In this way the dark matter problem is related to the large-scale structure of the Universe.
5.1. The distribution of galaxies and clusters
Already in the New General Catalogue (NGC) of nebulae, composed from observations by William and John Herschel, a rich collection of nearby galaxies in the Virgo constellation was known. de Vaucouleurs (1953a) called this system the Local Super-galaxy, presently it is known as the Virgo or Local Supercluster. Detailed investigation of the distribution of galaxies became possible when Harlow Shapley started in the Harvard Observatory a systematic photographic survey of galaxies in selected areas, up to 18th magnitude (Shapley 1940). Shapley discovered several other rich superclusters, one of them is presently named the Shapley Supercluster. These studies showed also that the mean spatial density of galaxies is approximately independent of the distance and of the direction in the sky. In other words, the Harvard survey indicated that galaxies are distributed in space more-or-less homogeneously, as expected from the general cosmological principle.
A complete photographic survey of galaxies was made in the Lick Observatory with the 20-inch Carnegie astrograph by Shane & Wirtanen (1967). Galaxy counts were made in cells of size 10' × 10', and the distribution of the number density of galaxies was studied. The general conclusion from this study was that galaxies are mostly located in clusters, the number of galaxies per cluster varying widely from pairs to very rich clusters of the Coma cluster type. The Lick counts were reduced by Jim Peebles and collaborators to exclude count limit irregularities; the resulting distribution of galaxies in the sky is shown in Fig. 11.
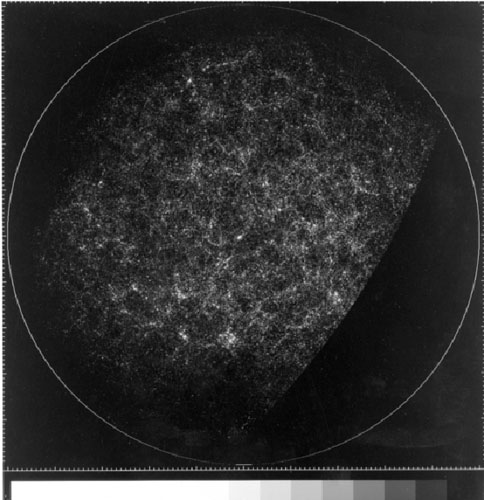 |
Figure 11. The two-dimensional distribution of galaxies according to the Lick counts (Seldner et al. 1977). The north galactic pole is at the center, the galactic equator is at the edge. Superclusters are well seen, the Coma cluster is located near the center (reproduced by permission of the AAS and authors). |
A much deeper photographic survey was made using the 48-inch Palomar Schmidt telescope. Fritz Zwicky used this survey to compile for the Northern hemisphere a catalogue of galaxies and clusters of galaxies (Zwicky et al. 1968). The galaxy catalogue is complete up to 15.5 photographic magnitude. George Abell used the same survey to compile a catalogue of rich clusters of galaxies for the Northern sky, later the catalogue was continued to the Southern sky (Abell 1958, Abell et al. 1989). Using apparent magnitudes of galaxies approximate distances (distance classes) were estimated for clusters in both catalogues. Authors noticed that clusters of galaxies also show a tendency of clustering, similar to galaxies which cluster to form groups and clusters. Abell called these second order clusters superclusters, Zwicky - clouds of galaxies.
The Lick counts as well as galaxy and cluster catalogues by Zwicky and
Abell were analysed by Jim Peebles and collaborators
(Peebles 1973,
Hauser &
Peebles 1973,
Peebles &
Hauser 1974,
Peebles
1974).
To describe the distribution of galaxies Peebles introduced the
two-point correlation (or covariance) function of galaxies
(Peebles &
Groth 1975,
Groth &
Peebles 1977,
Fry & Peebles
1978).
This function
describes the probability to find a neighbour at a given angular
separation in the sky from a galaxy. At small separations the spatial
galaxy correlation function can be approximated by a power law:
 =
(r / r0)-
=
(r / r0)- , with the
index
= 1.77
± 0.04. The distance r0, at which the correlation
function equals unity, is called the correlation length. For galaxy
samples its value is r0
, with the
index
= 1.77
± 0.04. The distance r0, at which the correlation
function equals unity, is called the correlation length. For galaxy
samples its value is r0
 5
h-1 Mpc, and for clusters of galaxies
r0
30 h-1 Mpc. On scales
5
h-1 Mpc, and for clusters of galaxies
r0
30 h-1 Mpc. On scales
 5 times the correlation
length the correlation function is very close to zero, i.e. the
distribution of galaxies (clusters) is essentially random.
5 times the correlation
length the correlation function is very close to zero, i.e. the
distribution of galaxies (clusters) is essentially random.
The conclusion from these studies, based on the apparent (2-dimensional) distribution of galaxies and clusters in the sky confirmed the picture suggested by Kiang (1967) and de Vaucouleurs (1970), among others, that galaxies are hierarchically clustered. However, this hierarchy does not continue to very large scales as this contradicts observations, which show that on very large scales the distribution is homogeneous. A theoretical explanation of this picture was given by Peebles in his hierarchical clustering scenario of structure formation (Peebles & Yu 1970, Peebles 1971).
5.2. Superclusters, filaments and voids
In 1970s new sensitive detectors were developed which allowed to measure redshifts of galaxies up to fainter magnitudes. Taking advance of this development several groups started to investigate the environment of relatively rich clusters of galaxies, such as the Coma cluster and clusters in the Hercules supercluster, with a limiting magnitude about 15.5. During this study Chincarini, Gregory, Rood, Thompson and Tifft noticed that the main clusters of the Coma supercluster, A1656 and A1367, are surrounded by numerous galaxies, forming a cloud around clusters at the redshift ~ 7000 km/s. The Coma supercluster lies behind the Local supercluster, thus galaxies of the Local supercluster also form a condensation in the same direction at the redshift about 1000 km/s. In between there is a group of galaxies around NGC 4169 at the redshift ~ 4000 km/s, and the space between these systems is completely devoid of galaxies (Chincarini & Rood 1976, Gregory & Thompson 1978). A similar picture was observed in front of the Hercules and Perseus superclusters.
In 1970s there were two main rivaling theories of structure formation: the pancake theory by Zeldovich (1970), and the hierarchical clustering theory by Peebles (1971). According to the Zeldovich scenario the structure forms top-down: first matter collects into pancakes and then fragments to form smaller units. In the hierarchical clustering scenario the order of the formation of systems is the opposite: first small-scale systems (star-cluster sized objects) form, and by clustering systems of larger size (galaxies, clusters of galaxies) form; this is a bottom-up scenario.
Zeldovich asked Tartu astronomers for help in solving the question: Can we find observational evidence which can be used to discriminate between various theories of galaxy formation? In solving the Zeldovich question we started from the observational fact suggesting that random velocities of galaxies are of the order of several hundred km/s. Thus during the whole lifetime of the Universe galaxies have moved from their place of origin only by about 1 h-1 Mpc. In other words - if there exist some regularities in the distribution of galaxies, then these regularities must reflect the conditions in the Universe during the formation of galaxies.
In mid-1970s first all-sky complete redshift surveys of galaxies were just available: the de Vaucouleurs et al. (1976) Second Revised Catalogue of Galaxies, the Shapley-Adams revised catalogue by Sandage & Tammann (1981), complete up to the magnitude 13.5 (new redshifts were available earlier Sandage 1978). The common practice to visualise the three-dimensional distribution of galaxies, groups and clusters of galaxies is the use of wedge-diagrams. In these diagrams, where galaxies as well as groups and clusters of galaxies were plotted, a regularity was clearly seen: galaxies and clusters are concentrated to identical essentially one-dimensional systems, and the space between these systems is practically empty (Jõeveer & Einasto 1978). This distribution was quite similar to the distribution of test particles in a numerical simulation of the evolution of the structure of the Universe prepared by the Zeldovich group (Doroshkevich et al. 1980a, early results of simulation were available already in 1976). In this simulation a network of high- and low-density regions was seen: high-density regions form cells which surround large under-dense regions. Thus the observed high-density regions could be identified with Zeldovich pancakes.
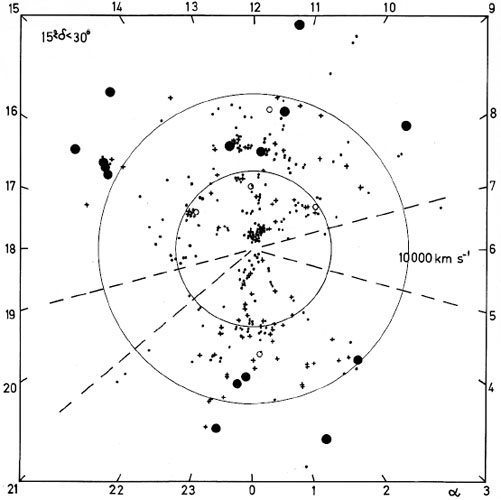
The Large-Scale Structure of the Universe was discussed at the IAU symposium in Tallinn 1977. The amazing properties of the distribution of galaxies were reported by four different groups: Tully & Fisher (1978) for the Local supercluster, Jõeveer & Einasto (1978) for the Perseus supercluster, Tarenghi et al. (1978) for the Hercules supercluster, and Tifft & Gregory (1978) for the Perseus supercluster; see also Gregory & Thompson (1978) for the Coma supercluster and Jõeveer et al. (1978) for the distribution of galaxies and clusters in the Southern galactic hemisphere. The presence of voids (holes) in galaxy distribution was suggested in all four reports. Tully & Fisher demonstrated a movie showing a filamentary distribution of galaxies in the Local supercluster. Jõeveer and Einasto emphasized the presence of fine structure: groups and clusters of galaxies form chains in superclusters and connect superclusters to an infinite network, as seen from wedge diagrams in Fig. 12. They demonstrated also morphological properties of the structure of superclusters: clusters and groups within the chain are elongated along the chain, and main galaxies of clusters (supergiant galaxies of type cD) are also elongated along the chain. A long chain of clusters, groups and galaxies of the Perseus-Pisces supercluster is located almost perpendicular to the line of sight. The scatters of positions of clusters/groups along the chain in the radial (redshift) and tangential directions are practically identical. This demonstrates that the chain is essentially an one-dimensional structure.
 |
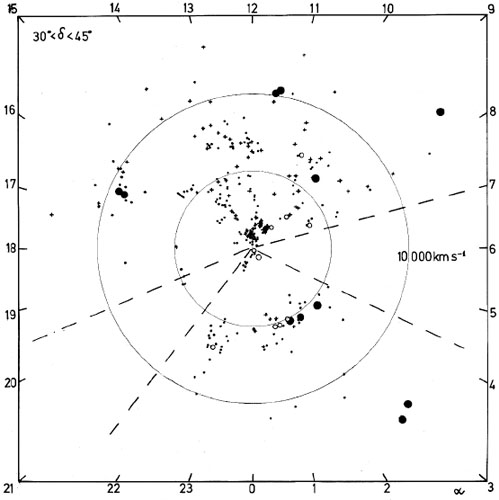 |
Figure 12. Wedge diagrams for two declination zones. Filled circles show rich clusters of galaxies, open circles - groups, dots - galaxies, crosses - Markarian galaxies. In the 15° - 30° zone two rich clusters at RA about 12 h are the main clusters of the Coma supercluster, in the 30° - 45° zone clusters at RA about 3 h belong to the main chain of clusters and galaxies of the Perseus-Pisces supercluster. Note the complete absence of galaxies in front of the Perseus-Pisces supercluster, and galaxy chains leading from the Local supercluster towards the Coma and Perseus-Pisces superclusters (Jõeveer & Einasto 1978). |
|
A direct consequence from this observation is that galaxies and groups/clusters of the chain are already formed within the chain. A later inflow from random locations to the chain is excluded, since in this case it would be impossible to stop galaxies and clusters in the chain after the inflow. The main results of the symposium were summarised by Malcolm Longair as follows: To me, some of the most exiting results presented at this symposium concerned the structure of the Universe on the largest scales. Everyone seemed to agree about the existence of superclusters on scales ~ 30 - 100 Mpc. But perhaps even more surprising are the great holes in the Universe. Peebles' picture, Einasto's analysis of the velocity distribution of galaxies which suggests a "cell-structure" and Tiffts's similar analysis argue that galaxies are found in interlocking chains over scales ~ 50 - 100 Mpc forming pattern similar to a lace-tablecloth.
New data gave strong support to the pancake scenario by Zeldovich (1978). However, some important differences between the model and observations were evident. First of all, numerical simulations showed that there exists a rarefied population of test particles in voids absent in real data. This was the first indication for the presence of physical biasing in galaxy formation - there is primordial gas and dark matter in voids, but due to low density no galaxy formation takes place here. Theoretical explanation of the absence of galaxies in voids was given by Enn Saar (Einasto et al. 1980). In over-dense regions the density increases until the matter collapses to form compact objects (Zeldovich pancakes). In under-dense regions the density decreases exponentially but never reaches a zero value - gravity cannot evacuate voids completely.
The second difference lies in the structure of galaxy systems in high-density regions: in the original pancake model large-scale structures (superclusters) have rather diffuse forms, real superclusters consist of multiple intertwined filaments: Jõeveer & Einasto (1978), Zeldovich et al. (1982), Oort (1983). In the original pancake scenario small-scale perturbations were damped. This scenario corresponds to the neutrino-dominated dark matter. Neutrinos move with very high velocities which wash out small-scale fluctuations. Also, in the neutrino-dominated Universe superclusters and galaxies within them form relatively late, but the age of old stellar populations in galaxies suggests an early start of galaxy formation, soon after the recombination epoch. In other words, the original pancake scenario was in trouble (Bond et al. 1982, Peebles 1982, Zeldovich et al. 1982, Bond & Szalay 1983, White et al. 1983).
The presence of voids in galaxy distribution was initially met with scepticism, since 3-dimensional data were available only for bright galaxies, and faint galaxies could fill voids. However, independent evidence was soon found. A very large void was discovered in Bootes by Kirshner et al. (1981). The filamentary nature of galaxy distribution is very clearly seen in the 2nd Center for Astrophysics (Harvard) Redshift Survey by Huchra, Geller and collaborators (de Lapparent et al. 1986, Huchra et al. 1988), complete up to 15.5 apparent blue magnitude in the Northern Galactic hemisphere, see Fig. 13.
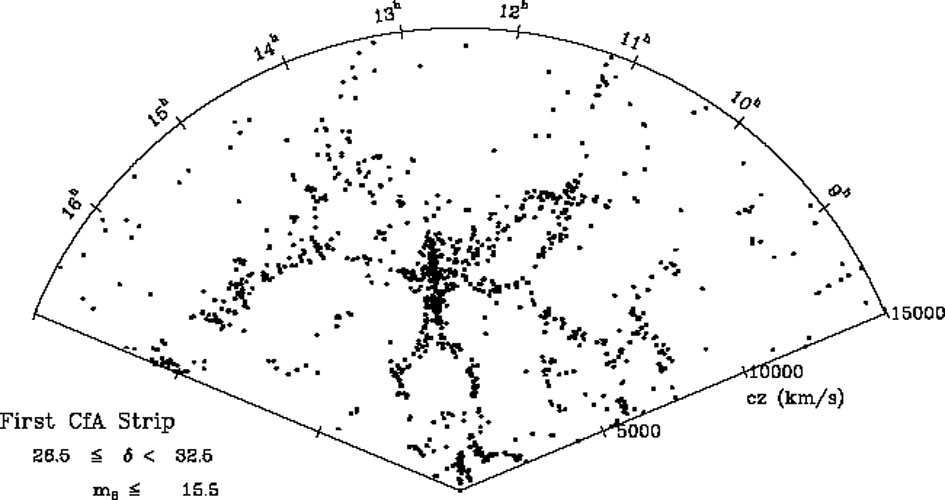 |
Figure 13. A slice of the Universe according to the CfA Second redshift survey (de Lapparent et al. 1986). Galaxy chains connecting the Local and Coma superclusters are seen more clearly; the connection between the Hercules and Coma superclusters is also visible (reproduced by permission of the AAS and authors). |
Huchra initiated a near-infrared survey of nearby galaxies, the Two Micron All-Sky Survey (2MASS) (Huchra 2000, Skrutskie et al. 2006). Photometry in 3 near-infrared spectral bands is completed, it includes about half a million galaxies up to the limiting K magnitude 13.5. The redshifts are planned to be measured for all galaxies up to K = 11.25. The advantage of this survey is the coverage of low galactic latitudes up to 5 degrees from the Galactic equator. For the Southern sky the redshift survey of 2MASS galaxies is almost completed using the 6 degree Field Survey with the Australian large Schmidt telescope. The filamentary character of the distribution of galaxies is very well seen.
A much deeper redshift survey up to the blue magnitude 19.4 was recently completed using the Anglo-Australian 4-m telescope. This Two degree Field Galaxy Redshift Survey (2dFGRS) covers an equatorial strip in the Northern Galactic hemisphere and a contiguous area in the Southern hemisphere (Colless et al. 2001, Cross et al. 2001). Over 250 thousand redshifts have been measured, which allows to see and measure the cosmic web (supercluster-void network) up to the redshift 0.2, corresponding to a co-moving distance about 575 h-1 Mpc. The luminosity density field calculated for the Northern equatorial slice of the 2dFGRS is shown in Fig. 14.
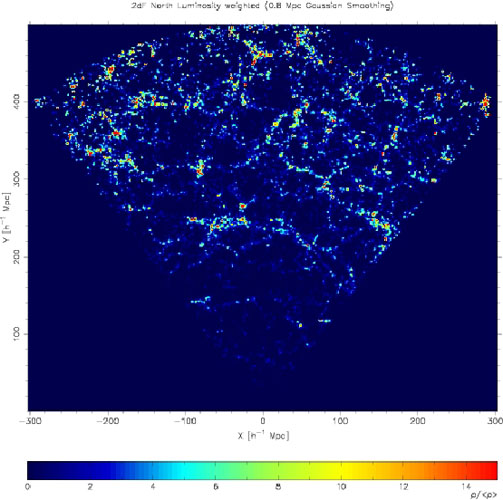 |
Figure 14. A wedge diagram of the luminosity density field of galaxies of the 2dFGRS Northern equatorial zone, ± 1.5 degrees around the equator. The luminosity densities have been corrected for the incompleteness effect; the RA coordinate is shifted so that the plot is symmetrical around the vertical axis. The rich supercluster at the distance ~ 250 h-1 Mpc from the observer is SCL126, according to the supercluster catalogue by Einasto et al. (2001). This figure illustrates the structure of the cosmic web (the supercluster-void network). The density field shows that rich superclusters contain many rich clusters of galaxies, seen in picture as red dots. Filaments consisting of less luminous galaxies and located between superclusters are also clearly seen (Einasto et al. 2007). |
Presently the largest project to map the Universe, the Sloan Digital Sky Survey (SDSS) mentioned already before, has been initiated by a number of American, Japanese and European universities and observatories (Yao et al. 2008, Stoughton et al. 2002, Zehavi et al. 2002). The goal is to map a quarter of the entire sky: to determine positions and photometric data in 5 spectral bands of galaxies and quasars of about 100 million objects down to the red magnitude r = 23, and redshifts of all galaxies down to r = 17.7 (about 1 million galaxies), as well as the redshifts of Luminous Red Giants (LRG, mostly central galaxies of groups and clusters) down to the absolute magnitude about -20. All 7 data releases have been made public. This has allowed to map the largest volume of the Universe so far. LRGs have a spatial density about 10 times higher than rich Abell clusters of galaxies, which allows to sample the cosmic web with sufficient details up to a redshift ~ 0.5.
5.3. Structure formation in the Cold Dark Matter scenario
A consistent picture of the structure formation in the Universe slowly emerged from the advancement in the observational studies of the large scale structure and the Cosmic Microwave Background, and in the development of theory. The most important steps along the way were the following.
Motivated by the observational problems with neutrino dark matter, a new dark matter scenario was suggested by Blumenthal et al. (1982), Bond et al. (1982), Pagels & Primack (1982), Peebles (1982), Bond & Szalay (1983), Doroshkevich & Khlopov (1984) with hypothetical particles as axions, gravitinos, photinos or unstable neutrinos playing the role of dark matter. This model was called the Cold Dark Matter (CDM) model, in contrast to the neutrino-based Hot Dark Matter model. Newly suggested dark matter particles move slowly, thus small-scale perturbations are not suppressed, which allows an early start of the structure formation and the formation of fine structure. Advantages of this model were discussed by Blumenthal et al. (1984).
Next, the cosmological constant,
 , was incorporated
into the scheme. Arguments favouring a model with the cosmological
constant were suggested already by
Gunn & Tinsley
(1975),
Turner et
al. (1984),
Kofman &
Starobinskii (1985):
combined constraints on the density of the Universe, ages
of galaxies, and baryon nucleosynthesis.
, was incorporated
into the scheme. Arguments favouring a model with the cosmological
constant were suggested already by
Gunn & Tinsley
(1975),
Turner et
al. (1984),
Kofman &
Starobinskii (1985):
combined constraints on the density of the Universe, ages
of galaxies, and baryon nucleosynthesis.
Finally, there was a change in the understanding of the formation of initial perturbations which later lead to the observed structure. To explain the flatness of the Universe the inflation scenario was suggested by Guth (1981), Kofman et al. (1985) and others. According to the inflation model in the first stage the expansion of the Universe was extremely rapid (this early stage is called the inflation epoch). Such an evolutionary scenario allows for the creation of the visible part of the Universe out of a small causally connected region and explains why in the large scale the Universe seems roughly uniform. Perturbations of the field are generated by small quantum fluctuations. These perturbations form a Gaussian random field, they are scale-invariant and have a purely adiabatic primordial power spectrum.
These ideas were progressively incorporated into the computer simulations of increasing complexity.
Pioneering numerical simulations of the evolution of the structure of the Universe were made in 1970s by Miller (1978), Aarseth et al. (1979) and the Zeldovich group (Doroshkevich et al. 1980a), using direct numerical integration. In early 1980s the Fourier transform was suggested to calculate the force field which allowed to increase the number of test particles.
Numerical simulations of structure evolution for the hot and cold dark
matter were compared by
Melott et
al. (1983),
and by White et al.
(1983,
1987)
(standard CDM model with density parameter
 m =
1). In contrast to the HDM model, in the CDM scenario the structure
formation starts at an early epoch, and superclusters consist of a
network of small galaxy filaments, similar to the observed distribution
of galaxies. Thus CDM simulations reproduce quite well the observed
structure with clusters, filaments and voids, including quantitative
characteristics (percolation or connectivity, the multiplicity
distribution of systems of galaxies).
m =
1). In contrast to the HDM model, in the CDM scenario the structure
formation starts at an early epoch, and superclusters consist of a
network of small galaxy filaments, similar to the observed distribution
of galaxies. Thus CDM simulations reproduce quite well the observed
structure with clusters, filaments and voids, including quantitative
characteristics (percolation or connectivity, the multiplicity
distribution of systems of galaxies).
Models with the cosmological
-term were
developed by
Gramann (1988).
Comparison of the SCDM and
CDM models
shows that the structure of the cosmic web is similar in both
models. However, in order to get a correct amplitude of density
fluctuations, the evolution of the SCDM model has to be stopped at an
earlier epoch.
The largest so far simulation of the evolution of the structure - the
Millennium Simulation - was made in the Max-Planck Institute for
Astrophysics in Garching by Volker Springel and collaborators
(Springel et
al. 2005,
Gao et al. 2005a,
Springel et
al. 2006).
The simulation is assuming the
CDM initial
power spectrum. A cube of the comoving size of
500 h-1 Mpc was simulated using about 10
billion dark matter particles that allowed to follow the evolution of
small-scale features in galaxies. Using a semi-analytic model the
formation and evolution of galaxies was also simulated
(Di Matteo et
al. 2005,
Gao et al. 2005b,
Croton et
al. 2006).
For simulated galaxies photometric properties,
masses, luminosities and sizes of principal components (bulge, disk)
were found. The comparison of this simulated galaxy catalogue with
observations shows that the simulation was very successful. The results
of the Millennium Simulation are frequently used as a starting point for
further more detailed simulations of evolution of single galaxies.
One difficulty of the original pancake scenario by Zeldovich is the shape of objects formed during the collapse. It was assumed that forming systems are flat pancake-like objects, whereas dominant features of the cosmic web are filaments. This discrepancy has found an explanation by Bond et al. (1996). They showed that in most cases just essentially one-dimensional structures, i.e. filaments form.
The CDM model of
structure formation and evolution combines
essential aspects of both original structure formation models, the
pancake and the hierarchical clustering scenario. First structures form
at very early epochs soon after the recombination in places where the
primordial matter has the highest density. This occurs in the central
regions of future superclusters. First objects to form are small dwarf
galaxies, which grow by infall of primordial matter and other small
galaxies. Thus, soon after the formation of the central galaxy other
galaxies fall into the gravitational potential well of the
supercluster. These clusters have had many merger events and have
"eaten" all its nearby companions. During each merger event the cluster
suffers a slight shift of its position. As merger galaxies come from all
directions, the cluster sets more and more accurately to the center of
the gravitational well of the supercluster. This explains the fact that
very rich clusters have almost no residual motion in respect to the
smooth Hubble flow. Numerous examples of the galaxy mergers are seen in
the images of galaxies collected by the Hubble Space Telescope.
