


2.1. Basic characteristics of the WIM and diagnostic tools
Our location within the disk of the Galaxy provides an opportunity to explore close up and in detail the distribution and physical properties of this ionized medium, including its ionization state and temperature. The basic features of the WIM are not very different from those first proposed by Hoyle and Ellis (1963). Temperatures range from about 6000 K to 10 000 K, and in the solar neighborhood, its average hydrogen ionization rate is approximately 4 × 10⁶ s-1 within a one cm2 column extending perpendicular through the Galactic disk, about 1/8th that available from stellar ionizing photons (e.g., Madsen et al. 2006, Reynolds 1984). The amount of ionization increases toward the Galactic center (e.g., Madsen and Reynolds 2005). In other galaxies, the average ionization rate is observed to be about 1/2 that available from the stars (see Section 4).
Two fundamental parameters of ionized gas along any line of sight,
s, are the dispersion measures (DM

 ne
ds), derived from pulsar observations, and the emission measure (EM
ne
nH+ ds
ne
ds), derived from pulsar observations, and the emission measure (EM
ne
nH+ ds
 ne2 ds), derived
from the intensity of the hydrogen Balmer-alpha
(H
ne2 ds), derived
from the intensity of the hydrogen Balmer-alpha
(H ) recombination
line or from the amount of free-free (Bremsstrahlung) emission or
absorption. Comparison of these measurements along common lines of sight
indicate that the H+ is clumped into regions having an
average electron density, ne = 0.03-0.08
cm-3, and filling a fraction, f
0.4-0.2,
of the volume within a 2000-3000 pc thick layer about the Galactic
midplane
(Hill et al.
2008,
Reynolds 1991b).
Data also suggest that the filling fraction increases from f
~ 0.1 at the midplane to f > 0.3-0.4 at |z| = 1000 pc
(Kulkarni and Heiles
1987,
Reynolds 1991b,
Gaensler et
al. 2008,
Berkhuijsen et
al. 2006).
The large, 1000-1800 pc scale
height, significantly larger than that of the neutral hydrogen layer,
has been deduced from both pulsar observations
(Reynolds 1989,
Gaensler et
al. 2008)
and from the rate of decrease in the
H intensity with
increasing Galactic latitude for the gas
associated with the Perseus spiral arm (e.g.,
Haffner et
al. 1999).
The WIM accounts for 90% or more of the ionized
hydrogen within the interstellar medium, and along lines of sight at
high Galactic latitude (i.e., away from the Galactic midplane), the
column density of the H+ is approximately 1/3 that of
the neutral hydrogen
(Reynolds
1991a).
) recombination
line or from the amount of free-free (Bremsstrahlung) emission or
absorption. Comparison of these measurements along common lines of sight
indicate that the H+ is clumped into regions having an
average electron density, ne = 0.03-0.08
cm-3, and filling a fraction, f
0.4-0.2,
of the volume within a 2000-3000 pc thick layer about the Galactic
midplane
(Hill et al.
2008,
Reynolds 1991b).
Data also suggest that the filling fraction increases from f
~ 0.1 at the midplane to f > 0.3-0.4 at |z| = 1000 pc
(Kulkarni and Heiles
1987,
Reynolds 1991b,
Gaensler et
al. 2008,
Berkhuijsen et
al. 2006).
The large, 1000-1800 pc scale
height, significantly larger than that of the neutral hydrogen layer,
has been deduced from both pulsar observations
(Reynolds 1989,
Gaensler et
al. 2008)
and from the rate of decrease in the
H intensity with
increasing Galactic latitude for the gas
associated with the Perseus spiral arm (e.g.,
Haffner et
al. 1999).
The WIM accounts for 90% or more of the ionized
hydrogen within the interstellar medium, and along lines of sight at
high Galactic latitude (i.e., away from the Galactic midplane), the
column density of the H+ is approximately 1/3 that of
the neutral hydrogen
(Reynolds
1991a).
Although originally detected by radio observations, subsequent
developments in high-throughput Fabry-Perot spectroscopy and CCD imaging
techniques have demonstrated that the primary source of information
about the distribution, kinematics, and other physical properties of the
WIM is through the detection and study of faint interstellar emission
lines at optical wavelengths. For example, the distribution of the
H+ is revealed by its interstellar
H
( 6563) recombination
line emission, which covers the
sky. Several deep H
surveys have given us our first detailed view
of the distribution and kinematics of this gas. Through CCD imaging,
Dennison et
al. (1998)
has provided partial coverage of the
total H intensity in the
northern sky, while
Gaustad et
al. (2001)
covered the southern sky at arcminute
resolution and sensitivities around 1 R
(106 / 4
6563) recombination
line emission, which covers the
sky. Several deep H
surveys have given us our first detailed view
of the distribution and kinematics of this gas. Through CCD imaging,
Dennison et
al. (1998)
has provided partial coverage of the
total H intensity in the
northern sky, while
Gaustad et
al. (2001)
covered the southern sky at arcminute
resolution and sensitivities around 1 R
(106 / 4 photons
cm-2 s-1
sr-1; EM = 2.25 cm-6 pc at 8000 K). The
Wisconsin H-Alpha Mapper (WHAM) carried out a velocity resolved survey
of the northern sky (dec. > 30°) at 12
km s-1 spectral resolution, 1° spatial
resolution, and ~ 0.1 R sensitivity
(Haffner et
al. 2003,
Tufte 1997).
The WHAM maps show WIM
emission in virtually every beam, with faint loops, filaments, and blobs
of emission superposed on a more diffuse background.
Finkbeiner
(2003)
has combined these three surveys to form a composite all-sky view of the
velocity-integrated H
(Fig. 1).
photons
cm-2 s-1
sr-1; EM = 2.25 cm-6 pc at 8000 K). The
Wisconsin H-Alpha Mapper (WHAM) carried out a velocity resolved survey
of the northern sky (dec. > 30°) at 12
km s-1 spectral resolution, 1° spatial
resolution, and ~ 0.1 R sensitivity
(Haffner et
al. 2003,
Tufte 1997).
The WHAM maps show WIM
emission in virtually every beam, with faint loops, filaments, and blobs
of emission superposed on a more diffuse background.
Finkbeiner
(2003)
has combined these three surveys to form a composite all-sky view of the
velocity-integrated H
(Fig. 1).
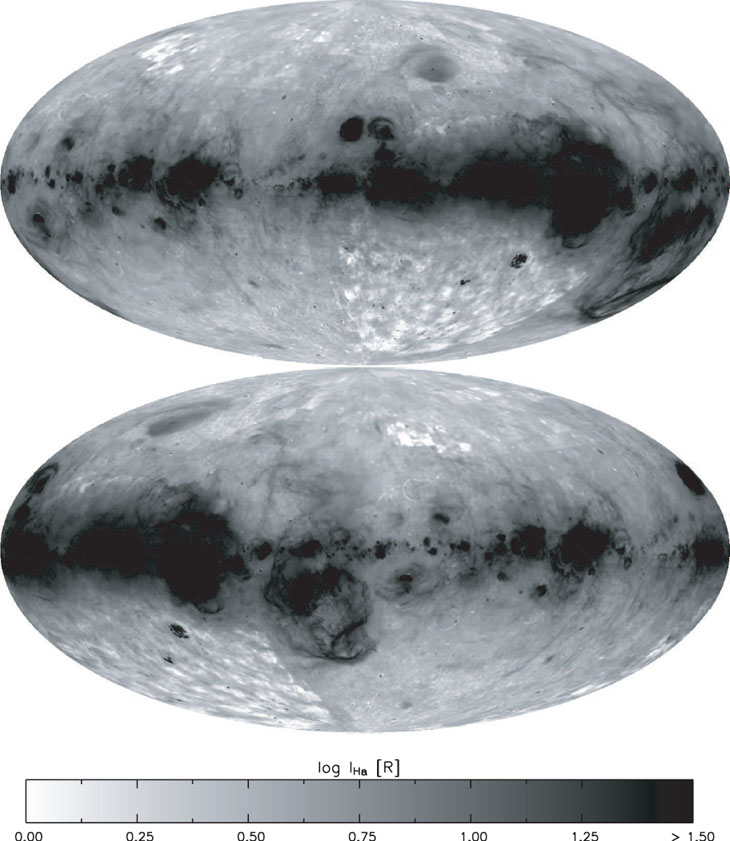 |
Figure 1. Composite all-sky velocity-integrated
H |
With these new maps and methods for detecting faint emission lines, we are
now able to investigate the physical conditions of the WIM, its
relationship to other components of the interstellar medium, and to
sources of ionization and heating within the Galaxy. In particular,
standard nebular line diagnostic techniques can now be employed to
examine the physical conditions in the gas. In the low density (~
10-1 cm-3) environment of the WIM, the collisional
excitation of an ion to a metastable state 2-3 eV above
ground by the thermal (~ 104 K) electrons is
followed by the decay back to the ground state via a
"forbidden" optical transition. Specifically, the ion's
excitation rate ri
 ni
ne Te-0.5
exp(-E / kTe), where
ni and ne are the
volume densities of the ions and electrons, respectively,
Te is the electron temperature, and E is
the energy of the metastable state above ground. Because thermal
equilibrium between electrons and ions is very rapid, the temperature of
the ions Ti = Te (e.g.,
Spitzer 1978).
Thus a
variation in the photon emissivity of a forbidden line from one
direction to the next traces variations in the temperature, density, and
abundance of the ion. The effects of density variations can be
eliminated by dividing the forbidden line intensity by the
H-recombination line intensity, both of which are proportional to the
product ni ne. From
the intensities of lines from a number of different ions and atoms, it
has been possible to study separately variations in the temperature and
the ionization state within the emitting gas. For many years, these
diagnostic techniques have been applied to a variety of astrophysical
plasmas (see, e.g.,
Osterbrock 1989,
Osterbrock and Ferland
2006,
Dopita and Sutherland
2003,
Ferland 2003,
Davidson and Netzer
1979)
for in depth discussions), but only more recently has it been possible
to use them to study the much fainter WIM emission lines.
ni
ne Te-0.5
exp(-E / kTe), where
ni and ne are the
volume densities of the ions and electrons, respectively,
Te is the electron temperature, and E is
the energy of the metastable state above ground. Because thermal
equilibrium between electrons and ions is very rapid, the temperature of
the ions Ti = Te (e.g.,
Spitzer 1978).
Thus a
variation in the photon emissivity of a forbidden line from one
direction to the next traces variations in the temperature, density, and
abundance of the ion. The effects of density variations can be
eliminated by dividing the forbidden line intensity by the
H-recombination line intensity, both of which are proportional to the
product ni ne. From
the intensities of lines from a number of different ions and atoms, it
has been possible to study separately variations in the temperature and
the ionization state within the emitting gas. For many years, these
diagnostic techniques have been applied to a variety of astrophysical
plasmas (see, e.g.,
Osterbrock 1989,
Osterbrock and Ferland
2006,
Dopita and Sutherland
2003,
Ferland 2003,
Davidson and Netzer
1979)
for in depth discussions), but only more recently has it been possible
to use them to study the much fainter WIM emission lines.
For example, in the WIM, the forbidden lines [S II]
6716 and
[N II] 6584
are found to have intensities with respect to
H that range from a
few tenths to unity or higher, significantly larger than what is
observed for the bright, classical emission nebulae (i.e., H II regions)
immediately surrounding O stars. This implies that the physical
conditions in the WIM differ significantly from conditions in classical
H II regions. In addition, because their intensities are comparable to
H, it has been possible
to map these lines over large parts of the sky (e.g.,
Madsen et al.
2006).
Other lines, such as [N II]
5755, He I
5876, [O III]
5007, and
[O I] 6300,
are much fainter and have been studied only in a few select
directions. These observations have helped to characterize the
ionization and temperature of the WIM as well as other extended ionized
regions of the Galaxy. Results reveal that not only are the temperature
and ionization conditions of the WIM significantly different from the
conditions in classical O star H II regions, but that the
conditions within the WIM itself vary considerably from one direction to
the next and even along a single line of sight
(Madsen et
al. 2006).
The strength of the ionizing radiation field responsible for the WIM can
be probed by measuring the
H surface brightness of
neutral hydrogen (H I) clouds
and by measuring the hydrogen ionization fraction
H+ / H within the WIM.
Field (1975)
pointed out that an H I cloud immersed in
an ionizing radiation field will have a skin of H+
with an emission measure that is directly proportional to the incident
photon flux. Using this fact,
Reynolds et
al. (1995)
found that an interstellar Lyman continuum flux
4
J 2 ×
106 photons cm-2 s-1
could account for most of the WIM's ionization. This flux implies an
ionizing photon density to electron density ratio (the ionization
parameter) of 10-4 to 10-3, which is one to two
orders of magnitude smaller than the ionization parameter in classical O
star H II regions. However, values in this range still imply that the
hydrogen is nearly fully ionized within the WIM. This is confirmed by
more direct measurements of the hydrogen ionization fraction from the
detection of neutral oxygen emission.
In theory, directly measuring the degree of H-ionization within warm,
ionized gas is simply a matter of observing the
[O I] 6300 emission line,
which is produced by collisions of neutral oxygen with thermal electrons
within the WIM. The first ionization potential of O is quite close to
that of H (13.595 eV and 13.614 eV, respectively) and the large
H+ + O0
 H0 + O+ charge-exchange cross
section keeps O+/O nearly equal to
H+ / H. Electron energies in
Te ~ 104 K gas are
sufficient to excite the ~ 2 eV
(3P-1D) transition that
results in the [O I]
6300
emission. Therefore, the intensity of this line relative to
H is directly related to
the amount of O0, and thus
H0, relative to H+ in warm ionized gas
(Reynolds et
al. 1998).
In practice, nature conspires to make this observation very difficult,
because [O I] is also one of the brightest
terrestrial emission lines in the night sky. Nevertheless,
high-sensitivity, high-resolution spectroscopic measurements with WHAM
have managed to resolve the Galactic emission from atmospheric emission
to provide reliable measurements in a few select directions. These
observations indicate that H+ / H > 90% for T
> 8000 K
(Reynolds et
al. 1998,
Hausen et
al. 2002]).
H0 + O+ charge-exchange cross
section keeps O+/O nearly equal to
H+ / H. Electron energies in
Te ~ 104 K gas are
sufficient to excite the ~ 2 eV
(3P-1D) transition that
results in the [O I]
6300
emission. Therefore, the intensity of this line relative to
H is directly related to
the amount of O0, and thus
H0, relative to H+ in warm ionized gas
(Reynolds et
al. 1998).
In practice, nature conspires to make this observation very difficult,
because [O I] is also one of the brightest
terrestrial emission lines in the night sky. Nevertheless,
high-sensitivity, high-resolution spectroscopic measurements with WHAM
have managed to resolve the Galactic emission from atmospheric emission
to provide reliable measurements in a few select directions. These
observations indicate that H+ / H > 90% for T
> 8000 K
(Reynolds et
al. 1998,
Hausen et
al. 2002]).
The time scale for recombination at a typical WIM density of
0.1 cm-3 is
1 Myr. This is shorter than the
lifetimes of O stars, the presumed ionizing sources, which implies
that the photoionization rate of the neutral hydrogen atoms within the
WIM is roughly balanced by the rate of hydrogen recombination. In this
case, the limit on H+ / H implies an ionizing
flux > 105 photons cm-2 s-1,
consistent with the ionizing photon flux derived from the
H
surface brightness of H I clouds.
Regarding heavier ions, observations reveal that in the WIM ions are generally in lower states of ionization than in classical O star H II regions (e.g., Madsen et al. 2006). The reason is not yet fully understood, since Lyman continuum photons emitted by massive O stars are almost certainly the primary source of ionization for the WIM (see Section 3 and Section 4 below). The lower ionization state could be due to a softening of portions of the spectrum as the radiation travels from the O stars to the WIM. Photoionization models (Wood and Mathis 2004, Hoopes and Walterbos 2003) show that the spectral processing of the radiation can be complex, with the radiation between the H I and He I ionization edges hardening with distance from the source, while the spectrum at higher energies softens. Moreover, hot evolved low mass stars (white dwarfs) and interface radiation associated with the hot (105-6 K) gas add harder photons to the mix (Section 6). Independently of the spectrum, the low ionization state of the WIM also could be the result of its low ionization parameter (Mathis 1986).
Constraints on the fluxes of higher energy (i.e., helium-ionizing)
photons are from observations of the He I recombination line at
5876 and the [O III]
5007 collisionally
excited line. Both of these transitions are prominent in O star
H II regions, where
I (> 24 eV) is high enough (and is
known to be high enough) to maintain He+ (24.6 eV)
and O++ (35.1 eV) at appreciable levels. Even qualitatively,
from the first attempts to detect these lines in the WIM
(Reynolds and Tufte
1995,
Reynolds 1985a),
it was clear that these ions were not as abundant in the WIM. More
recent WHAM observations found (He I /
H)WIM
~ 0.5 × (He I /
H)H II,
which when combined with the fact that H+ / H is
near unity (see above), implies that He+ / He
(> 24 eV) is high enough (and is
known to be high enough) to maintain He+ (24.6 eV)
and O++ (35.1 eV) at appreciable levels. Even qualitatively,
from the first attempts to detect these lines in the WIM
(Reynolds and Tufte
1995,
Reynolds 1985a),
it was clear that these ions were not as abundant in the WIM. More
recent WHAM observations found (He I /
H)WIM
~ 0.5 × (He I /
H)H II,
which when combined with the fact that H+ / H is
near unity (see above), implies that He+ / He
 60%. The [O III] / H
results are more varied, although the ratios are typically less (~ 10%)
those seen in H II regions
(Madsen 2004,
Madsen et al.
2006).
The abundance of [O III] in other galaxies and in the
interior regions of our Galaxy can be significantly higher than what is
observed in the WIM near the sun
(Rand 1997,
Madsen and Reynolds
2005).
60%. The [O III] / H
results are more varied, although the ratios are typically less (~ 10%)
those seen in H II regions
(Madsen 2004,
Madsen et al.
2006).
The abundance of [O III] in other galaxies and in the
interior regions of our Galaxy can be significantly higher than what is
observed in the WIM near the sun
(Rand 1997,
Madsen and Reynolds
2005).
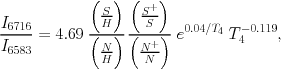
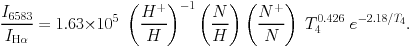
The temperature of photoionized gas is set by a balance between heating and cooling. Heat is injected by thermalization of the excess kinetic energy of the electron during the photoionization-recombination process (see, e.g., Osterbrock 1989). Other potential sources of heat could also be important, particularly at the low densities characteristic of the WIM (see e.g., Reynolds and Cox 1992). Cooling occurs primarily from the collisional excitation and subsequent radiative decay of metastable states (i.e., forbidden lines) of the trace ions (see, e.g., Osterbrock 1989 for a detailed discussion). The detection of some of these "cooling lines" in combination with the H-recombination emission have been used to explore the temperature of the gas, as discussed in more detail below. The observations have established that 1) on average the WIM is about 2000 K warmer than the denser, classical H II regions and 2) there are significant variations in temperature within the WIM, most notably an increase in temperature with increasing distance away from the midplane, and more generally, with decreasing emission measure (or gas density). The reason for this temperature behavior of the WIM is not yet clear; it could indicate that photoionization is not the only important source of heat in the WIM (Reynolds et al. 1999) or that perhaps the spectrum of the ionizing radiation is modified as it propagates far from its source (see Section 5).
Although they vary in accuracy and difficulty, three tools are available to explore the temperature of the WIM through optical emission lines:
and [O II] /
H trace variations in
Te: N+, O+,
and H+ are the dominant states of ionization for these
elements in the WIM. In addition, their emission lines have different
dependences on temperature, so that changes in [N II] /
H and [O II] /
H closely track changes
in Te. Empirically, where
IH
< 1 R, the brightnesses of the
primary optical forbidden lines of [N II], [S II], and [O II] become
comparable to H,
making these lines easier to detect and thus attractive diagnostic tools
for exploring variations in Te.
Calculating absolute temperatures is more uncertain due to necessary
assumptions about the exact ionic fractions and elemental abundances.
5755 /
[N II] 6583 measures
Te directly: The ratio of the
"auroral" (5755)
emission line (resulting from
excitations to a metastable state 4.0 eV above ground) to that of the
much brighter "nebular"
(6583) transition (1.9 eV
above ground) allows a derivation of Te with
the fewest assumptions. Since this ratio involves the same ion, it is
proportional to
e( E
/ k
Te), where Δ E is the
difference in the excitation energy of the two states. Near 8000 K,
a 2000 K change in temperature produces about a factor of two
change in the ratio. However, because
I5755 / I6583 ~ 0.01, this
observation is extremely difficult for the WIM, where
IH ~ 1 R.
E
/ k
Te), where Δ E is the
difference in the excitation energy of the two states. Near 8000 K,
a 2000 K change in temperature produces about a factor of two
change in the ratio. However, because
I5755 / I6583 ~ 0.01, this
observation is extremely difficult for the WIM, where
IH ~ 1 R.
line to
the width of an emission line from the
heavier N+ or S+ ion can be used to separate the
thermal from the nonthermal motions in the gas. However, very high
signal-to-noise ratio line profile measurements are needed because the
derived value of the ion temperature Ti is
proportional to the difference of the squares of the line widths.
Results using these techniques in recent observations are summarized below.
2.3.1. [N II], [S II] and [O II] with respect to
H
Two robust statements can be made about the line ratio observations:
,
[S II] / H, and [O II] /
H increase with decreasing
IH.
In the Galaxy, this rise is most dramatic below
IH = 1
R. The clearest examples of this are the large increases in the
forbidden line intensities relative to
H with increasing
distance from the midplane, both in our Galaxy
(Haffner et
al. 1999)
and others
(Rand 1998,
Tüllmann et
al. 2000).
and
[N II] / H vary greatly,
but are strongly correlated, often
with a nearly constant [S II] / [N II] ratio over large
regions. For the Galaxy, the ratio of [S II] / [N II] does not
vary by more than about a factor of two, except in the vicinity of a
discrete ionizing source (e.g., an O star).
 |
(1) |
which is only a very weak function of T4
(
Te/104 K). From
T4 = 0.5 to 1.0 with all else constant,
[S II] / [N II] decreases only about 11%. This relationship also
indicates that the relatively small but real variations of
[S II] / [N II] that are observed in the WIM are tracing
variations of S+ / N+. Combined with
the very different energies required for S+
 S++ (23.3 eV) and N+
N++ (29.6 eV), we conclude that
S+ / S, and especially
N+ / N, vary little in the WIM and that the
smaller (factor of two) variations in [S II] / [N II] are due
primarily to variations in S+ / S. This is
supported by photoionization models (e.g.,
Sembach et
al. 2000),
which have shown that N+ / N
0.8 over a wide range of input spectra and ionization parameters.
S++ (23.3 eV) and N+
N++ (29.6 eV), we conclude that
S+ / S, and especially
N+ / N, vary little in the WIM and that the
smaller (factor of two) variations in [S II] / [N II] are due
primarily to variations in S+ / S. This is
supported by photoionization models (e.g.,
Sembach et
al. 2000),
which have shown that N+ / N
0.8 over a wide range of input spectra and ionization parameters.
On the other hand, the strong temperature dependence of the forbidden
line intensities relative to
H is illustrated by the
relationship for the [N II] /
H
 |
(2) |
Because N+ / N and H+ / H
vary little within the WIM, variations in [N II] /
H
essentially trace variations in Te. Similar
relationships can be written for [O II], [S II], and for other
collisionally excited lines (see
Otte et al.
2001).
Using Eq. 1 and 2, we can construct diagnostic diagrams as presented by
Haffner et
al. (1999)
and
Madsen et al.
(2006)
to estimate both Te and
S+ / S from observations of [N II] /
H
and [S II] / H, as shown
in Fig. 2 (adapted from
Madsen 2004).
With sufficient
velocity resolution it has even been possible to study variations in
these parameters between different radial velocity components along the
same line of sight. These results reveal that within the WIM there are
variations in temperatures ranging between about 7000 K and
10000 K and variations in S+/S
between 0.3 to 0.7. For comparison, the bright classical H II
regions all cluster near the lower left corner of the plot,
[S II] / H
0.1 and [N II] /
H
0.25,
where Te = 6000-7000 K and S+ / S
0.25.
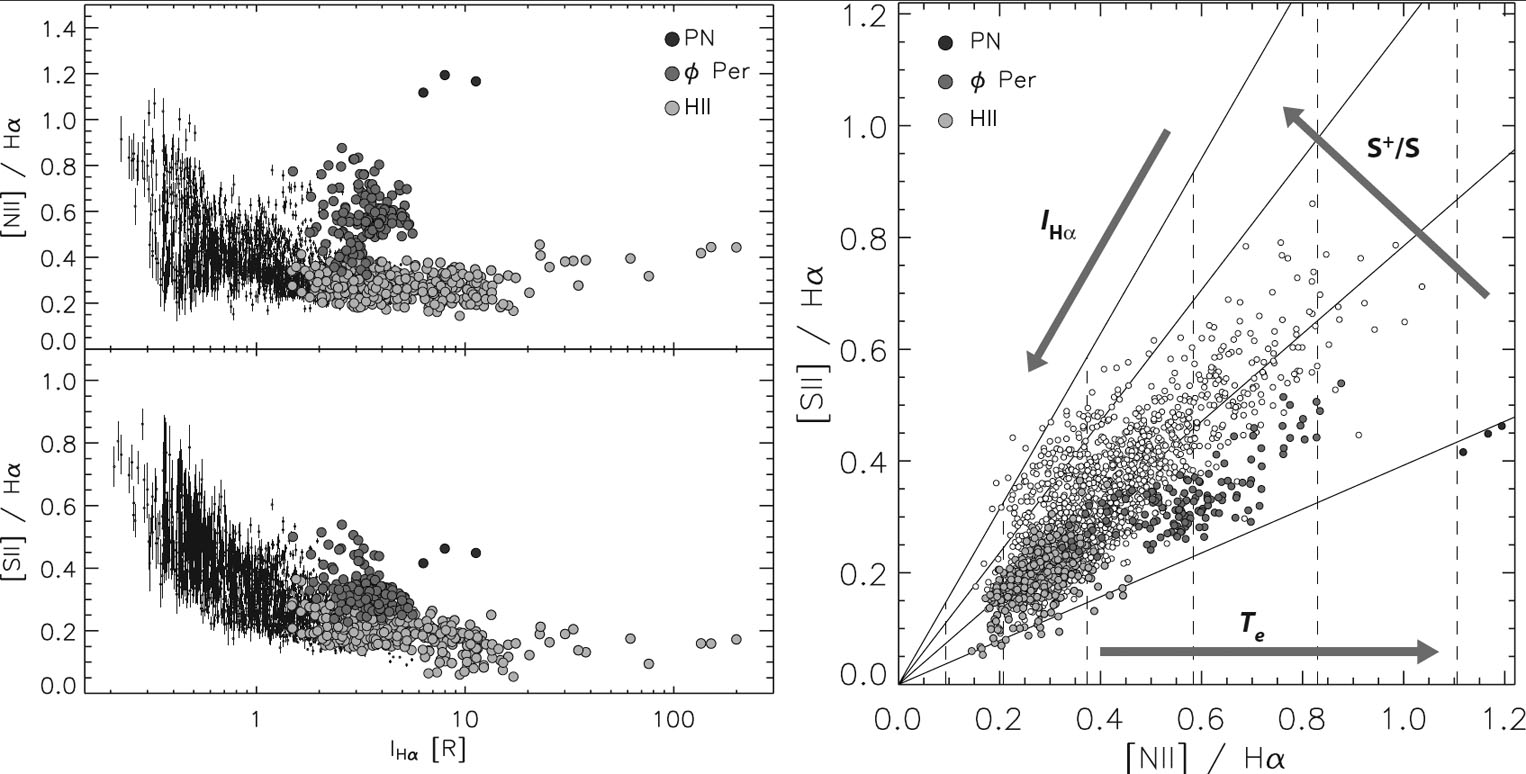 |
Figure 2. Diagnostic line ratio diagrams. A
large portion of the Galaxy in the direction of the Perseus arm
( |
[O II] at 3727 has a
larger excitation energy than
[N II], making it even more sensitive to variations in
Te. Although inaccessible with WHAM, several
extragalactic studies
(Otte et al.
2002,
Otte et al.
2001,
Tüllmann and
Dettmar 2000)
have traced this line, and new instrumentation is starting to allow
studies of [O II] from the WIM
(Mierkiewicz
et al. 2006)
of the Milky Way. The [O II] observations
confirm that the line ratio variations are dominated by variations in
Te.
2.3.2. [N II]
5755 / [N II]
6583
One of the most direct ways of measuring Te in
ionized gas is to observe the ratio of two emission lines from the same
ion but with very different excitation energies above ground. The
I4363 / I5007 ratio of [O III] in
bright H II regions
is perhaps the most famous of these pairs. In the WIM, because the
[O III] / H ratios
are typically no more than 10% of that in H II regions, the
isoelectronically similar [N II] line ratio,
I5755 / I6583, has been used instead.
By detecting this extremely weak line,
Reynolds et
al. (2001b)
and
Madsen (2004)
confirmed in select
directions that Te in the WIM is indeed higher
by about 2000 K than in the bright H II regions. However, the
details of the results reveal a more complicated temperature
structure-perhaps not surprisingly. Although current measurements
of the 5755 line still
have large uncertainties,
Fig. 3 indicates that Te
as inferred by the ratio of the [N II] lines is systematically
higher than that inferred by [N II] /
H in the same
directions. This could be explained by temperature variations along the
line of sight, since the
5755 line (excitation
energy 4 eV) would be produced preferentially in regions with higher
Te compared to the red line (2 eV).
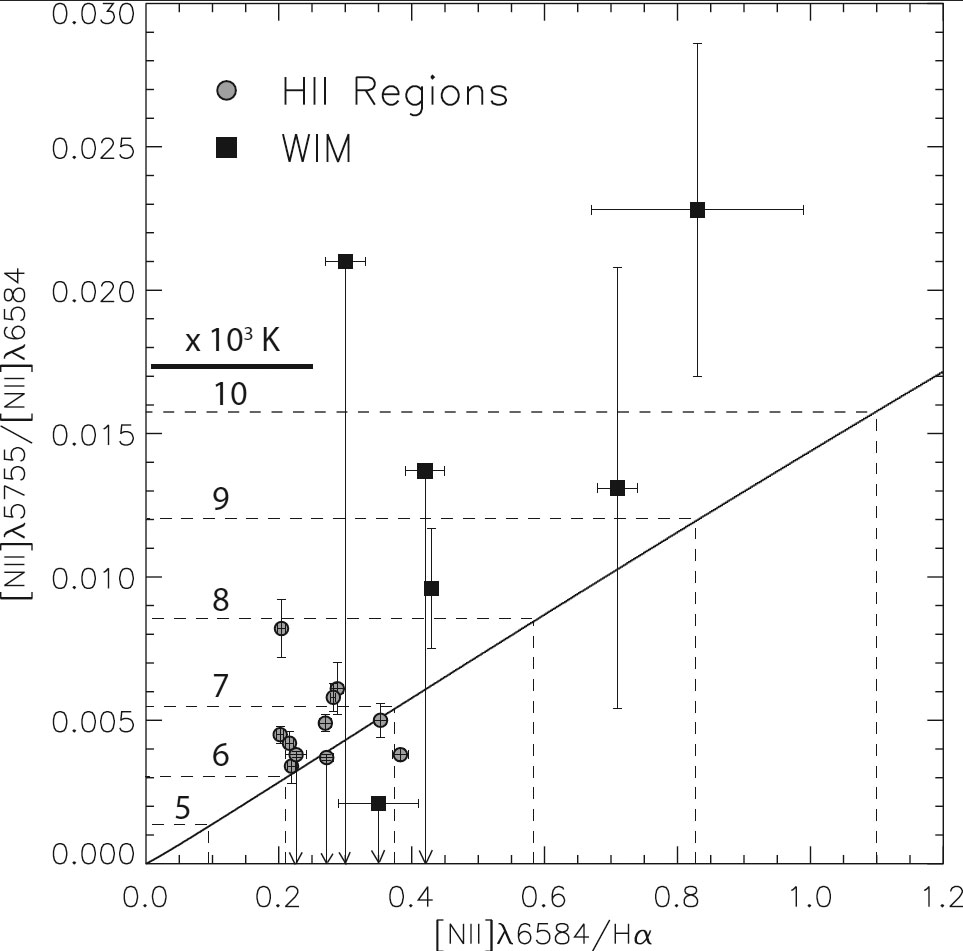 |
Figure 3. Elevated temperature in the
WIM. Select directions toward
( |
2.3.3 Line widths
If the intrinsic widths of emission lines can be measured accurately in ions having significantly different masses, then one can decompose the thermal motion (i.e., Ti) and non-thermal motion contributing to their widths. H and S are particularly good to use because they differ in mass by a factor of 32, resulting in a measurable difference in their widths. This method has been used with some success in both the WIM (Reynolds 1985b) and H II regions (Reynolds 1988).
The potential power of this technique is illustrated in
Fig. 4, which shows line width data for the
large, high
Galactic latitude H II region surrounding the O star (O9.5V)
 Oph. The
H from
this region spans an order of
magnitude in intensity and at the fainter end becomes comparable to WIM
emission at low Galactic latitudes (~ 10 R). The
Oph
H II region is particularly good for line width studies because
each emission line profile is very well described by a single Gaussian
component.
Baker et
al. (2004)
measured the widths of the
H, [S II], and [N II]
emission lines from this region
and derived accurate values for the temperature
Ti and the mode of the nonthermal speeds
vNT as shown in Fig. 4. The
large ranges in these parameters appears to
be real, with a noticeable gradient of increasing
Ti (from 6000 to 8000 K) and decreasing
vNT (from 8 to 4 km s-1) from
the center to edge of the H II region. The former is ascribed to
the hardening of the radiation field with increasing distance from the
source (also
Wood et al.
2005,
Section 5 below), while the latter could be
explained by a slow (2 km s-1) expansion of the H II region. A
future goal is to extend this method to the fainter and more
kinematically complex WIM.
Oph. The
H from
this region spans an order of
magnitude in intensity and at the fainter end becomes comparable to WIM
emission at low Galactic latitudes (~ 10 R). The
Oph
H II region is particularly good for line width studies because
each emission line profile is very well described by a single Gaussian
component.
Baker et
al. (2004)
measured the widths of the
H, [S II], and [N II]
emission lines from this region
and derived accurate values for the temperature
Ti and the mode of the nonthermal speeds
vNT as shown in Fig. 4. The
large ranges in these parameters appears to
be real, with a noticeable gradient of increasing
Ti (from 6000 to 8000 K) and decreasing
vNT (from 8 to 4 km s-1) from
the center to edge of the H II region. The former is ascribed to
the hardening of the radiation field with increasing distance from the
source (also
Wood et al.
2005,
Section 5 below), while the latter could be
explained by a slow (2 km s-1) expansion of the H II region. A
future goal is to extend this method to the fainter and more
kinematically complex WIM.
 |
Figure 4. Temperature Ti
and the mode vNT (most probable value) of the
non-thermal speed distribution of the diffuse H II region
surrounding |
In summary, the evidence is now overwhelming from a variety of methods that
in the WIM the temperature is elevated compared to the bright, classical
H II regions. In addition, the large variations in optical
forbidden line strength relative to
H within the WIM is
dominated by changes in temperature rather than changes in ionic
fractions or elemental abundances. When this is combined with the
well-established result that the forbidden line ratios relative to
H increase with
decreasing H intensity
(statement (a), above), we are led to the conclusion that the
temperature increases with decreasing emission measure
(Haffner et
al. 1999)
and thus decreasing gas density. These
temperature variations do not appear to be explained solely by
photoionization heating of the gas
(Wood and Mathis 2004,
Reynolds et
al. 1999),
suggesting additional heating sources for the WIM
(Weingartner and Draine
2001,
Minter and Spangler
1997,
Reynolds and Cox 1992)
that begin to dominate over photoionization heating at low densities (~
10-1 cm-3).
2.4. Warm ionized and neutral gas
The fact that hydrogen is nearly fully ionized within the
H
emitting gas (Section 2.2) implies that
H+ and H0 are primarily confined to
separate regions. With the advent of velocity resolved
H surveys
(i.e., WHAM), it is now possible to begin to explore the relationship
between the diffuse ionized gas and neutral gas in the interstellar
medium. Is the WIM the ionized portion of a low density
"intercloud medium"
(Miller and Cox 1993)
or is it mostly confined to the surfaces of
neutral clouds, the transition region between cooler gas and a much
hotter "coronal" temperature medium
(McKee and Ostriker
1977)?
Do the ionized and neutral phases cycle from one to the other?
Cox and Helenius
(2003)
and
Lockman (2004),
for example, have
suggested that portions of the ionized medium may condense into neutral
clouds. However, to date there have been no observational studies of the
H+ - H0 connection. In a
general qualitative sense, a comparison of the optical line profiles
with the radio 21 cm (H I) profiles (e.g.,
Hartmann and Burton
1997),
indicates that at high latitudes the ionized gas tends to be correlated
in space and velocity with the so-called warm neutral medium (WNM), the
wide-spread, T ~ 103 K phase of the H I generally
associated with broad 21 cm profiles. There is very little
correspondence between the
H and the narrow-line 21
cm emission components associated with the colder (T ~
102 K), denser H I clouds. In regions of the sky
that contain anomalous velocity structures, specifically, the
intermediate and high velocity clouds that are not co-rotating with the
Galactic disk, the correlation is quite strong
(Haffner et
al. 2001,
Tufte et al.
1998).
The optical and radio emission components are centered at nearly the same
velocities (within roughly 5 km s-1) and have comparable
velocity extents in cases of complicated, blended profiles. Few regions
seem to contain only a WNM or only a WIM component. This relationship
has been hinted at through various detailed absorption line and emission
line studies over the last decade
(Spitzer and
Fitzpatrick 1993,
Howk et al.
2003,
Reynolds et
al. 1995),
which together with observations of the [O I]
6300 /
H line
intensity ratio (Section 2.3 above) suggest that a
significant amount of the H+ is associated with nearly
fully ionized regions in contact with (or at least adjacent to) regions
of warm primarily neutral hydrogen. Hopefully a systematic examination
of the kinematic and spatial correlation between these ionized and
neutral phases of the medium will be carried out soon.
Although there is a close correspondence on the sky and in velocity
between the warm neutral and ionized emission lines, their intensities
do not appear to be correlated. This has been examined in detail only
toward two intermediate velocity H I clouds, Complexes L and K
(Haffner 2005,
Haffner et
al. 2001).
In both cases, the column density of the neutral
hydrogen NH I and the
H intensity,
IH,
are uncorrelated. Whether
this holds for more local gas in the Galactic disk still needs to be
fully explored. A straightforward explanation for this lack of
correlation is the fact that the intensity of the
H is determined
solely by the flux of ionizing radiation incident on the warm
H I cloud
(Reynolds et
al. 1995),
which of course, is independent of the cloud's column density because
the H I clouds are optically thick to the Lyman continuum photons.
One of the basic questions concerning the nature of the WIM is how
ionizing photons from the O stars can travel hundreds of parsecs through
the disk and into the halo. A fractal morphology of the interstellar
medium is one possibility (see Section 5).
Another is the existence of enormous, H I-free bubbles surrounding some
of the O stars, which allow the Lyman continuum photons to travel
through the cavity to ionize its distant walls (e.g.,
Reynolds and Ogden
1979,
Norman and Ikeuchi
1989,
McClure-Griffiths
et al. 2006 ,
Pidopryhora et
al. 2007).
A WHAM study of one of these bubbles, the Perseus superbubble
(Madsen et
al. 2006,
Reynolds et
al. 2001a),
has shown that a luminous O-star cluster near the midplane can indeed
produce wide-spread, nearly WIM-like ionization conditions out to
distances of 1000 pc or more from the ionizing stars. However, the
[N II] / H and [S II] /
H ratios of the superbubble
wall are not quite as large as the ratios observed in the surrounding
WIM, suggesting that bubble size, gas density within the shell,
supplemental heating, and/or the flux and spectrum of the radiation
escaping the O-star cluster may also be important in setting the
conditions of the ionized gas.

 1
cm-6 pc) emission maps. The two Aitoff-Hammer
projections are centered at (top)
1
cm-6 pc) emission maps. The two Aitoff-Hammer
projections are centered at (top)
 = 0° and
(bottom)
= 0° and
(bottom)  )
brighter diffuse ionized
regions show elevated line ratios in both [N II] /
H
)
brighter diffuse ionized
regions show elevated line ratios in both [N II] /
H ) H II
regions. Dashed lines mark select temperatures derived from each line
ratio while the diagonal line traces "unity" in this
derived temperature space. WIM directions have higher derived
temperatures using either line ratio, but are also systematically above
the line of "unity", suggesting that measurable temperature
inhomogeneities exist along these lines of sight. From
) H II
regions. Dashed lines mark select temperatures derived from each line
ratio while the diagonal line traces "unity" in this
derived temperature space. WIM directions have higher derived
temperatures using either line ratio, but are also systematically above
the line of "unity", suggesting that measurable temperature
inhomogeneities exist along these lines of sight. From