


With a volume as large as the Hubble Volume simulation,
and an adequate number of intermediate snapshots in time,
it is possible to portray the growth of comic structure "on the
lightcone"; that is, just as we observe the real universe. A graphical
depiction of that is shown in Fig. 23;
here only a thin slice through the narrow 3D lightcone is shown. Here
one sees the time
evolution of the galaxy cluster population over the redshift interval 0
 z
3.
Despite the low spatial and mass resolution of the simulation, it is
plain that cluster size objects appear rather late in the evolution of
the universe.
z
3.
Despite the low spatial and mass resolution of the simulation, it is
plain that cluster size objects appear rather late in the evolution of
the universe.
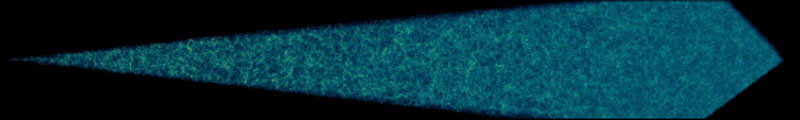 |
Figure 23. Growth of cosmic structure "on the lightcone", derived from the Hubble Volume Simulation [76]. |
At present, it is not possible to simulate volumes this large and at the
same time resolve the internal structure of galaxy clusters including
the baryonic component. However, by simulating somewhat smaller (but
still large) volumes, and exploiting the periodicity of the boundary
conditions, it is still possible to generate lightcones
for the purposes of synthetic deep redshift cluster surveys. An example
of this is shown in
Fig. 24 and described in more detail in Hallman
et al. (2007)
[77].
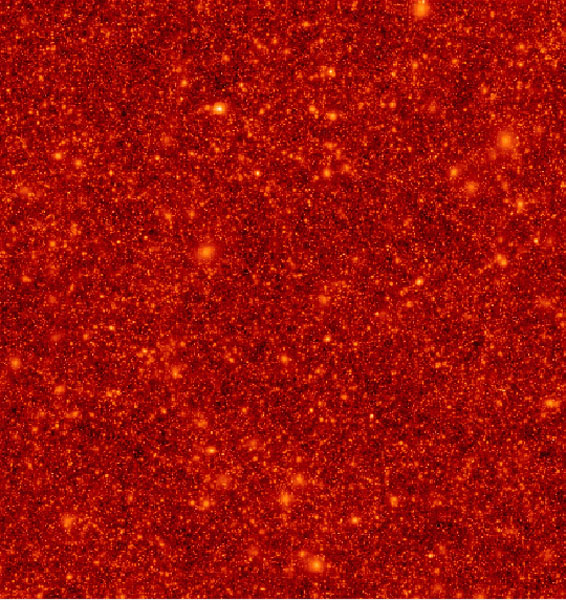
It shows a 100 square degree projected lightcone image of the Compton y
parameter due to the
thermal SZE from galaxy clusters over the redshift interval 0.1
z
3.
In order to produce this image, 27 redshift outputs from the AMR
hydrodynamic simulation shown in
Fig. 1 are stacked at
 z intervals
of 0.1. The simulation has a dark matter
particle mass of 7.3 × 10¹⁰
M
z intervals
of 0.1. The simulation has a dark matter
particle mass of 7.3 × 10¹⁰
M and a
maximum spatial resolution of 7.8 h-1
comoving kpc. This allows a fairly complete sample of clusters above
Mhalo
and a
maximum spatial resolution of 7.8 h-1
comoving kpc. This allows a fairly complete sample of clusters above
Mhalo
 4 ×
1013
M
(Fig. 9).
In order to avoid repeating structures, each redshift "shell" of the
lightcone is generated by projecting through the cube along a different
random axis, and then exploiting periodicity to shift and fill the
required solid angle. Using different random seeds for orientation and
shift, multiple lightcone realizations can be made from a single
simulation in order quantify sampling errors due to cosmic variance.
4 ×
1013
M
(Fig. 9).
In order to avoid repeating structures, each redshift "shell" of the
lightcone is generated by projecting through the cube along a different
random axis, and then exploiting periodicity to shift and fill the
required solid angle. Using different random seeds for orientation and
shift, multiple lightcone realizations can be made from a single
simulation in order quantify sampling errors due to cosmic variance.
 |
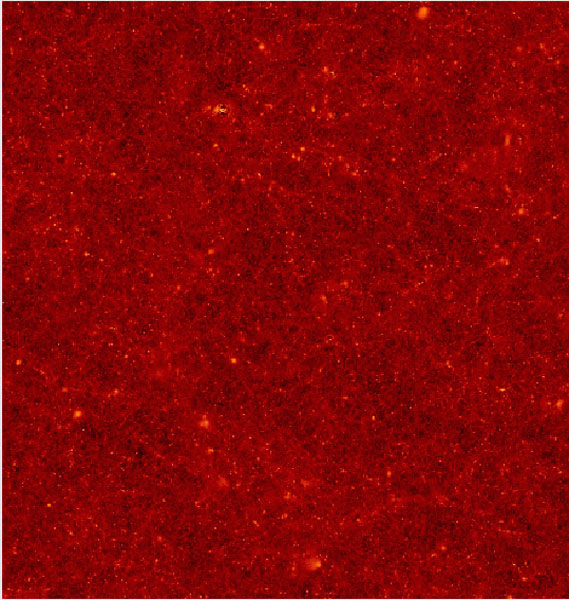 |
Figure 24. Left: 100 deg2
projection lightcone image of the Compton y-parameter from
a 5123 the Enzo AMR simulation shown in
Fig. 1.
Right: same as left panel, except removing the contribution of all
virialized gas inside clusters of mass M
|
|
With such lightcone datasets, it is possible to mock up the blind SZE surveys that are being carried out by Planck, ACT, and SPT/APEX-SZ [77]. First, an observing frequency is chosen. Then an image similar to that shown in Fig. 24 is generated using the approprate frequency-dependent SZE signal (see Rephaeli, these proceedings). Second, the image is convolved with the PSF of the relevant instrument. For the instruments listed above, the beam size assumed is 7.1, 1.7, and 1 arcmin, respectively at 144 GHz. Finally, noise is added to the image at the level of the design sensitivities for the instruments, which are assumed to be 6, 2 and 10 µ K per beam, respectively. These images are shown in Fig. 25. The graph at the upper right hand corner of Fig. 25 shows the angular power spectrum computed for the three instruments, as well as the raw image before degrading resolution and sensitivity. The solid lines show the average power spectrum over 200 lightcone realizations, while the dotted lines show the range in which 90% of the power is found. One can see the effects of finite angular resolution by the sharp turnover of the angular power at high multipoles. All instruments recover the "theoretical" power at low multipoles, however. Cosmic variance can change the measured power by factors of 5-8, implying that converged measurements of the real power will require very large areas of the sky to be mapped.
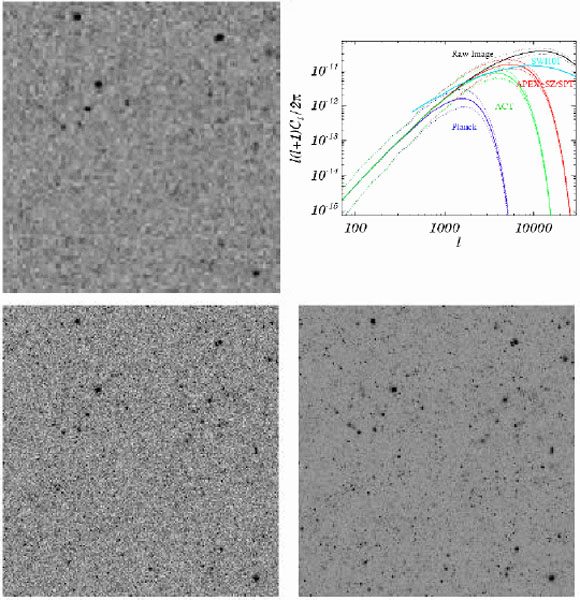 |
Figure 25. Top Left: 100 deg2 projection lightcone image of the Compton y-parameter modified to model angular resolution and sensitivity of the Planck Surveyer all sky survey at 144 GHz. Top Right: Angular power spectrum generated from these images. Bottom Left: same as image in top left, except for Apex-SZ and SPT survey characteristics. Bottom Right: same as image in top left, except for ACT survey characteristics. From [77]. |
With simulated lightcones, one can ask whether projection effects damage
the potential of SZE surveys to constrain cosmological parameters. As
discussed in Sec. 3.6
above, counting clusters down to a limiting mass/flux versus redshift is a
strong probe of cosmology, especially the parameters
 m and
m and
 8.
This requires calibrating the Y-M relation, where Y is the integrated SZE
and M is the cluster mass. Motl et al. (2005)
[46]
and Nagai (2006)
[71]
showed using hydrodynamic cosmological simulations that there is a tight
correlation between these two quantities that is rather insensitive to
assumed baryonic processes (cooling, star formation, feedback, etc.)
However, because the SZE signal is redshift independent, when galaxy
clusters are observed projected against the sky, foreground objects such
as other clusters, hot gas outside the virial radius, and Warm-Hot
Intergalactic Medium (WHIM) may contribute to the total signal and spoil
the tight correlation.
Hallman et al. (2007)
showed that indeed this is the case, as indicated in
Fig. 26. On the left
is the Y-M relation scatter plot deduced from the simulation data
itself, while on the right we see the clusters in projection. The tight
correlation intrinsic to individual clusters is destroyed by other
contributions to the SZ signal along
the LOS, especially for the more numerous low mass clusters. As visual proof
of this we show in the right panel of Fig. 24
the projected SZ signal removing the contribution
of all cluster gas inside the virial radii of every cluster with
M
8.
This requires calibrating the Y-M relation, where Y is the integrated SZE
and M is the cluster mass. Motl et al. (2005)
[46]
and Nagai (2006)
[71]
showed using hydrodynamic cosmological simulations that there is a tight
correlation between these two quantities that is rather insensitive to
assumed baryonic processes (cooling, star formation, feedback, etc.)
However, because the SZE signal is redshift independent, when galaxy
clusters are observed projected against the sky, foreground objects such
as other clusters, hot gas outside the virial radius, and Warm-Hot
Intergalactic Medium (WHIM) may contribute to the total signal and spoil
the tight correlation.
Hallman et al. (2007)
showed that indeed this is the case, as indicated in
Fig. 26. On the left
is the Y-M relation scatter plot deduced from the simulation data
itself, while on the right we see the clusters in projection. The tight
correlation intrinsic to individual clusters is destroyed by other
contributions to the SZ signal along
the LOS, especially for the more numerous low mass clusters. As visual proof
of this we show in the right panel of Fig. 24
the projected SZ signal removing the contribution
of all cluster gas inside the virial radii of every cluster with
M  5 ×
1013
M. Roughly 1/3 of the flux of the original
image remains after this subtraction is done. A majority of it arises in the
hot gas immediately outside the virial radius of clusters which was
heated by prior epochs of structure formation, while some comes from the
WHIM
[107].
This signal is entirely absent
in analytic or semi-analytic models of the SZE in which the baryons are
painted on a halo population taken from a Press-Schechter analysis or
pure dark matter N-body simulation. This highlights the importance of
performing self-consistent hydrodynamic simulations and including the
effects of foregrounds through detailed lightcone analyses.
5 ×
1013
M. Roughly 1/3 of the flux of the original
image remains after this subtraction is done. A majority of it arises in the
hot gas immediately outside the virial radius of clusters which was
heated by prior epochs of structure formation, while some comes from the
WHIM
[107].
This signal is entirely absent
in analytic or semi-analytic models of the SZE in which the baryons are
painted on a halo population taken from a Press-Schechter analysis or
pure dark matter N-body simulation. This highlights the importance of
performing self-consistent hydrodynamic simulations and including the
effects of foregrounds through detailed lightcone analyses.
 |
 |
Figure 26. Left: Scatter plot of Y-M relation (corrected for cosmological evolution) taken directly from simulation data. Right: same as left panel except taken from lightcone projections which include SZE signal from hot gas along the LOS to the cluster. Tight correlation is severely degraded by projection effects. From [77]. |
|
The author is indebted to his collaborators Greg Bryan, Jack Burns, David Collins, Claudio Gheller, Eric Hallman, Hui Li, Chris Loken, Patrick Motl, Franco Vazza, and Hao Xu whose results, both published and unpublished, is presented here. Simulations were performed at the San Diego Supercomputer Center at the University of California, San Diego with partial support of grants NSF AST-0708960 and AST-0808184.