


Observational studies of galaxy clusters have now developed into a broad, multi-faceted and multi-wavelength field. Before we embark on our overview of different theoretical aspects of cluster formation, we briefly review the main observational properties of clusters and, in particular, the basic properties of their main matter constituents.
Figure 1 shows examples of the multiwavelength observations of two massive clusters at two different cosmic epochs: the Abell 1689 at z = 0.18 and the SPT-CL J2106-5844 at z = 1.133. It illustrates all of the main components of the clusters: the luminous stars in and around galaxies (the intracluster light or ICL), the hot ICM observed via its X-ray emission and the Sunyaev-Zel'dovich effect and, in the case of Abell 1689, even the presence of invisible DM manifesting itself through gravitational lensing of background galaxies distorting their images into extended, cluster-centric arcs (Bartelmann 2010, and references therein). At larger radii, the lensing effect is weaker. Although not easily visible by eye, it can still be reliably measured by averaging the shapes of many background galaxies and comparing the average with the expected value for an isotropic distribution of shapes. The gravitational lensing is a direct probe of the total mass distribution in clusters, which makes it both extremely powerful in its own right and a very useful check of other methods of measuring cluster masses. The figure shows several bright elliptical galaxies that are typically located near the cluster center. A salient feature of such central galaxies is that they show little evidence of ongoing star formation, despite their extremely large masses.
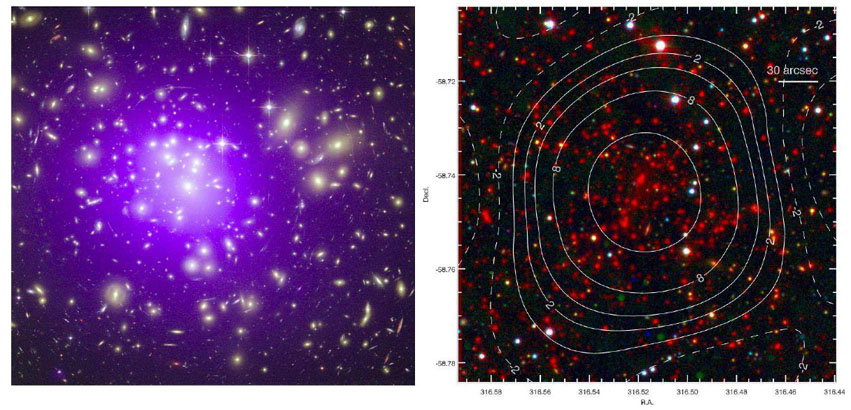 |
Figure 1. Left panel: the composite
X-ray/optical image (556 kpc on a
side) of the galaxy cluster Abell 1689 at redshift z = 0.18. The
purple haze shows X-ray emission of the T ~ 108 K
gas, obtained by the Chandra X-ray Observatory. Images of
galaxies in the optical band,
colored in yellow, are from observations performed with the Hubble
Space Telescope. The long arcs in the optical image are caused by
the gravitational lensing of background galaxies by matter in the
galaxy cluster, the largest system of such arcs ever found
(Credit:X-ray: NASA/CXC/MIT; Optical: NASA/STScI). Right panel: the
galaxy cluster SPT-CL J2106-5844 at z = 1.133, the most massive
cluster known at z > 1 discovered via its Sunyaev-Sel'dovich
(SZ) signal (M200
|
The diffuse plasma is not associated with individual galaxies and
constitutes the intra-cluster medium, which contains the bulk of the
normal baryonic matter in massive clusters. Although the hot ICM is
not directly associated with galaxies, their properties are
correlated. For example, Fig. 2 shows the mass
of the ICM gas within the radius R500, defined as the
radius enclosing mean overdensity of
 c =
500
c =
500 cr, versus stellar mass in galaxies
within the same radius for a number of local (z
cr, versus stellar mass in galaxies
within the same radius for a number of local (z
 0.1) and
distant (0.1 < z < 0.6) clusters
(Lin et
al. 2012).
Here cr(z) =
3H(z)2 /
(8
0.1) and
distant (0.1 < z < 0.6) clusters
(Lin et
al. 2012).
Here cr(z) =
3H(z)2 /
(8 G is the critical
mean density of the Universe, defined in terms of the Hubble function
H(z). The figure
shows a remarkably tight, albeit non-linear, correlation between these
two baryonic components. It also shows that the gas mass in clusters
is on average about ten times larger than the mass in stars, although
this ratio is systematically larger for smaller mass clusters, ranging
from M∗ / Mg
G is the critical
mean density of the Universe, defined in terms of the Hubble function
H(z). The figure
shows a remarkably tight, albeit non-linear, correlation between these
two baryonic components. It also shows that the gas mass in clusters
is on average about ten times larger than the mass in stars, although
this ratio is systematically larger for smaller mass clusters, ranging
from M∗ / Mg
 0.2 to
0.05, as mass
increases from group scale (M500 ~ few ×
1013
M
0.2 to
0.05, as mass
increases from group scale (M500 ~ few ×
1013
M ) to
massive clusters (M500 ~ 1015
M).
) to
massive clusters (M500 ~ 1015
M).
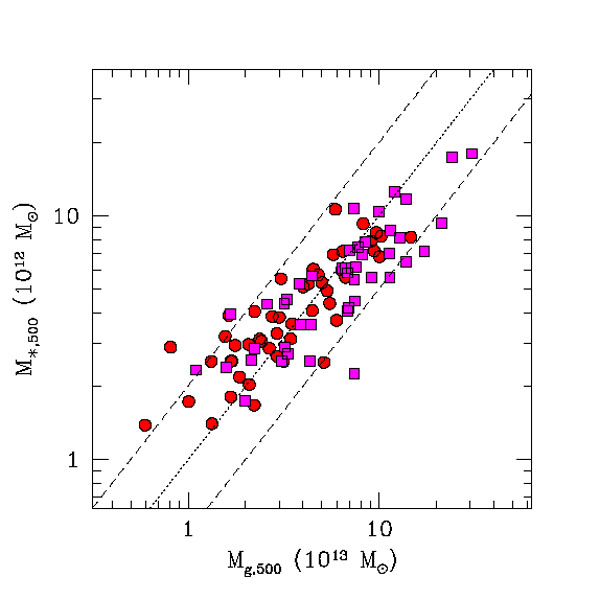 |
Figure 2. The mass in stars vs. the mass of
hot, X-ray emitting gas. Both masses are measured within the radius
R500 estimated from the observationally calibrated
YX - M500 relation,
assuming flat
|
The temperature of the ICM is consistent with velocities of galaxies and indicates that both galaxies and gas are nearly in equilibrium within a common gravitational potential well. The mass of galaxies and hot gas is not sufficient to explain the depth of the potential well, which implies that most of the mass in clusters is in a form of DM. Given that hydrogen is by far the most abundant element in the Universe, most of the plasma particles are electrons and protons, with a smaller number of helium nuclei. There are also trace amounts of heavier nuclei some of which are only partially ionized. The typical average abundance of the heavier elements is about one-third of that found in the Sun or a fraction of one per cent by mass; it decreases with increasing radius and can be quite inhomogeneous, especially in merging systems (Werner et al. 2008, for a review).
Thermodynamic properties of the ICM are of utmost importance, because
comparing such properties to predictions of baseline models without
cooling and heating can help to isolate the impact of these physical
processes in cluster formation. The most popular baseline model is
the self-similar model of clusters developed by
Kaiser (1986),
which we consider in detail in
Section 3.9 below. In its
simplest version, this model assumes that clusters are scaled versions
of each other, so that gas density at a given fraction of the
characteristic radius of clusters, defined by their mass, is
independent of cluster mass. Figure 3 shows the
electron density in clusters as a function of ICM temperature (and
hence mass) at different radii. It is clear that density is independent
of temperature only outside cluster core at r ~
R500, although there is an indication that
density is independent of temperature at r =
R2500 for kBT
 3 keV. This
indicates that processes associated with
galaxy formation and feedback affect the properties of clusters at
r
R2500, but their effects are mild at larger radii.
3 keV. This
indicates that processes associated with
galaxy formation and feedback affect the properties of clusters at
r
R2500, but their effects are mild at larger radii.
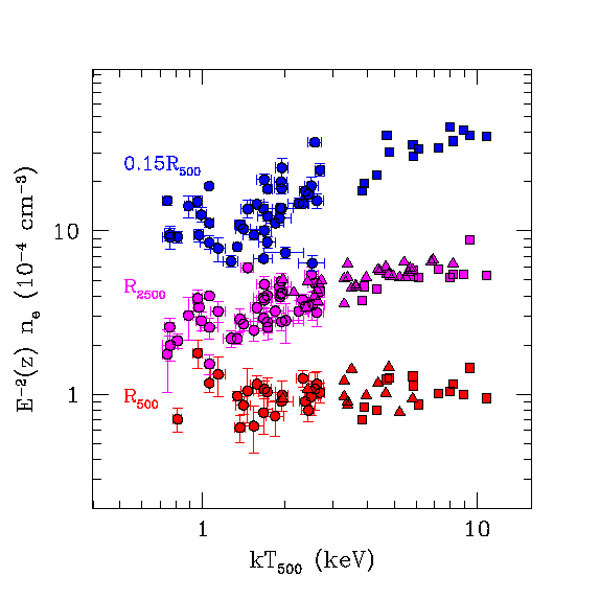 |
Figure 3. The observed electron number density, ne, in galaxy clusters and groups, measured at different radii (from top to bottom: 0.15R500, R2500, R500; see labels) as a function of the intracluster medium temperature at R500. The values of ne are rescaled by E-2(z), the scaling expected from the definition of the radii at which densities are measured. Squares and circles show systems observed with the Chandra X-ray Observatory from the studies by Vikhlinin et al. (2009a) and Sun et al. (2009), triangles show systems observed with the XMM-Newton telescope by Pratt et al. (2010). Note that electron densities at large radii are independent of temperature, as expected from the self-similar model, whereas at small radii the rescaled densities increase with temperature. Note also that the scatter from cluster to cluster increases with decreasing radius, especially for low-temperature groups (after Sun 2012). |
During the past two decades, it has been established that the core regions of the relaxed clusters are generally characterized by a strongly peaked X-ray emissivity, indicating efficient cooling of the gas (e.g., Fabian 1994). Quite interestingly, spectroscopic observations with the Chandra and XMM-Newton satellites have demonstrated that, despite strong X-ray emission of the hot gas, only a relatively modest amount of this gas cools down to low temperatures (e.g., Peterson et al. 2001, Böhringer et al. 2001). This result is generally consistent with the low levels of star formation observed in the brightest cluster galaxies (BCGs; e.g., McDonald et al. 2011). It implies that a heating mechanism should compensate for radiative losses, thereby preventing the gas in cluster cores to cool down to low temperature. The presence of cool cores is also reflected in the observed temperature profiles (e.g. Leccardi & Molendi 2008, Pratt et al. 2007, Vikhlinin et al. 2006, see also Figure 4), which exhibit decline of temperature with decreasing radius in the innermost regions of relaxed cool-core clusters.
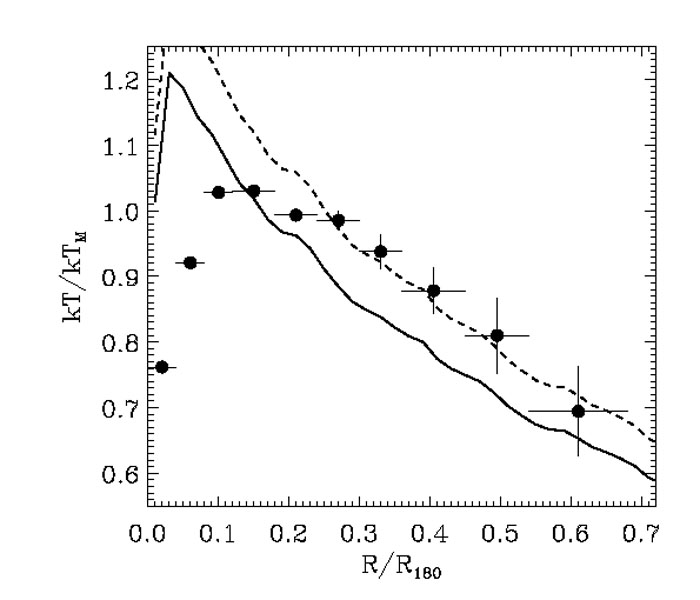 |
Figure 4. Comparison between temperature
profiles, normalized to the
global temperature measured within R180 by
Leccardi
& Molendi (2008),
for a set of about 50 nearby clusters with z
|
One of the most important and most widely studied aspects of ICM properties are correlations between its different observable integrated quantities and between observable quantities and total mass. Such scaling relations are the key ingredient in cosmological uses of clusters, where it is particularly desirable that the relations are characterized by small scatter and are independent of the relaxation state and other properties of clusters. Although clusters are fascinatingly complex systems overall, they do exhibit some remarkable regularities. As an example, Figure 5 shows the correlation between the bolometric luminosity emitted from within R500 and the YX parameter defined as a product of gas mass within R500 and ICM temperature derived from the X-ray spectrum within the radial range (0.15 - 1)R500 (Kravtsov, Vikhlinin & Nagai 2006) for the Representative XMM-Newton Cluster Structure Survey (REXCESS) sample of clusters studied by Pratt et al. (2009). Different symbols indicate clusters in different states of relaxation, whereas clusters with strongly peaked central gas distribution (the cool core clusters) and clusters with less centrally concentrated gas distribution are shown with different colors. The left panel shows total luminosity integrated within radius R500, wheareas the right panel shows luminosity calculated with the central region within 0.15R500 excised. Quite clearly, the core-excised X-ray luminosity exhibits remarkably tight correlation with YX, which, in turn, is expected to correlate tightly with total cluster mass (Kravtsov, Vikhlinin & Nagai 2006, Stanek et al. 2010, Fabjan et al. 2011). This figure illustrates the general findings in the past decade that clusters exhibit strong regularity and tight correlations among X-ray observable quantities and total mass, provided that relevant quantities are measured after excluding the emission from cluster cores.
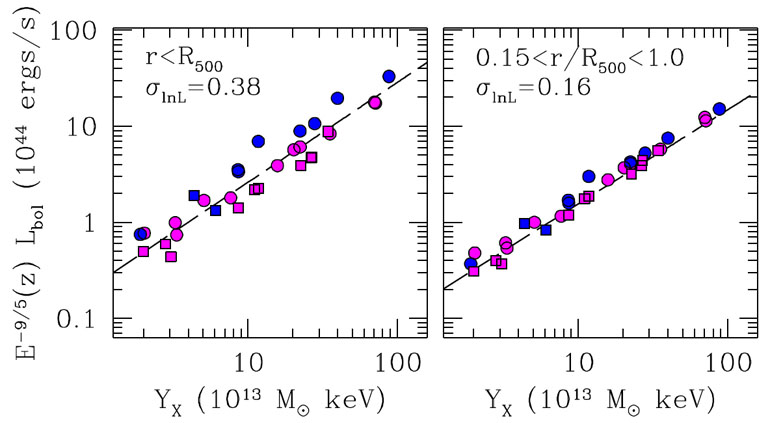 |
Figure 5. Correlation of bolometric
luminosity of intracluster gas and
YX |
 CDM cosmology with
 m = 1 -
 Mgas
TX, where Mgas is the mass of
the gas within R500 and TX is
temperature derived from the
fit to gas spectrum accounting only for emission from radial range
(0.15 - 1)R500. Results are shown for the local
clusters from the Representative XMM-Newton Cluster Structure Survey
sample of
Mgas
TX, where Mgas is the mass of
the gas within R500 and TX is
temperature derived from the
fit to gas spectrum accounting only for emission from radial range
(0.15 - 1)R500. Results are shown for the local
clusters from the Representative XMM-Newton Cluster Structure Survey
sample of