


Rather than studying individual galaxies one can also study them by
investigating the evolution of so-called scaling relations. Nearby
galaxies happen to display clear correlations between well-defined and
easily measurable galaxy properties. With high redshift studies now
routine, scaling relations are more useful than ever, allowing us to
probe the evolution of galaxy populations over a large range of lookback
times (e.g.
Bell et al. 2004,
Saglia et al. 2010).
In this review I will discuss the color - (and line strength -)
 relation, a
potentially tight relation connecting the galaxy mass to its stellar
populations, and the fundamental plane of galaxies, a relation
connecting the structure of galaxies to their mass.
relation, a
potentially tight relation connecting the galaxy mass to its stellar
populations, and the fundamental plane of galaxies, a relation
connecting the structure of galaxies to their mass.
It has been known now for more than 50 years that early-type galaxies
show a tight color-magnitude (C-M) relation
(Baum 1959,
Sandage 1972;
Visvanathan &
Sandage 1977),
in the sense that larger galaxies are redder.
Bower et al. (1992)
showed that in the Virgo and Coma clusters,
when taking small central apertures, the scatter in U-V,
and V-K is extremely small. Noting that when galaxies age,
their color becomes redder, and their velocity dispersion only changes
slightly, they could show that cluster ellipticals are made of very old
stars, with the bulk of them having formed at z > 2. so, by assuming
that for a given the
eldest galaxies are situated at the reddest color, and that along the
color - relation the
metallicity (and possibly also the maximum age for galaxies of a certain
)
changes, one can derive relative ages and metallicities using color -
relations. It has been
used as an important benchmark for
theories of galaxy formation and evolution (e.g.
Bell et al. 2004;
Bernardi et al. 2005)
Galaxies devoid of star formation are thought to populate the red
sequence, while star-forming galaxies lie in the blue cloud (e.g.
Baldry et al. 2004).
The dichotomy in the distribution of
galaxies in this relation has opened a very productive avenue of
research to unravel the epoch of galaxy assembly (e.g.
De Lucia et al. 2004;
Andreon 2006;
Arnouts et al. 2007).
This stellar population - mass relation for galaxies has manifested
itself in the literature in many flavors. Various colors have been used,
from blue colors that are very age-sensitive to red colors covering a
large wavelength baseline (e.g. V-K). To avoid the effects of dust
extinction, one often uses line strengths instead of colors. The
Mg2 -
relation has been used very frequently in the literature (e.g.
Terlevich et al. 1981).
SDSS related studies have been
concentrating on the H line and the D4000 break
(Kauffmann et al. 2003),
finding that galaxies less massive that
3 × 10¹⁰
M
line and the D4000 break
(Kauffmann et al. 2003),
finding that galaxies less massive that
3 × 10¹⁰
M are
predominantly younger than more massive galaxies.
Cenarro et al. (2003)
find an inverse relation of the Ca II IR triplet strength as a function of
, which up to recently
is not well
understood, and might have something to do with IMF-changes in galaxies
(see Section 1.4.6). The galaxy mass
indicator (i.e., here )
can be replaced by other indicators such
as galaxy luminosity, stellar mass, etc. When using stellar mass, the
relations are not so tight (e.g.
Peletier et al. 2012),
since compact ellipticals
fall off the relation for the other galaxies. Compact ellipticals have
higher and also redder
colors/line indices than one would expect
from their stellar mass. What helps in any case is taking into account
both random () and
regular motion (rotation)
(Zaritsky et al. 2006).
This way both ellipticals and spiral galaxies can be compared
easily with each other
(Falcón-Barroso et
al. 2011).
An advantage is that the color -
relation is independent of galaxy
distance. When using mass, or luminosity, the errors involved in
measuring these distances will generally dominate the scatter, unless
these errors can be avoided, in e.g. a galaxy cluster.
are
predominantly younger than more massive galaxies.
Cenarro et al. (2003)
find an inverse relation of the Ca II IR triplet strength as a function of
, which up to recently
is not well
understood, and might have something to do with IMF-changes in galaxies
(see Section 1.4.6). The galaxy mass
indicator (i.e., here )
can be replaced by other indicators such
as galaxy luminosity, stellar mass, etc. When using stellar mass, the
relations are not so tight (e.g.
Peletier et al. 2012),
since compact ellipticals
fall off the relation for the other galaxies. Compact ellipticals have
higher and also redder
colors/line indices than one would expect
from their stellar mass. What helps in any case is taking into account
both random () and
regular motion (rotation)
(Zaritsky et al. 2006).
This way both ellipticals and spiral galaxies can be compared
easily with each other
(Falcón-Barroso et
al. 2011).
An advantage is that the color -
relation is independent of galaxy
distance. When using mass, or luminosity, the errors involved in
measuring these distances will generally dominate the scatter, unless
these errors can be avoided, in e.g. a galaxy cluster.
In Fig. 1.23 I show two color - magnitude relations in the Coma cluster. On the right is shown the result of Bower et al. (1999), showing spectroscopically confirmed cluster members. One sees that ellipticals and S0s form a tight color - magnitude relation. Spiral galaxies are bluer for a given magnitude, indicating younger ages. At fainter magnitudes more and more galaxies are falling blue-ward of the relation, showing that star formation in smaller galaxies is more common. On the left, a diagram is shown from the Coma-ACS survey (Hammer et al. 2010) a survey at a much higher resolution of a small part of the Coma cluster. Many dwarfs are included. At faint magnitudes, many galaxy are shown to be redder or bluer than the linear relation. These are mostly background galaxies, shown by the fact that the larger symbols, the spectroscopically confirmed Coma cluster members, almost all lie on or below the relation. A few compact ellipticals in Coma lie above the relation.
 |
 |
Figure 1.23. The color - magnitude relation in the Coma cluster. Top: F475W - F814W vs. F814W relation from the Coma-ACS survey (Hammmer et al. 2010). These apparent magnitudes can be converted to absolute magnitudes using m-M = 35. Bottom: U-V vs. MV relation from Bower et al. (1999). |
Also for spiral galaxies, the color -
relation can be used very
well to study stellar populations.
Falcón-Barroso et
al. (2002)
showed that bulges with old stellar populations fall on the tight
Mg b - relation
for elliptical galaxies and S0's. This
means that the stellar populations in the bulge of a galaxy is not
determined by the mass of the whole galaxy, but by the mass (or
)
of the bulge (similar to the black hole mass -
Ferrarese & Merritt
2000).
So, by plotting an index, such as Mg b against central
, one can use the
relation in the same way as for ellipticals. In
Fig. 1.24 this is done for the spirals of the
SAURON survey
(Peletier et al. 2007,
Ganda et al. 2007).
Plotted are
central line strengths. The figure shows that the central stellar
populations in late-type spirals are all younger than the ones in
early-type galaxies. Sa's show a large scatter, and have
luminosity-weighted stellar populations that range from very young to as
old as ellipticals. The diagram on the right, which uses
H (in
magnitudes) is maybe a better diagram to use, since here the dependence
of the index on is much
lower, which means that one can read off ages much more easily. The
H -
diagram has not been used
very often in the literature, since only recently one is able to clean
the absorption from the
H emission.
The H -
diagram
shows the same results as Mg b -
: much more scatter in the
stellar populations in Sa's (and some small E's and S0's) than in later
type galaxies, which, on the other hand, are younger than ellipticals.
(in
magnitudes) is maybe a better diagram to use, since here the dependence
of the index on is much
lower, which means that one can read off ages much more easily. The
H -
diagram has not been used
very often in the literature, since only recently one is able to clean
the absorption from the
H emission.
The H -
diagram
shows the same results as Mg b -
: much more scatter in the
stellar populations in Sa's (and some small E's and S0's) than in later
type galaxies, which, on the other hand, are younger than ellipticals.
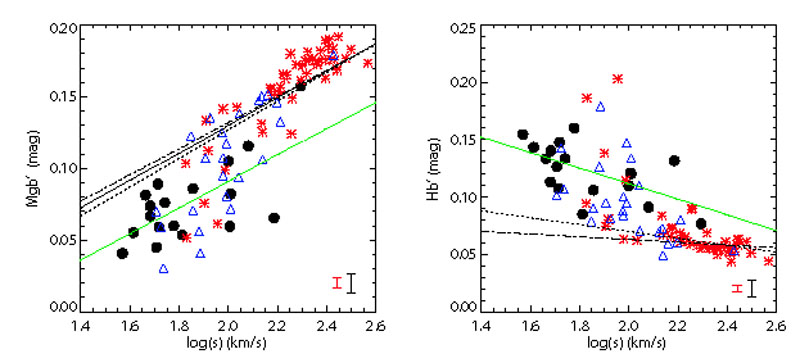 |
Figure 1.24. Mg b -
|
1.5.2. Stellar Population Analysis from Spitzer Colors
In recent years the Spitzer Space Telescope has made many observations in 4 bands. The shortest wavelength bands, [3.6] and [4.5], in nearby galaxies are mainly dominated by stellar light, while the [8.0] bands mainly detects warm dust from particles like PAHs (Fazio et al. 2004). Since the light at 3.6 and 4.5 µm is barely affected by extinction, and also not by young, hot stars, the [3.6] - [4.5] color seems to be useful to study the cold stars in early-type galaxies. The color will be affected by AGN and TP-AGB stars, and will also be dependent on metallicity. In Fig. 1.25 predictions are shown for the [3.6] - [4.5] color from Marigo et al. (2008) and Charlot & Bruzual (Version of 2007, unpublished) for SSPs of various ages and metallicity. Note that in both sets of models stellar populations of ~ 1 Gyr make this color particularly red ([3.6] - [4.5] goes to larger values). The models do not agree with each other in predicting the dependence of [3.6] - [4.5] as a function of metallicity for old ages: in the Marigo (2008) models [3.6] - [4.5] becomes bluer with increasing metallicity, while in Charlot & Bruzual the colors becomes redder.
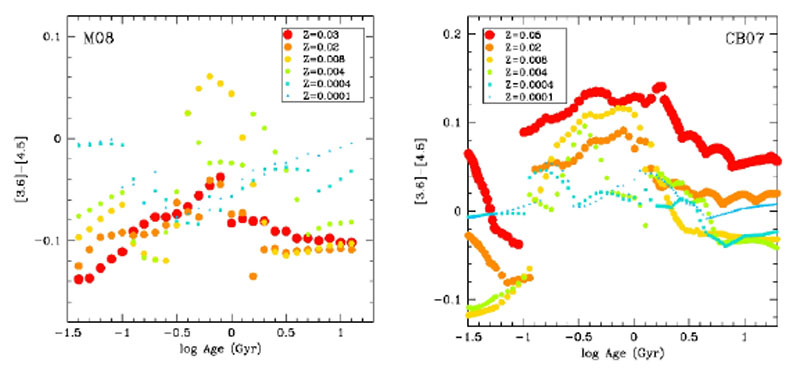 |
Figure 1.25. SSP Models for [3.6] - [4.5] by Marigo et al. (2008, left) and Charlot & Bruzual (Version of 2007, unpublished) as a function of age and metallicity. |
In
Peletier et al. (2012)
we describe a study of the [3.6] - [4.5] color
in the 48 early-type galaxies of the SAURON sample. It is shown that the
images in the 2 bands look like smooth, elliptical galaxies in the
optical, without dust lanes etc. For every object colors were determined
in circular apertures of re and
re / 8. Also radial color profiles were determined by
1. Convolving the 3.6 µm image with the 4.5
µm PSF and vice-versa, to remove any PSF-effects near the
center; 2. Fitting the same ellipses, with fixed center,
ellipticity and position angle in both bands; 3. Performing
accurate sky subtraction; and 4. Making the ratio of both
profiles. One color profile is shown in
Fig. 1.26, where we show the (optical) SAURON
continuum image, the
H
absorption map, and the [3.6] - [4.5] color profile. The high values in the
H map show
the stellar populations
in the dust lane, which are younger than in the main galaxy. The [3.6] -
[4.5] profile shows that these young stellar populations make the color
redder. On top of that, the general gradient is making the galaxy slowly
redder when going outwards. Given the fact that most galaxies become
less metal rich going outward, this might mean that [3.6] - [4.5]
becomes redder for decreasing metallicity, or bluer for increasing
metallicity. We can understand this when we know that the 4.5
µm band contains a large CO absorption band. When the
metallicity increases, this band gets stronger, making [3.6] - [4.5]
bluer (see
Peletier et al. 2012).
 |
Figure 1.26. SAURON images in V-band
continuum (a)) and H |
Most galaxies have colors everywhere between -0.15 and 0. An exception
is M87, the central Virgo galaxy, which has a very red center, due
to the synchrotron emission in center and jet. No other galaxies contain
such prominent central point sources. When plotting the relation of
[3.6] - [4.5] and
(Fig. 1.27) we see
that both quantities are strongly related. In this diagram we have
colored the galaxies with their age inside re / 8, as
obtained by
Kuntschner et
al. (2010)
from the SAURON line indices. Had we used ages within re, the
figure would have been similar, but with a smaller range in colors. This is
because in these early-type galaxies many more young features
are seen in the inner parts than further out.
The color - relation
shows that more massive galaxies
are bluer. The color coding of the figure shows that these galaxies are at
the same time older, if one considers the luminosity-weighted
SSP-ages. The main difference with other colors is that the [3.6] - [4.5]
color becomes bluer for increasing galaxy mass/luminosity.
 |
Figure 1.27. [3.6] - [4.5] color as a function of velocity dispersion in km/s. The velocity dispersion has been measured within re. Here the color, determined within 1 effective radius, is shown. |
So, what is the origin of this color -
relation? Here one has to
use mainly empirical arguments, since the models still are rather
uncertain. One could think that metallicity is the main driver, with
galaxies becoming less metal rich for decreasing
, and as a
result redder. On the other hand, one does not know what the metallicity
dependence of [3.6] - [4.5] is. One could also think that age is the
dominant driver. In this case the fraction of AGB stars has to increase
with decreasing . Since
these stars are red, the galaxy colors
then become redder. If this proves to be true, this would be a promising
way to determine the contribution from AGB stars in galaxies. If the
scatter in the color -
relation can be explained by young
stellar populations on top of a much older underlying stellar
population, one would expect the outliers of the optical line strength -
relations of
Kuntschner et
al. (2006)
to be the same as the outliers of the color -
relation here. A close
look teaches us
that this is to first order the case. Also, there is a strong
correlation between Mg b and [3.6] - [4.5]. If the color -
relation is driven by age, it would mean that the young populations that
are responsible for the bluing of [3.6] - [4.5] are also responsible
both for the decreasing Mg b and increasing
H
index. Although
it is hard to quantify what kind of SSP would be needed, the strong
correlation between Mg b, which is sensitive for stellar
populations from 106-7 y, and [3.6] - [4.5], which is mostly
sensitive to stars above 3 × 10⁸ y, would indicate that
stellar populations in these galaxies would have ages older than
3 × 10⁸ y. This is not very realistic, since the galaxies
that are blue in the [3.6] - [4.5] -
relation always show
H
emission lines in the region of the young stars,
indicating recent star formation. The alternative would be that
AGB-populations are much less important than people think. That would
agree with recent results from
Zibetti et al. (2012),
who, from near-infrared spectroscopy of post-starburst galaxies, find a
much lower contribution from AGB stars than is expected from the TP-AGB
heavy models of
Maraston (2005).
More research clearly is needed to understand the contribution of this
evolved stellar population in galaxies.
1.5.3. The fundamental plane of galaxies
Since its discovery
(Djorgovski & Davis
1987;
Dressler et al. 1987),
the Fundamental Plane (FP) has been one of the most studied relations in the
literature. Given its tightness, like many other scaling relations the
FP was quickly envisaged as a distance estimator as well as a
correlation to understand how galaxies form and evolve (e.g.
Bender, Burstein &
Faber 1992
(BBF),
Jørgensen et al. 1996;
Pahre et al. 1998;
Bernardi et al. 2003).
It is widely recognized
that the FP is a manifestation of the virial theorem for self-gravitating
systems averaged over space and time with physical quantities total mass,
velocity dispersion, and gravitational radius replaced by the
observables mean effective surface brightness µe,
effective (half-light) radius (re), and
stellar velocity dispersion
. Since velocity
dispersion and surface
brightness are distance-independent quantities, contrary to effective
radius, it is common to express the FP as log(re) =
 log() +
µe +
log() +
µe +
 , to
separate distance-errors from others. If galaxies were homologous with
constant total mass-to-light ratios, the FP would be equivalent
to the virial plane and be infinitely thin, with slopes
= 2 and
= 0.4. By
studying the intrinsic scatter around the FP, one can study
how galaxy properties differ within the observed sample.
, to
separate distance-errors from others. If galaxies were homologous with
constant total mass-to-light ratios, the FP would be equivalent
to the virial plane and be infinitely thin, with slopes
= 2 and
= 0.4. By
studying the intrinsic scatter around the FP, one can study
how galaxy properties differ within the observed sample.
Just like the color -
relation, the FP is a very useful tool to study the evolution of stellar
populations. To first order approximation, radius and
are independent of stellar
populations, while µe is. If a stellar population
ages, its luminosity decreases, and therefore also its surface
brightness. However, if one studies the evolution with redshift, one
also has to take into account the fact that galaxies become more compact
with redshift (radius evolution), and consequently their velocity
dispersion increases as well.
An important study to mention here is the EDisCS study of the FP of
galaxies in clusters up to z = 0.9
(Saglia et al. 2010).
Combining
structural parameters from HST and VLT images and velocity dispersions
from VLT spectra, they have been able to determine Fundamental Plane
fits for clusters with a range in redshift, as well as for galaxies in
the field. At face-value, on average, the evolution of the surface
brightness follows the predictions of simple stellar population models
with high formation redshift (~ z = 2) for all clusters,
independent of their total mass (see Fig. 1.28).
However, it looks as if both the evolution of
early-type galaxies with redshift and the dependence of this evolution
on environment differ for galaxies of different mass. These differences
manifest themselves as an evolution in the FP coefficient
as a function of
redshift. They also find size and velocity dispersion evolution of the
sample. However, after taking into account the progenitor bias affecting
the sample (large galaxies that joined the local early-type class only
recently will progressively disappear in higher redshift samples), the
effective size and velocity dispersion evolution reduce
substantially. So after making corrections for radius and velocity
dispersion evolution, they found, using SSP models, that massive (M >
1011
M) cluster
galaxies are old, with formation redshifts z
> 1.5. In contrast, lower mass galaxies are just 2 to 3 Gyr old. This
agrees with the EDisCS results from colors and line strength (e.g.
Poggianti et al. 2006)
who argue that the lower luminosity, lower
mass population of early-type galaxies comes in place only at later
stages in clusters. Field galaxies follow the same trend, but are ~ 1
Gyr younger at a given redshift and mass. This picture in principle is
in agreement with the picture one gets from stellar population analysis
of nearby galaxies
(Thomas et al. 2005).
 |
Figure 1.28. Redshift evolution of the
B band mass-to-light ratio (from
Saglia et al. 2010).
The full black lines show the simple stellar population (SSP)
predictions for a Salpeter IMF and formation redshift of either
zf = 2(lower) or 2.5 (upper curve) and solar metallicity from
Maraston (2005).
The blue line shows the SSP for zf = 1.5 and twice-solar
metallicity, the magenta line the SSP for zf = 2.5 and
half-solar metallicity. The dotted line shows the best-fit linear
relation and the |
In the local Universe, the high S/N of the observations make it possible to look at the FP in more detail. Here we can study the position of bulges on the FP (e.g. Bender et al. 1992, Falcón-Barroso et al. 2002), the scatter in the stellar population ages of galaxies, the amount of dark matter in various types of galaxies along the FP, etc. Falcón-Barroso et al. (2011) (Fig. 1.29) studied the FP for the SAURON sample of 48 E/S0 galaxies and 24 Sa's. To avoid the effects of internal extinction in galaxies, they use the Spitzer 3.6 µm band. The velocity dispersion they use is the dispersion calculated using the integrated spectrum inside 1 effective radius. If measured in this way, it includes both rotation and random motions (Zaritsky et al. 2006), and both ellipticals and spirals can be put on the same diagram. Falcón-Barroso et al. find that the SAURON slow rotators (SR, Emsellem et al. 2007) define a very tight FP, tighter than the fast rotators. This confirms the study from colors and line indices that SR are uniformly old systems, although it also shows that slow rotators have the same homology (radius - surface brightness - mass relations). In the V-band the spiral galaxies deviate because of younger stellar populations, but also because of extinction, two effects which work in opposite directions.
 |
Figure 1.29. Edge-on views of the Fundamental Plane relation for the galaxies in the SAURON sample of galaxies in V - and 3.6µm-bands. Circles denote E/S0 galaxies, diamonds Sa galaxies. Filled symbols indicate galaxies with good distance estimates, open symbols those with only recession velocity determinations. In blue we highlight Fast Rotators, in red Slow Rotators and in green the Sa galaxies. The special case of NGC 4550, with two similarly-massive counter-rotating disc-like components, is marked in yellow. The solid line is the best fit relation (as indicated in the equation in each panel) (from Falcón-Barroso et al. 2011). |
If one goes down in mass towards dwarf galaxies, one traditionally finds
that dwarf ellipticals lie above the fundamental plane (BBF,
de Rijcke et al. 2005).
Converting the FP-parameters into new parameters
 1,
2 and
3 using a
coordinate transformation (from BBF), one can directly see how the mass
(
1,
2 and
3 using a
coordinate transformation (from BBF), one can directly see how the mass
( 1) and M/L
(
3)
evolve. If one does this, one finds that dwarf ellipticals have higher
M/L ratios than ellipticals and S0's on the fundamental plane. This
result has been revised recently using
Toloba et al. (2012),
who obtained high quality data for a larger sample of dwarfs (some supported
by rotation and some by random motions). From their long-slit data they
simulated the integrated spectrum inside an effective radius, to
determine the generalized dispersion
(Zaritsky et al. 2006)
also for the dwarfs. They show that also the new data for dwarf galaxies
fall above the fundamental plane. Correcting for the effects of stellar
populations using line indices from
Michielsen et
al. (2008)
in the way described by
Graves & Faber
(2010)
they find that the objects remain
above the FP, and have dynamical to stellar mass ratios around 1.5 (see
Fig. 1.30). If one, however, goes down to even
lower mass dwarfs, these ratios rise to much higher values
(Wolf et al. 2010).
1) and M/L
(
3)
evolve. If one does this, one finds that dwarf ellipticals have higher
M/L ratios than ellipticals and S0's on the fundamental plane. This
result has been revised recently using
Toloba et al. (2012),
who obtained high quality data for a larger sample of dwarfs (some supported
by rotation and some by random motions). From their long-slit data they
simulated the integrated spectrum inside an effective radius, to
determine the generalized dispersion
(Zaritsky et al. 2006)
also for the dwarfs. They show that also the new data for dwarf galaxies
fall above the fundamental plane. Correcting for the effects of stellar
populations using line indices from
Michielsen et
al. (2008)
in the way described by
Graves & Faber
(2010)
they find that the objects remain
above the FP, and have dynamical to stellar mass ratios around 1.5 (see
Fig. 1.30). If one, however, goes down to even
lower mass dwarfs, these ratios rise to much higher values
(Wolf et al. 2010).
 |
Figure 1.30. The position of dwarf ellipticals on FP (from Toloba et al. 2012). The early-type galaxies and Sa's are from Falcón-Barroso et al. 2011. Shown in red are rotationally supported dwarfs, and in blue pressure supported ones. Note that the dwarfs lie predominantly above the large galaxies, showing intrinsically higher dark matter fractions. |