


Metallicity gradients provide a means of studying galaxy formation. Classical monolithic collapse scenarios (Larson 1974; Carlberg 1984) predict strong metallicity gradients. In this scenario primordial clouds of gas sink to the center of an over density where a rapid burst of star formation occurs. In-falling gas mixes with enriched material freed from stars by stellar evolutionary processes and forms a more metal rich population. Because the gas clearing time (and hence the number of generations which enrich the interstellar medium) is dependent on the depth of the potential well, the metallicity gradient is dependent on the mass of the galaxy. Mergers, dominant in hierarchical galaxy formation scenarios, will dilute existing population gradients (e.g. White 1980; di Matteo et al. 2009), although residual central star formation can steepen gradients again (e.g. Hopkins et al. 2009, among others). Therefore, the study of metallicity gradients can be used to distinguish between competing scenarios of galaxy formation and can eventually lead to a more detailed understanding of those scenarios. Many attempts have been made to model metallicity gradients in more detail (e.g., Kawata & Gibson 2003, Kobayashi 2004; Pipino et al. 2010). They are generally able to reproduce the gradients, but the predictive power of the models at present is low.
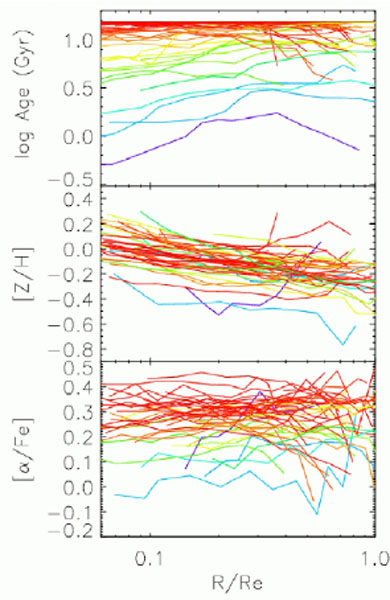 |
Figure 1.31. Overview of radial profiles,
averaged along isophotes, of luminosity weighted age, metallicity and
[ |
Here I would like to discuss some new work on the gradient vs. mass
relation, which might lead to a better understanding of this relation,
and therefore galaxy formation. Using the 3 (sometimes 4) SAURON line
strength indices
Kuntschner et
al. (2010)
have derived metallicity- and
age gradients in their 48 early-type galaxies. Note that they did this
assuming that at every position the stellar populations were represented
by an SSP. The resulting profiles are shown in
Fig. 1.31. The color of the galaxies
corresponds to the
central age. One sees that galaxies become more metal poor going outward
slowly, with little difference between the gradients of the individual
galaxies. This picture is consistent with the literature (e.g.
Davies et al. 1993,
Carollo & Danziger
1993).
At the same time
[ /Fe] does not change very
much as a function of radius in the galaxy. The most striking of this
figure are the age profiles. There are many galaxies which are old
everywhere. These generally are the Slow Rotators (see
Section 1.5.3), which is probably the
reason their scatter in
the FP is so small. Many other galaxies are younger in the central
regions. These regions correspond to central disks, which are very
common not only in early-type galaxies, but also in spirals. Note that
although many central disks are younger, there are also central disks
which are just as old as the rest of the galaxy. This figure is very
instructive. It tells us that if we want to investigate the metallicity
gradient in galaxies, there is no point in considering these inner
regions, since here almost certainly the SSP-approximation is
unjustified, so that the luminosity-weighted metallicity is probably
very uncertain. To verify this, in Fig. 1.32 we
plot the metallicity gradients of
Kuntschner et
al. (2010)
against the Spitzer [3.6] - [4.5] color gradients (see
Section 1.5.2). We see a good
correlation for the old galaxies, but for galaxies with young central
ages, the correlation breaks down. Although we have tried in
Peletier et al. (2012)
not to use the inner, younger, region to fit the gradients, this approach is
difficult, and tricky (see Fig. 1.31. On the
other hand, the good correlation in Fig. 1.32
shows that the [3.6] - [4.5] color probably has a strong metallicity
dependence.
/Fe] does not change very
much as a function of radius in the galaxy. The most striking of this
figure are the age profiles. There are many galaxies which are old
everywhere. These generally are the Slow Rotators (see
Section 1.5.3), which is probably the
reason their scatter in
the FP is so small. Many other galaxies are younger in the central
regions. These regions correspond to central disks, which are very
common not only in early-type galaxies, but also in spirals. Note that
although many central disks are younger, there are also central disks
which are just as old as the rest of the galaxy. This figure is very
instructive. It tells us that if we want to investigate the metallicity
gradient in galaxies, there is no point in considering these inner
regions, since here almost certainly the SSP-approximation is
unjustified, so that the luminosity-weighted metallicity is probably
very uncertain. To verify this, in Fig. 1.32 we
plot the metallicity gradients of
Kuntschner et
al. (2010)
against the Spitzer [3.6] - [4.5] color gradients (see
Section 1.5.2). We see a good
correlation for the old galaxies, but for galaxies with young central
ages, the correlation breaks down. Although we have tried in
Peletier et al. (2012)
not to use the inner, younger, region to fit the gradients, this approach is
difficult, and tricky (see Fig. 1.31. On the
other hand, the good correlation in Fig. 1.32
shows that the [3.6] - [4.5] color probably has a strong metallicity
dependence.
 |
 |
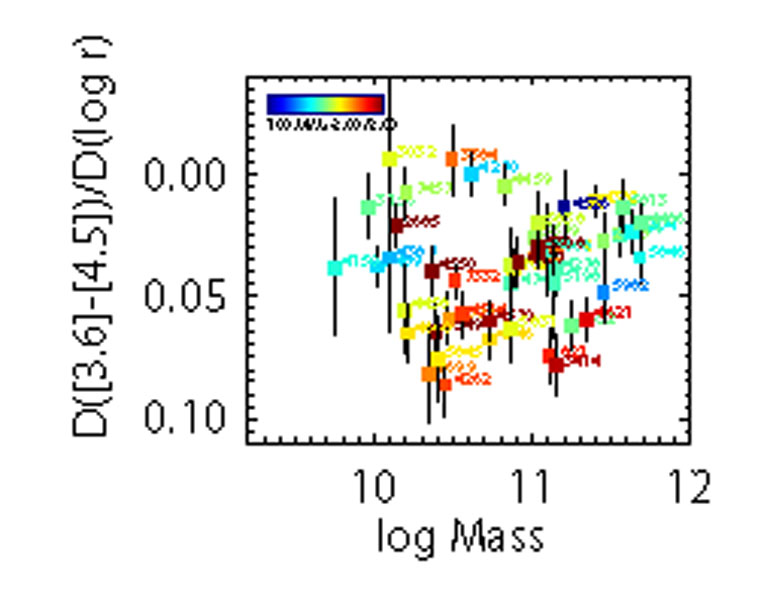
Figure 1.32. Top: SAURON metallicity gradients (from Kuntschner et al. 2010) as a function of the [3.6] - [4.5] gradient (from Peletier et al. 2012). The coloring of the points is done according to the central age. Bottom: [3.6] - [4.5] gradient as a function of mass. |
Plotting now these gradients against mass in Fig. 1.32 (right) we see no relation between the two quantities, except that the gradients for the old galaxies are mostly between 0.05 and 0.10.
Realizing this problem with the SSP-based interpretation, we now turn to
dwarf ellipticals.
Spolaor et al. (2009)
showed a very strong
correlation between gradient and mass in the mass range between
3 × 10⁹ and 3 × 10¹⁰
M , albeit with
very few galaxies. Gradients become weaker when going to smaller
galaxies, even becoming positive, indicating positive metallicity
gradients. This would have strong implications on e.g. the effects of
galactic SN-driven winds. In
den Brok et al. (2011)
we have investigated this effect in
detail. We have determined color gradients for a sample of dwarf
galaxies in the Coma cluster using the Coma-ACS survey. In this rich
cluster environment the number of young stars in galaxies is minimized,
which means that it is easier to study metallicity gradients. It turns
out that the central regions here are strongly influenced by small
central, younger regions, so-called nuclear clusters. Since many dwarf
ellipticals have nuclear clusters, this effect is very important. In
Fig. 1.33 I show that the gradient - mass
relation before and after removing the nuclear clusters. In the second
case, we indeed find a relation of gradients with mass. Going to smaller
galaxies, the gradients (per dex in radius) become smaller, but remain
negative, in agreement with galaxy formation models. For large galaxies
one sees a large scatter in the gradients. Only compact ellipticals do
not obey the gradient - mass relation. They behave in many ways as the
central regions of much larger galaxies.
, albeit with
very few galaxies. Gradients become weaker when going to smaller
galaxies, even becoming positive, indicating positive metallicity
gradients. This would have strong implications on e.g. the effects of
galactic SN-driven winds. In
den Brok et al. (2011)
we have investigated this effect in
detail. We have determined color gradients for a sample of dwarf
galaxies in the Coma cluster using the Coma-ACS survey. In this rich
cluster environment the number of young stars in galaxies is minimized,
which means that it is easier to study metallicity gradients. It turns
out that the central regions here are strongly influenced by small
central, younger regions, so-called nuclear clusters. Since many dwarf
ellipticals have nuclear clusters, this effect is very important. In
Fig. 1.33 I show that the gradient - mass
relation before and after removing the nuclear clusters. In the second
case, we indeed find a relation of gradients with mass. Going to smaller
galaxies, the gradients (per dex in radius) become smaller, but remain
negative, in agreement with galaxy formation models. For large galaxies
one sees a large scatter in the gradients. Only compact ellipticals do
not obey the gradient - mass relation. They behave in many ways as the
central regions of much larger galaxies.
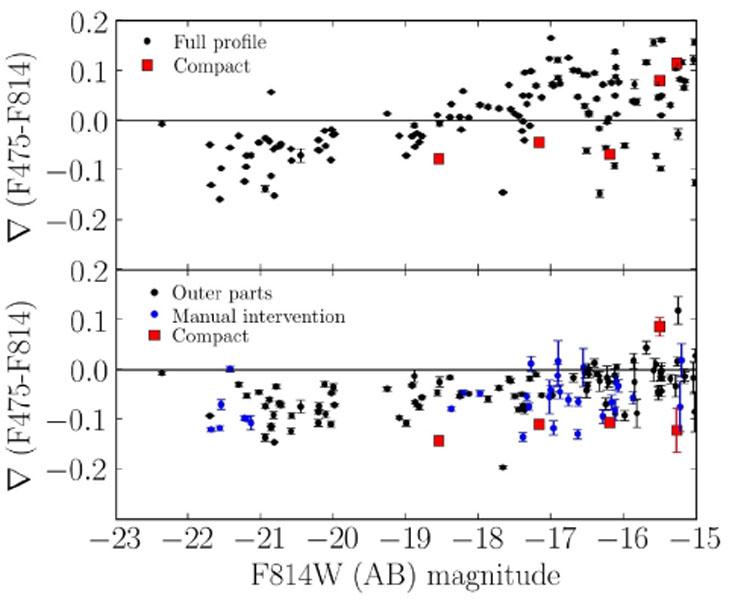 |
Figure 1.33. Top: Color gradients of likely Coma members as a function of absolute magnitude. Bottom: Color gradients of the same galaxies, now excluding the central parts from the fit. Red squares are compact galaxies from Price et al. (2009). The blue points required manual intervention. (From den Brok et al. 2011). |
Given the poor reproduction of gradients by simulations, we can only speculate what these results mean in terms of galaxy formation models. The observed trends with galaxy mass imply that somehow the mass of the galaxy, or the potential well are important in shaping the gradient (see also the Mg b - vesc relation (Scott et al. 2009). However, given the scatter in gradients at a given magnitude, this cannot be the only important process. Another clue comes from the Sérsic index - gradient relation. Galaxies with nearly exponential profiles have flatter gradients than galaxies with higher Sérsic indices (den Brok et al. 2011). Higher Sérsic indices are thought to be the results of processes involving violent relaxation. Since this is a non-dissipational process by itself, the strong gradients may point at a history of moist or wet mergers.