3.1. Optical, far-infrared and sub-mm polarization
The earliest optical polarization observations in 1949 were interpreted to be due to dust alignment in magnetic fields and hence a tracer of magnetic fields in galaxies. It took some time to convince the optical community that the polarization was due to dust grains aligned in magnetic fields. The radio polarization observations (section 3.2) confirmed the magnetic explanation. A large catalogue of the polarization of stars was made by Behr (1961). This work continued in the southern skies, as well as other observers, culminating in an all-sky catalogue of Mathewson & Ford (1970a) with 1800 entries and Axon & Ellis (1976) with 5070 entries. The general conclusion of this work, that there is a magnetic field aligned along the Galactic plane, still holds today. A very homogeneous region of alignment, with high polarization values, was seen towards the anticenter (Galactic longitude l ≈ 140°). Well aligned magnetic field vectors are also seen along the North Polar Spur that extends in to the northern halo from l ≈ 30°. These early observations were possible for nearby stars, a few at a maximal distance of 4 kpc. A more recent compilation of 9286 stars, collected by Heiles (2000) and discussed by Fosalba et al. (2002) (Fig. 7), included some stars out to ≈ 8 kpc. In view of these distance limitations it is not possible on the basis of optical polarization alone to model the magnetic field of the Milky Way.
 |
Figure 7. Optical starlight polarization in the Galactic plane for two distance intervals (Fosalba et al. 2002) |
Polarization observations of the diffuse far-infrared or sub-mm emission in the Milky Way are restricted to dense molecular/dust clouds. The Chandrasekhar-Fermi method (section 2.1) gives field strengths of a few mG, similar to Zeeman measurements of OH maser lines in other dense clouds (section 3.4). Interferometric observations in the sub-mm range with sub-parsec resolution reveals hourglass morphologies in the envelopes of the dust cores of ultra-compact HII regions (Tang et al. 2009). The supercritical cores seem to collapse in a subcritical envelope supported by strong magnetic fields, suggesting that ambipolar diffusion plays a key role in the evolution of the cloud. The correlation of the field orientation in the intercloud medium on a scale of several 100 pc, derived from optical polarization, with that in the cloud core on a scale of less than 1 pc, derived from sub-mm polarimetry, further indicates that the fields are strong and preserve their orientation during cloud formation (Li et al. 2009).
3.2.1. All-sky surveys in total intensity
The radio continuum emission of the Milky Way and star-forming galaxies at frequencies below 10 GHz mostly originates from the synchrotron process and hence traces the distribution of magnetic fields and cosmic rays. The contribution of thermal radio emission is generally small, except in bright star-forming regions. Only at frequencies higher than 10 GHz the thermal emission may dominate locally. At frequencies below about 300 MHz absorption of synchrotron emission by thermal gas can become strong. Hence the observation of total radio continuum intensity in the frequency range of about 300 MHz - 10 GHz is a perfect method to investigate magnetic fields. Since the observed intensity is the integral from many emission areas along the line of sight, its interpretation is not always simple. Furthermore, the angular resolution of all-sky surveys (Fig. 10) is limited and hence cannot show the details of extended sources.
 |
Figure 8. The early sky map at 160 MHz of Reber (1944) (black-white) and a recent map at 1.4 GHz (color) (courtesy Wolfgang Reich). |
Numerous radio continuum surveys were made in the early days of radio astronomy (Appendix, Table 2). The early all-sky surveys showed the Galactic emission with a maximum towards the Galactic center, the band of emission along the Galactic plane, maxima in the tangential directions of the local spiral arm: Cygnus (l ≈ 80°) in the northern and Vela (l ≈ 265°) in the southern skies and some "spurs" of emission. In addition a few strong extragalactic sources were seen superposed on the Galactic emission.
The analysis of total synchrotron emission gives an equipartition strength of the total field of 6 ± 2 µG in the local neighborhood and 10 ± 3 µG at 3 kpc radius (Berkhuijsen, in Beck 2001). The radial exponential scale length of the total field is about 12 kpc. These values are similar to those in external galaxies (section 4.2).
The angular resolution has improved so that at present all-sky surveys with resolution of under 1° are available. At 1.4 GHz the surveys delineated many extended Galactic sources (HII regions, SNRs) seen along the Galactic plane. Some extragalactic sources like Centaurus A, Virgo A, Cygnus A and the Magellanic Clouds are also clearly seen in the all-sky survey. Surveys at 45 MHz covered most of the sky with medium angular resolution. At these low frequencies, absorption of the synchrotron emission by ionized gas takes place near the Galactic plane.
The WMAP satellite surveys at frequencies from 23 GHz to 94 GHz (Bennett et al. 2003; Hinshaw et al. 2009) gave us a new view of the radio continuum sky at high radio frequencies. At the highest WMAP frequencies mainly thermal emission originating in interstellar dust is observed. An additional component due to spinning dust has been postulated (Draine & Lazarian 1998), to be seen in the 10-100 GHz frequency range. This spinning dust component has been confirmed (Dobler et al. 2009) in the WMAP data set.
There is a large gap between the lower frequency all-sky surveys and the high-frequency data. A 5 GHz all-sky survey with compatible angular resolution but also good sensitivity is badly needed. Table 2 in the Appendix lists the all-sky surveys with the best angular resolution at a given frequency.
3.2.2. All-sky surveys in linear polarization
Linear polarization of the continuum emission is a more direct indicator of magnetic fields, because there is no confusing thermal component. However, linear polarization is subject to Faraday effects (section 3.3). After the first detections of polarized Galactic radio waves in 1962 (Fig. 9) several all-sky polarization surveys were made (Appendix, Table 3). The early polarization surveys did not have sufficient angular resolution to elucidate many details. These surveys were made at the low radio frequency of 408 MHz where Faraday effects are considerable. A multi-frequency collection of polarization data for the northern sky was published by Brouw & Spoelstra (1976), albeit not fully sampled.
 |
Figure 9. First detection of polarized synchrotron emission (E-vectors) in the Milky Way at 408 MHz (Wielebinski et al. 1962). |
Major progress was achieved by Wolleben et al. (2006) and Testori et al. (2008) who mapped the whole sky in linear polarization at 1.4 GHz with an angular resolution of 36 arcminutes (Fig. 10). Several polarization maxima are seen, e.g. towards the "Fan region" at l ≈ 140°, b ≈ 10°, where the line of sight is oriented perpendicular to the local spiral arm. The "North Polar Spur" (NPS) emerges from the Galactic plane at l ≈ 30° as well as additional spur-like features are the results of magnetic fields compressed by expanding supernova remnants. In particular, the NPS can be followed, in polarization, to the southern sky. Towards the inner Galaxy (Galactic longitude 90° > l > 270°, Galactic latitude |b| < 30°) strong turbulence in the polarized intensity is seen, due to Faraday effects on small scales (section 2.4). The NRAO VLA sky survey (NVSS) has also recently been analyzed in polarization (Rudnick & Brown 2009). All-sky polarization data at 23 GHz was published by the WMAP team (Kogut et al. 2007; Hinshaw et al. 2009). There is good agreement between the 23 GHz and the 1.4 GHz polarization maps in the polarization features away from the Galactic plane, but the high-frequency map shows less Faraday depolarization towards the inner Galaxy and near the plane. The PLANCK satellite will soon provide new polarization surveys in six frequency bands (30-350 GHz) GHz with high sensitivity and resolution.
 |
Figure 10. All-sky surveys in total intensity (top) and polarized intensity (bottom) at 1.4 GHz (Reich 1982; Wolleben et al. 2006; Testori et al. 2008). |
Another major survey has been started which will cover the whole sky at frequencies between 300 MHz and 1.8 GHz and will allow the measurement the RM of the diffuse emission over the whole sky (Wolleben et al. 2009). A summary of all-sky polarization surveys is given in Reich (2006) and in Table 3 of the Appendix.
Galactic plane surveys have been made from the earliest days of radio astronomy to delineate the extended Galactic sources like supernova remnants and HII regions, usually with no linear polarization data (Appendix, Table 4). Many of the published Galactic plane surveys between 22 MHz and 10 GHz cover only a narrow strip along the Galactic plane in the inner Galaxy. Total intensity surveys at several frequencies were used to separate the thermal HII regions (with a flat radio spectrum) from the steep-spectrum non-thermal sources (supernova remnants). From the total intensity surveys numerous previously unknown supernova remnants could be identified.
Since non-thermal sources are polarized it was obviously necessary to map the Galactic plane also in linear polarization. The first step in the evolution of our knowledge about the polarization of the Galactic plane was the 2.7 GHz survey by Junkes et al. (1987), followed by the surveys of the southern Galactic plane at 2.3 GHz (Duncan et al. 1995) and the northern counterpart at 2.7 GHz (Duncan et al. 1999), which covered a relatively wide strip (|b| < 5°) around the plane. Early high-resolution observations by Wieringa et al. (1993) showed that a lot of small-scale polarization is present in the Galactic emission which is unrelated to any structures in total intensity. The next major development is the Effelsberg Medium Latitude Survey (EMLS) at 1.4 GHz that will ultimately cover ± 20° distance from the Galactic plane (Uyaniker et al. 1999; Reich et al. 2004). A section of the southern Galactic plane has been mapped at 1.4 GHz with arcminute resolution (Gaensler et al. 2001; Haverkorn et al. 2006), complemented on the northern sky by the DRAO survey (Taylor et al. 2003; Landecker et al. 2010) (Fig. 11). A survey of a 5° × 90° strip along the Galactic meridian l = 254° with the Parkes telescope at 2.3 GHz is underway (Carretti et al. 2010).
 |
Figure 11. A section of the Galactic plane at 1.4 GHz (Landecker et al. 2010). |
In all the above mentioned surveys Faraday effects (section 2.4) play an important role. At frequencies of 1.4 GHz and below, Faraday rotation generates small-scale structures in polarization which are not related to physical structures. Even at 5 GHz Faraday rotation plays an important role near the Galactic plane (|b| < 5°). With high enough angular resolution, Faraday rotation leads to complete depolarization at certain values of Faraday rotation measure (RM) (Fig. 2), showing up as "canals" in the maps of polarized intensity (e.g. Haverkorn et al. 2003; 2004; Schnitzeler et al. 2009; Fig. 11). However, a careful determination of the extended polarized background is necessary for a reliable determination of polarized intensity, polarization angles and RM. When this "absolute calibration" is done, most of the "canals" disappear. As a second new phenomenon, "Faraday Screens" were discovered (e.g. Gray et al. 1998; Uyaniker et al. 1999; Wolleben & Reich 2004; Schnitzeler et al. 2009). These are foreground clouds of diffuse thermal gas and magnetic fields which Faraday-rotate or depolarize the extended polarized emission from the background. In addition to the well-known polarized SNRs and unpolarized HII regions, molecular clouds, pulsar-wind nebulae, and planetary nebulae were identified as Faraday Screens. Depending on the rotation angle and the polarization angle of the background emission, such screens may appear bright or dark. The strength and structure of regular fields can be estimated via the RM. Such observations can trace magnetic structures to sub-parsec scales.
The present data set on the intensity distribution and polarization of the Galactic plane (listed in Table 4 of the Appendix) is impressive. Sensitive surveys at higher radio frequencies are needed to allow a systematic study of the Faraday Screen phenomenon. This is being achieved e.g. by a Sino-German survey of the Galactic plane at 5 GHz with the Urumqi telescope (Sun et al. 2007; 2011; Gao et al. 2010; Xiao et al. 2011).
The Galactic Center is unique source with unusual radio continuum features. Mapping of the Galactic Center region by Yusef-Zadeh et al. (1984) showed several features vertical to the plane. The radio continuum emission is most intense and has a flat spectral index (Reich et al. 1988), for many years accounted to thermal emission. However, this intense emission is highly polarized (e.g. Seiradakis et al. 1985) and has been interpreted to be due to mono-energetic electrons (Lesch et al. 1988). Also the polarization "strings" imply vertical magnetic structures, much different from the azimuthal directions of the magnetic fields seen along the Galactic plane. Mapping of the Galactic Center at 32 GHz (Reich 2003) showed that RMs in excess of ±1600 rad m-2 are present in the vertical filaments. The discussion about the intensity of the magnetic fields have yielded very high values (mG range) based on Zeeman splitting observations (e.g. Yusef-Zadeh et al. 1996), while other authors (e.g. Crocker et al. 2010), based on the radio synchrotron spectrum, suggest much lower values in the 50-100 µG range.
Detailed high-resolution studies also brought controversial results. High resolution radio maps of the Galactic Center (e.g. Nord et al. 2004) showed a spiral structure at the position of Sgr A* and thin vertical radio continuum "strings". Polarimetric observations at sub -mm wavelengths suggest a stretched magnetic field (Novak et al. 2000), as expected in sheared clouds, while the large-scale ordered field is mostly toroidal (Novak et al. 2000). Near-IR polarimetry suggests a transition from toroidal to poloidal field configuration in the Galactic Center (Nishiyama et al. 2010).
A recent interpretation of the magnetic field phenomena in the Galactic Center was given by Ferriére (2009). If our Galaxy does not differ much from nearby galaxies, the vertical field detected close to the center is a local phenomenon.
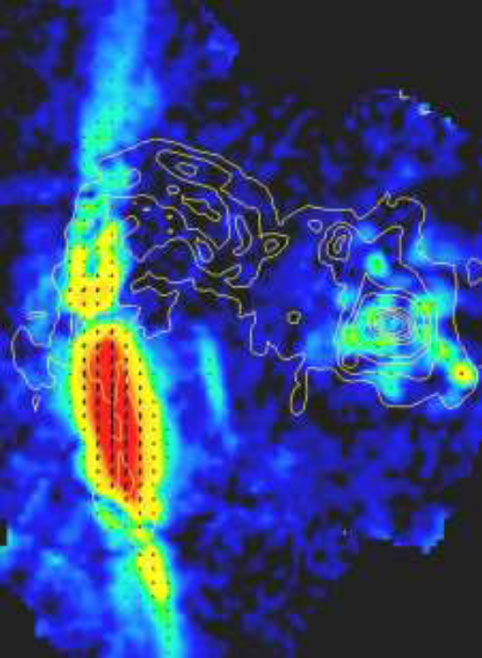 |
Figure 12. Galactic Center region. Total intensity (contours), polarized intensity (colors), and B-vectors at 32 GHz, observed with the Effelsberg telescope. The map size is about 23' × 31' along Galactic longitude and latitude. The Galactic Center is located at the peak of total emission (from Wolfgang Reich, MPIfR). |
3.3. Faraday Rotation of extra-galactic radio sources and pulsars
Faraday rotation (FR) is a powerful tool for studying magnetic fields. First, ionospheric rotation, later Faraday effects due to the Galactic ISM were detected soon after the discovery of linear polarization of the Galactic radio waves. At first the FR of diffuse emission was studied. Later with increasing samples of EGRS modeling of the magnetic field was attempted. Finally pulsars, most of which are concentrated to the Galactic plane were used to model the Galactic magnetic fields.
3.3.1. Extra-galactic radio sources (EGRS)
Faraday rotation measures (RMs) towards EGRS originate in the source itself and in the magneto- ionic media in the foreground (intergalactic space, intervening galaxies, Milky Way, interplanetary space and ionosphere of the Earth). The contributions from intergalactic space, intervening galaxies and interplanetary space are generally small. The contribution from the ionosphere of the Earth is subtracted with help of calibration sources with known polarization angle, leaving RM from the Milky Way and intrinsic RM. Interestingly, the intrinsic RM dispersion of extragalactic sources is smaller than the RM dispersion in the Galactic foreground for sightlines that are separated by at least 1°, so that the contribution by the Galactic foreground becomes very important at low and intermediate Galactic latitudes (Schnitzeler 2010).
Here a word of caution must be given. The intrinsic polarization and RM of any EGRS may originate in the nucleus of a radio galaxy or in the extended lobes. Hence, when making observations at various frequencies to obtain the correct RM, care must be taken that the same source structure is measured. In particular there are problems in combining data from single dish observations with those of an interferometer at other frequencies. More recent observations use many adjacent frequency channels to accurately determine the RM, if a sufficiently wide band is used (RM Synthesis, section 2.4). This also helps to separate the intrinsic RM from that in the foreground. If RM Synthesis is not available, averaging over a large number of RMs is used reduce the intrinsic contributions.
The earliest catalogues of RM towards EGRS were collected by Simard-Normandin & Kronberg (1980) showing the all-sky distribution of RMs. In this compendium of sources there were only a few sources with measured RM along the Galactic plane, where the Galactic magnetic fields are concentrated, as was seen in the all-sky continuum surveys. Hence the interpretation of this data gave us an indication of a local magnetic field only. In recent years additional data on the RM of sources in the Galactic plane were obtained (Brown et al. 2007; Van Eck et al. 2011). However, all these surveys cover only partially the Galactic plane, so that interpretation is difficult. The highest observed values were |RM| ≈ 1000 rad m-2 towards the Galactic Center. Similarly high |RM| values were determined by Roy et al. (2008), who surveyed an area directly at the center of our Galaxy. There is neither a uniform coverage of the Galactic plane nor of the whole sky as yet. A statistical method to visualize the RM distribution over the sky was developed by Johnston-Hollitt et al. (2003) who used 800 sources. This work showed several areas of consistent RM values (of the same sign) as well as structures above and below the plane.
An important addition to the data set was undertaken by Taylor et al. (2009), who reanalyzed the NRAO VLA Sky Survey (NVSS) (Fig. 13). This study involved 37,543 sources and added a huge number of new RMs, but is limited by the rather close frequency separation of the two frequency bands which leads to large RM errors. The averaged RM towards extragalactic sources reveal no large-scale reversal across the plane around Galactic longitudes 120° and also -120° (according other observations showing a reversed sign in the southern region, not shown in Fig. 13): The local disk field is part of a large-scale symmetric field structure. However, towards the inner Galaxy the RM signs are opposite above and below the plane. This reversal may be due to local features (Wolleben et al. 2010b) or to an antisymmetric toroidal field in the Milky Way's halo (section 3.5).
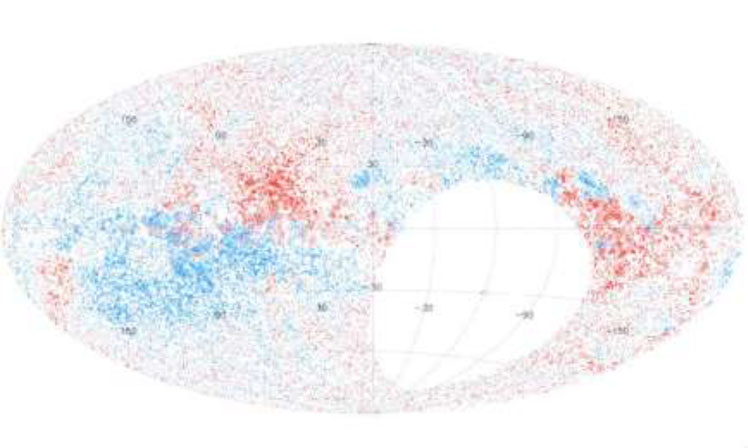 |
Figure 13. Rotation measures determined from the NVSS catalog (Taylor et al. 2009). Red symbols: positive RM, blue symbols: negative RM. The size of a circle scales linearly with RM magnitude. |
Another project to increase the number of RMs over the whole sky was undertaken at the Effelsberg radio telescope, combining polarization data in 8 channels in two bands around 1.4 and 1.6 GHz. This instrumental combination allows for accurate determination of the RM of sources. Some 1600 new RMs were added and a preliminary result is given in Wielebinski et al. (2008). The preliminary data for 2469 sources were used to model the Galactic magnetic field (Sun et al. 2008; section 3.5).
A survey of compact sources in the southern hemisphere that is being carried out with the Australia Telescope Compact Array will provide reliable Faraday depth spectra for over 3000 sightlines (Schnitzeler et al., in prep.). These sightlines will fill the gap below declination -40 degrees that is not covered by the RM catalogue from Taylor et al. (2009), and for the first time we will have a complete and well-sampled view of the entire Milky Way and its halo.
Pulsars are the ideal sources to probe the magnetic fields through the Faraday effect. Since pulsars have no measurable angular structure and they are highly polarized they are the ideal probes. Pulsars are Galactic objects and hence their distribution is close to the Galactic plane towards the inner Galaxy. In fact very few pulsars are known towards the anti-center of the Galaxy. Hence a combination of pulsars and EGRS is optimal for studies of the Galactic magnetic field. Pulsars also allow measurement of the Dispersion Measure (DM) which follows from the signal delay occurring in the foreground medium. Together with the RM the value of the average regular magnetic field in the line of sight can be deduced:
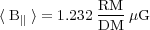 |
Application gives an average strength of the regular field in the local
spiral arm of 1.4 ± 0.2 µG. In the inner Norma arm, the
average strength of the regular field is 4.4 ± 0.9
µG. However, this
estimate is only valid if variations in the regular strength and in
electron density are not correlated. If they are correlated, the above
formula gives an overestimate of <B||>, and an
underestimate for anti-correlated variations
(Beck et al. 2003).
The dispersion of pulsar RMs yields an estimate for the turbulent field
strength of about 5 µG and for the turbulence length of
about 50 pc
(Rand & Kulkarni
1989/a>).
The major compilation of pulsar rotation measures, also using already
published data, are given in
Han et al. (2006;
2009).
Additional results are found in
Mitra et al. (2003),
Noutsos et al. (2008)
and
Van Eck et al. (2011).
The distribution of rotation measures, as given by
Han (2007),
shows a huge variation of signs and magnitudes. This may
indicate a large-scale regular magnetic field with multiple reversals
(section 3.5) or the effect of localized regions,
e.g. HII regions
(Mitra et al. 2003;
Nota & Katgert 2010).
The RM values increase for distant objects, but very few pulsars were
found beyond the Galactic Center (Fig. 14).
The limit of |RM| ≈ 1000 rad m-2
for EGRS holds also for pulsars. This seems to indicate that the RM
towards EGRS is partly averaged out in passage through the Galaxy. The
large-scale regular field of the outer Milky Way is either weak or
frequently reversing its direction.
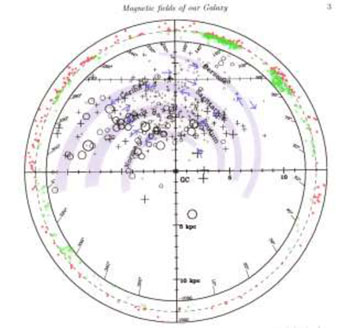
Figure 14. Faraday rotation measures (RM)
of pulsars in the Milky Way (within inside circle) and of
extragalactic radio sources (between inside and outside circles). Plus
signs indicate positive RM towards pulsars, small circles negative
RM. Red symbols indicate positive RM towards extragalactic sources,
green symbols negative RM. The blue arrows suggest large-scale magnetic
fields along a model of spiral arms in the Milky Way. Our sun is
located at the upper crossing of coordinate lines
(Han 2008).
The Zeeman effect is the most direct method of measuring magnetic
fields. It has been used in the optical range for detecting magnetic
fields in The Sun and in stars. At radio wavelength the use of the
Zeeman effect proved to be more difficult. For one, the frequency shifts
caused by the weak magnetic fields are minute and require sophisticated
instrumentation. The HI line gave the first definitive detections,
usually in absorption towards strong Galactic sources
(Verschuur 1968).
The technique was refined so that at present magnetic fields as weak as
≈ 5 µG can be detected with the Arecibo telescopes
(Heiles & Crutcher
2005).
The observation of the Zeeman effect in the OH molecule (e.g.
Crutcher et al. 1987)
advanced the field
further. It became clear that many of the positive detections were in
molecular clouds with maser sources. Strong magnetic fields (≈ 80 mG)
were detected in interstellar H2O maser clouds
(Fiebig & Güsten
1989).
Millimeter-wavelength astronomy gave us additional results for
high recombination lines
(Thum & Morris 1999)
or in such molecules as CN
(Crutcher et al. 1999)
or CCS
(Levin et al. 2000).
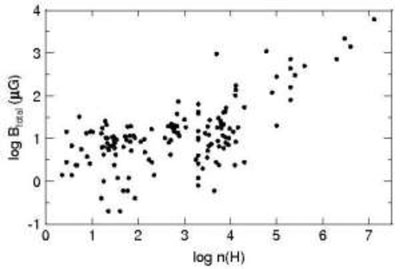
A compilation
of present-day Zeeman measurements of the magnetic field in gas clouds
(Fig. 15) gives a mean total field in the cold
neutral interstellar gas of 6 ± 2 µG, so that the
magnetic field dominates thermal motion but
is in equipartition with turbulence, as also found on much larger scales
in external galaxies (section 4.2).
Beyond cloud densities of ≈
1000 cm-3 the field strength scales with
n0.65±0.05
(Crutcher et al. 2010).
Figure 15. Zeeman measurements of the total
magnetic field in gas clouds plotted against
the hydrogen volume density nH (in cm-3). To
derive the total field Btotal, each measured line-of-sight
component was multiplied by a factor of 2 which is the average
correction factor for a large sample
(Crutcher et
al. 2010).
The importance of magnetic fields in the star-formation process is
obvious. Diffuse clouds are subcritical with respect to collapse and
probably balanced by magnetic fields, while dense molecular are
supercritical and collapse. The transition from subcritical to
supercritical state may be the result of ambipolar diffusion or
turbulence. Zeeman observations in the HI and OH lines can measure the
ratio of mass to magnetic flux in the cloud envelope and the core. A
smaller ratio in the core may indicate that supersonic turbulence plays
a similarly important role as ambipolar diffusion
(Crutcher et al. 2009),
but effects of the field geometry also have to be taken into account
(Mouschovias & Tassis
2009).
More and higher-quality data are needed.
The use of the Zeeman data for the investigation of a large-scale
regular magnetic field of the Galaxy was attempted by several authors (e.g.
Fish et al. 2003).
The number of detected sources was rather small and the interpretation
in terms of Galactic magnetic fields rather inconclusive.
Han & Zhang (2007)
collected a large data set of
Zeeman results and studied the question if the magnetic fields in
molecular clouds preserve information of the direction of the
large-scale magnetic fields in the spiral arms. In spite of a larger
data set all that the conclusion offered was that clouds "may still
remember the directions of regular magnetic fields in the Galactic ISM
to some extent".
3.5. Modeling the magnetic field of the Milky
Way
Based on all the data described in previous sections models of the
magnetic fields of the Milky Way have been repeatedly made. At first the
low frequency all-sky data was used to describe the Galactic non-thermal
emission (e.g.
Yates 1968)
produced in magnetic fields. The all-sky survey of
Haslam et al. (1982)
has been interpreted by
Phillips et al. (1981)
and
Beuermann et al. (1985).
Using the data on the HII regions (e.g.
Georgelin & Georgelin
1976)
of the Galaxy it could be shown that the spiral structure is also seen
in the diffuse radio continuum emission.
The RM data first for pulsars and later for extragalactic radio sources
(EGRS) also led to modeling of the magnetic fields of the Milky Way. The
RMs towards pulsars are due to the ISM in the direction of the inner
Galaxy. There are few pulsars known outside the inner quadrants. The
data on EGRS gave information about the Faraday effects over much of the
sky but not for the Galactic plane. Until recently there were very few
EGRS observed through the inner Galactic plane.
The collection of 543 rotation measures of EGRS distributed across the
sky by
Simard-Normandin &
Kronberg (1980)
showed that there were areas
with similar RM directions, suggesting organized magnetic fields over
larger Galactic scales. Pulsar observers were the first to point out
that in addition to large areas of similar magnetic field directions
there were some regions where the field reverses along Galactic
radius. These results were analyzed with wavelets (e.g.
Stepanov et al. 2002)
and confirmed the existence of at least one large-scale
reversal. Since most of the EGRS investigated were away from the
Galactic plane they did not trace the Galactic magnetic field in the
disk, more likely were indications of some local magnetic features. The
number of RMs has been steadily increasing (e.g.
Taylor et al. 2009)
which increased the sampling of the Galaxy considerably. The same
general conclusions were reached as in the earlier work — organized
magnetic structures in sections of the Galaxy and highly disorganized
magnetic fields towards the central region. One of the disadvantages of
the available data is the fact that the southern sky data is very spare
and needs additional observations. Progress has been made in
observations of EGRS in the Galactic plane
(Brown et al. 2007;
Van Eck et al. 2011),
but the sampling is still not uniform and not dense enough
along the plane. The RMs of EGRS in the very center of the Galaxy were
studied by
Roy et al. (2008)
who detected mainly positive RM values,
suggesting a magnetic field aligned with a central bar.
The analysis of data from radio continuum all-sky surveys at 1.4 and 23
GHz, from RMs towards EGRS, the best available thermal electron model
and an assumed cosmic ray distribution
(Sun et al. 2008,
Sun & Reich 2010)
constrained the average field strength of the Galaxy to ≈ 2
µG for the regular field and ≈ 3 µG for
the random
field in the solar neighborhood, s imilar to the results from pulsar RMs
(section 3.3.2). An axisymmetric spiral (ASS)
magnetic field configuration (section 2.6)
fits the observed data best, but one
large-scale reversal is required about 1-2 kpc inside the solar
radius. The local field is oriented parallel to the plane and its
direction is symmetric (even parity) with respect to the Galactic plane,
while the toroidal component of the halo field has different directions
above and below the Galactic plane (odd parity, see
section 2.6), to
account for the different signs of the observed RM data. If this
antisymmetry is globally valid for the Milky Way, its halo field has a
dipolar pattern, in contrast to that found in external galaxies
(section 4.7). However, some of the
asymmetry can be explained by distorted field lines around a local HI bubble
(Wolleben et al. 2010b).
Observations with better sampling of the sky are needed
(section 5).
Pulsars are ideal objects to deduce the Galactic magnetic field because
their RMs provide field directions at many distances from the Sun. Since
most pulsars are concentrated along the Galactic plane, they sample the
field in the disk. Analysis of the pulsar and EGRS data led to several
attempts to model the Galactic magnetic field
(Brown et al. 2007;
Van Eck et al. 2011;
Jansson & Farrar 2012).
The local magnetic field
in the Perseus arm is clockwise. A large-scale magnetic field reversal
is present between the Scutum-Crux-Sagittarius arm and the Carina-Orion
arm (Fig. 16). This reversal was often used as
an argument for a bisymmetric spiral (BSS) field structure, although
such a reversal can be local or be part of a more complicated field
structure. Detailed analysis (e.g.
Vallée 1996;
Noutsos et al. 2008)
has shown that this
concept of a single large-scale field mode is not compatible with the
data. The analysis of the previous interpretations by
Men et al. (2008)
also showed that presently there is no proof of either a BSS or a ASS
configuration and that the field structure is probably more complicated.
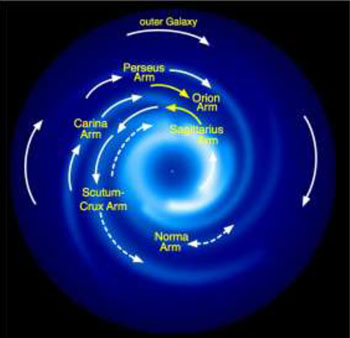
Figure 16. Model of the large-scale
magnetic field in the Milky Way's disk, derived from Faraday rotation
measures of pulsars and extragalactic sources. Yellow arrows indicate
confirmed results, while white and dashed arrows still need
confirmation (from Jo-Anne Brown, Calgary).
Studies of the effects of large HII regions on the RM changes of pulsars
beyond these Faraday screens showed that some earlier interpretations
that some of the claimed field reversals are only local
(Mitra et al. 2003).
Furthermore, the comparison of the RM of pulsar and EGRS
towards the Galactic Center
(Brown et al. 2007)
revealed similar values
of RM, as if there were no other half of the Galaxy. This result
suggests that the RMs are dominated by local ISM features and that the
large-scale field is weak and cannot be delineated from the available
data. Only RM data free from the effects of HII regions should be used,
as demonstrated by
Nota & Katgert (2010).
The magnetic field structure of the Milky Way is probably quite complex
and shows details which cannot be resolved yet in external spiral
galaxies. The existence of one large-scale field reversal in the Milky
Way is puzzling. Very few large-scale reversals have been detected so
far in external spiral galaxies, and none along the radial direction
(section 4.4). The different observational
methods may be responsible
for this discrepancy between Galactic and extragalactic results. RMs in
external galaxies are averages over the line of sight through the whole
disk and halo and over a large volume traced by the telescope beam, and
they may miss field reversals, e.g. if these are restricted to a thin
region near to the galaxy plane. The results in the Milky Way are based
on RMs of pulsars, which trace the magneto-ionic medium near the
plane. Alternatively, the Milky Way may be "magnetically young" and may
still not have generated a coherent large -scale field over the whole
disk. The timescale for fully coherent fields can be longer than the
galaxy age, e.g. if frequent interactions with other galaxies occur
(section 2.6). Another model to explain
reversals is the continuous
generation of small-scale fields; these may disturb the action of the
large-scale dynamo and allow reversals of the initial field to persist
(Moss et al. 2012).
Little is known about the large-scale field in the Milky Way's halo. In
the Galactic Center vertical magnetic fields apparently extend into the
halo (section 3.2.3). From a survey of RMs of EGRS
towards the Galactic poles,
Mao et al. (2010)
derived a local large-scale field perpendicular
to the plane of +0.31 ± 0.03 µG towards the south
Galactic pole, but no significant field towards the north Galactic
pole. This is neither consistent with an odd-symmetry halo field as
suggested from the antisymmetry of the toroidal field nor with an
even-symmetry halo field as found in several external galaxies
(section 4.7). On the other hand,
Jansson & Farrar
(2012),
modeling the diffuse polarized emission and
RMs, found evidence for X-shaped vertical field components, similar to
those in external galaxies. Again, the halo field may be more
complicated than predicted by large-scale dynamo models, and regions
with different field directions exist.
While observations in the Milky Way can trace magnetic structures to
much smaller scales than in external galaxies, the large-scale field is
much more difficult to measure in the Milky Way. This information gap
will be closed with future radio telescopes which will find many new
pulsars in the Milky Way (and in nearby galaxies) and which allow us to
observe the detailed magnetic field structure also in external galaxies
(section 5).