


There are, in principal, several different ways to attempt to pinpoint extreme-redshift galaxies amid the overwhelming numbers of lower-redshift objects on the sky. The two methods that have proved most effective in recent years both involve optical to near-infrared observations of rest-frame ultraviolet light, and both rely on neutral Hydrogen. The first method, the so called Lyman-break technique, selects Lyman-break galaxies (LBGs) via the distinctive "step" introduced into their blue ultraviolet continuum emission by the blanketing effect of neutral hydrogen absorption (both within the galaxy itself, and by intervening clouds along the observer's line-of-sight; see Fig. 1). The second method selects galaxies which are Lyman-α emitters (LAEs), via their highly-redshifted Lyman-α emission lines, produced by hydrogen atoms in their interstellar media which have been excited by the ultraviolet light from young stars. Both of these techniques have now been used to discover large numbers of galaxies out to z ≥ 7, and are therefore discussed in detail in the two subsections below.
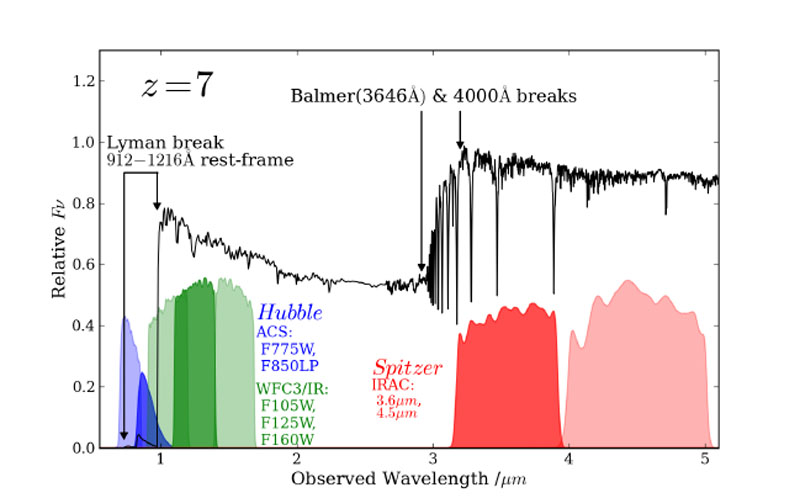 |
Figure 1. An illustration of the redshifted form of the rest-frame ultraviolet spectral energy distribution (SED) anticipated from a young galaxy at z ≃ 7, showing how the ultraviolet light is sampled by the key red optical (i775, z850) and near-infrared (Y105, J125, H160) filters on-board HST (in the ACS and WFC3/IR cameras respectively), while the longer-wavelength rest-frame optical light is probed by the 3.6 µm and 4.5 µm IRAC channels on-board Spitzer. Wavelength is plotted in the observed frame, with flux-density plotted as relative fν (i.e. per unit frequency). The spectrum shows the sharp drop at λrest = 1216 Å due to the strong "Gunn-Peterson" absorption by intervening neutral hydrogen anticipated at this redshift (here predicted following Madau (1995); see also the observed spectrum of the most distant quasar shown in Fig. 2). Longward of this "Lyman-break" the spectrum shown is simply that of the intrinsic integrated galaxy starlight as predicted for a 0.5 Gyr-old galaxy by the evolutionary spectral synthesis models of Bruzual & Charlot (2003) (using Padova-1994 tracks, assuming constant star formation, zero dust extinction, and 1/5th solar metallicity). The characteristic sharp step in the galaxy continuum at λrest = 1216 Å (which at z ≃ 7 is predicted to result in a very red z850 - Y105 colour) holds the key to the effective selection of Lyman-break galaxies at z > 5, as discussed in detail in section 3.1. The theoretical spectrum shown here does not include the Lyman-α emission line which is produced by excitation/ionization of hydrogen atoms in the inter-stellar medium of the galaxy; this offers the main current alternative route for the selection of high-redshift galaxies (see Fig. 8 and section 3.2), and the only realistic hope for spectroscopic confirmation of galaxy redshifts at z > 5 with available instrumentation. Also not shown are other nebular emission lines at rest-frame optical wavelengths, which can complicate the apparent strength of the key Balmer or 4000 Å break as measured by the IRAC photometry. In the absence of serious line contamination, the strength of this break offers a key estimate of the age of the stellar population, with consequent implications for a meaningful measurement of galaxy stellar mass. The gap between the WFC3/IR and IRAC filters can be filled for brighter objects with ground-based K-band imaging, but will not be covered from space until the advent of JWST (courtesy S. Rogers). |
The only real drawback of these two techniques is that they are only capable of selecting galaxies which are young enough to produce copious amounts of ultraviolet light, and are sufficiently dust free for a fair amount of this light to leak out in our direction. In an attempt to find galaxies at z > 5 which are at least slightly older (remembering there is only ≃ 1 Gyr available) some authors (e.g. Wiklind et al. 2008) have endeavoured to select galaxies on the basis of the Balmer break, even though, at λrest = 3646 Å this break is moved to λobs > 2.4 µm at z > 5. Since this lies beyond the near-infrared wavelength range accessible from the ground, this work is only possible due to the power of the IRAC camera on board Spitzer, which can be used to observe from 3 to 8 µm. As discussed later in section 5.1, Spitzer has certainly proved very effective at measuring the strength of Balmer breaks in high-redshift galaxies which have already been discovered via their ultraviolet emission but, to date, Balmer-break selection has yet to uncover a galaxy at z > 5 which could not have been discovered via other techniques (i.e. the only spectroscopically-confirmed Balmer-break selected galaxy in the sample compiled by Wiklind et al. is also a Lyman-break galaxy). This lack of success may of course simply be telling us that there are not many (or indeed any) galaxies at these early epochs of the correct age and star-formation history (≥ 0.5 Gyr-old and no longer forming stars) to be better selected via their Balmer break than their ultraviolet emission; in an era of essentially limitless gas fuel, and almost universal star-formation activity this would not be altogether surprising. However, it may also be the case that Balmer-break selection is simply premature with current facilities; the spectral feature itself is not nearly as strong (a drop in flux density of a factor of ≃ 2 at most) as the Lyman break at these redshifts, and at z > 5 its detection currently relies on combining Spitzer 3.6 µm photometry with ground-based K-band (2.2 µm ) photometry (Fig. 1). Thus, while Balmer-break selection is undoubtedly important for ensuring we have a complete census of the galaxy population at the highest redshifts, its successful application may have to await the advent of the James Webb Space Telescope (JWST), and so it is not discussed further here.
 |
Figure 2. The near-infrared spectrum of the most distant known quasar ULASJ112001.48+064124.3, the first (and, to date, only) quasar discovered at redshifts z > 7 (z = 7.085; Mortlock et al. 2011). The data are shown in black, with the 1-σ error spectrum shown at the base of the plot. Despite being observed only 0.77 billion years after the Big Bang, this quasar has an intrinsic spectrum essentially identical to that displayed by lower-redshift quasars with, for example, strong Carbon lines indicating approximately solar metallicity (the red curve shows the average spectrum of 169 quasars in the redshift range 2.3 < z < 2.6). However, shortward of λrest ≃ 1216 Å the spectrum provides an excellent demonstration of the Gunn-Peterson effect, whereby the increased fraction of neutral hydrogen along the line-of-sight has completely obliterated the UV continuum emission from the quasar. This sudden drop in flux-density shortward of Lyman-α is the key spectral feature which facilitates not just the selection of rare extreme-redshift quasars such as this, but also the selection of fainter but much more numerous "Lyman-break galaxies" (LBGs) at redshifts z > 5 (see Fig. 1) (courtesy D. Mortlock). |
A fourth technique, which is only now coming of age at z > 5, involves the selection of extreme-redshift galaxies via sub-mm/mm observations of their redshifted thermal dust emission. By definition this approach is incapable of detecting the very first primeval galaxies, devoid of any of the elements required for dust, but chemical enrichment appears to be a very rapid process, and both dust and molecular emission have certainly been detected in objects at z > 6 (Walter et al. 2003; Robson et al. 2004; Wang et al. 2010). Although this dust emission is powered by ultraviolet emission from young stars, it is already clear that at least some of the galaxies successfully discovered via sub-mm observations at more modest redshifts display such strong dust extinction that they could not have been selected by rest-frame ultraviolet observations. Thus, while we might expect dust to become less prevalent at extreme redshifts (and there is evidence in support of this presumption - e.g. Bouwens et al. 2009; Zafar et al. 2010; Bouwens et al. 2010a; Dunlop et al. 2012; Finkelstein et al. 2012) it will be important to pursue sub-mm/mm selection at z > 5 over the coming decade to ensure a complete picture of early galaxy evolution. As with Balmer-break selection, this is a technique which (for technical reasons) is still in its infancy, although excitingly the first spectroscopic redshift at z > 5 for a mm-selected galaxy has recently been measured purely on the basis of redshifted CO line emission (z ≃ 5.3; Riechers et al. 2010). Over the next few years this whole field should be revolutionized by the advent of the Atacama Large Millimetre Array (ALMA).
A fifth approach, which it is important not to forget, is that high-redshift "galaxies" continue to be located on the basis of both optical and radio emission powered by accretion onto their central super-massive black holes. Indeed, the quasar redshift record has recently crossed the z = 7 threshold (z = 7.085; Mortlock et al. 2011), and significant numbers of quasars are now known at z > 6 (e.g. Fan et al. 2003, 2006; Willott et al. 2010). High-redshift quasars are rare but, because of their brightness, have the potential to provide much useful information on the state of the inter-galactic medium (IGM) at early times (e.g. Carilli et al. 2010), as well as providing signposts towards regions of enhanced density in the young universe. However, the very strong active nuclear emission which facilitates the discovery of high-redshift quasars also makes it extremely difficult to detect, never mind study, the stellar populations in their host galaxies (e.g. Targett, Dunlop & McLure 2012), and so they are inevitably of limited use for the detailed investigation of early galaxy evolution. By contrast it is perfectly possible to study the stellar populations in high-redshift radio galaxies (e.g. McCarthy 1993; Dunlop et al. 1996; Seymour et al. 2007), and indeed for many years essentially all of our knowledge of galaxies at z > 3 was derived from the optical–infrared–sub-mm study of objects which were originally selected on the basis of radio-frequency synchrotron emission powered by super-massive black holes (e.g. Lilly 1988; Dunlop et al. 1994; Rawlings et al. 1996). However, in recent years the search for increasingly high-redshift radio galaxies has rather run out of steam; the z = 5 threshold was passed in 1999 (z = 5.197; van Breugel et al. 1999), but 12 years later the radio-galaxy redshift record remains unchanged. This difficulty in further progress is perhaps not unexpected, given the now well-established decline in the number density of powerful radio sources beyond z ≃ 3, and the unhelpfully strong k-correction provided by steeply-falling power-law synchrotron emission (Dunlop & Peacock 1990; Rigby et al. 2011). Nevertheless, searches for higher-redshift radio galaxies will continue, motivated at least in part by the desire to find even a few strong radio beacons against which to measure the 21-cm analogue of the Lyman-α forest as we approach the epoch of reionization (the "21-cm forest"; Carilli, Gnedin & Owen 2002; Furlanetto & Loeb 2002; Mack & Wyithe 2012). However, at least for now, radio-continuum selected objects offer little direct insight into galaxy evolution at the very highest redshifts. A thorough review of what is currently known about distant radio galaxies and their environments is provided by Miley & De Breuck (2008), who also include a compendium of known high-redshift radio galaxies.
A relatively new sixth, and remarkably effective route to pinpointing high-redshift objects has recently arrived with the discovery of Gamma-Ray Bursts (GRBs). These are now regularly detected via monitoring with gamma-ray satellites such as Swift (Gehrels et al. 2004), and then rapidly followed up with a range of ground-based observations (e.g. Fynbo et al. 2009). Long-duration GRBs are thought to arise from the death of very massive, possibly metal-poor stars (Woosley & Bloom 2006), and observationally have been associated with Type 1c supernovae (e.g. Hjorth et al. 2003). Regardless of their precise physical origin, they have proved to be very luminous events which are visible out to the highest redshifts, z > 8 (the gamma-ray positions are poor, but rapid follow-up can pinpoint the fading optical/near-infrared afterglow unambiguously and, if quick enough, can also yield robust redshift information). GRBs broke the z = 5 "barrier" very quickly after their discovery, with a redshift of z = 6.295 measured for GRB 050904 by Haislip et al. (2006) and Kawaii et al. (2006). Another GRB at z > 5 followed the next year with the discovery of GRB 060927 at z = 5.467 (Ruiz-Vesco et al. 2007). Two years later, GRBs wrested the redshift record from quasars and LAEs, with Greiner et al. (2009) reporting a redshift of z = 6.7 for GRB 080913. Then, most spectacularly, a GRB became the first spectroscopically confirmed object at z > 8, with GRB 090423 being convincingly shown to lie at z = 8.23 (Salvaterra et al. 2009; Tanvir et al. 2009). Most recently, it has been argued that GRB 090429B lies at z ∼ 9.4 (Cucchiara et al. 2011) but the robustness of this (photometric) redshift is currently a matter of debate. Given this impressive success in redshift record breaking, the reader may be surprised to learn that I have chosen not to consider GRBs further in this chapter. The reason is that, to date, while the hosts of many lower-redshift GRBs have been uncovered (e.g. Perley et al. 2009) follow-up observations targetted on the positions of faded GRB remnants at z > 5 have yet to yield useful information on their host galaxies. This is, of course, an interesting result in its own right. It indicates that, as arguably expected, GRBs largely occur in faint dwarf galaxies which lie below the sensitivity limits of even our very best current instrumentation. Specifically, the follow-up HST WFC3/IR imaging of the z = 8.23 GRB 090423 reaching J125 ≃ 28.5 has failed to detect the host galaxy (Tanvir et al. in prep), while the host of GRB 090429B is apparently undetected to Y105 ≃ 28 (Cucchiara et al. 2011). Thus, while as discussed by Robertson & Ellis (2012), high-redshift GRBs can already provide important insights into global cosmic star-formation history, their usefulness as transient signposts towards extreme-redshift galaxies is unlikely to be properly exploited until the advent of JWST.
Finally, over the next decade we are likely to see the emergence of a seventh technique for finding extreme-redshift galaxies via radio-wavelength spectroscopy. Specifically, following the first successful mm-to-radio CO-line redshift determinations, in addition to the above-mentioned targetted CO line follow-up of pre-selected mm/sub-mm sources with ALMA, we can expect to see "blind" spectroscopic surveys for CO and for highly-redshifted 21-cm atomic Hydrogen emission with the new generation of radio facilities (e.g. Carilli 2011).
In the absence dust obscuration, young star-forming galaxies are expected to be copious emitters of UV continuum light, with a star-formation rate SFR = 1 M⊙ yr-1 predicted to produce a UV luminosity at λrest ≃ 1500 Å of fν ≃ 8 × 1027 erg s-1 Hz-1 for a Salpeter (1955) initial mass function (Madau et al. 1998). For reference, this corresponds to an absolute magnitude of M1500 ≃ -18 which, at z ≃ 7, translates to an observed near-infrared J-band magnitude of J ≃ 28.5. As we shall see, this is very comparable to the detection limit of the deepest HST WFC3/IR imaging currently available.
The basic idea of selecting distant objects (galaxies or quasars) via the signature introduced by hydrogen absorption of this ultraviolet light goes back several decades (e.g. Meier 1976a, b). As first successfully implemented in the modern era by Guhathakurta et al. (1990) and Steidel & Hamilton (1992), the aim was to select galaxies at z ∼ 3 by searching for sources in which the Lyman-limit at λrest = 912 Å had been redshifted to lie between the U and Bj filters at λobs ≃ 3600 Å. All ultraviolet-bright astrophysical objects display an intrinsic drop in their spectra at λrest = 912 Å (which corresponds to the ionization energy of the hydrogen atom in the ground state), and the expectation was that, in young galaxies, this drop would be very strong (roughly an order-of-magnitude in flux density) due to a combination of the hydrogen edge in stellar photospheres, and photo-electric absorption by the interstellar neutral hydrogen gas (expected to be abundant in young galaxies). At the highest redshifts, the ever denser intervening neutral hydrogen clouds also produce increasing Lyman-α absorption (between energy levels 1 and 2 in the hydrogen atom) resulting in an ever-thickening Lyman-α forest which impacts on the continuum of the target galaxy between λrest = 1216 Å and λrest = 912 Å. At moderate redshifts the average blanketing effect of this forest simply produces an additional (and useful) signature in the galaxy spectrum in the form of an apparent step in the continuum below Lyman-α (a factor of ∼ 2 drop in flux density at λrest = 1216 Å at z ∼ 3; Madau 1995). However, as discussed further below (and illustrated in Figs. 1 & 2) ultimately the forest becomes so optically thick that it kills virtually all of the galaxy light at λrest < 1216 Å, rendering the original 912 Å break irrelevant, and Lyman-break selection in effect becomes the selection of objects with a sharp break at λrest = 1216 Å.
The beauty of the Lyman-break selection technique is that it can be applied using imaging with broad-band filters, allowing potentially large samples of high-redshift galaxies to be selected for spectroscopic follow-up and confirmation. When selecting galaxies in this way, what one is looking for are objects which are repeatedly visible (and fairly blue) in the longer wavelength images, but then effectively disappear in the bluest image under consideration. For this reason such objects are often called "dropout" galaxies. Thus,"U-dropouts" (or simply "U-drops") are galaxies which disappear in the U-band filter, and are therefore expected to have their Lyman limit moved to λobs ≃ 3500 Å implying a redshift z ∼ 3 (in practice 2.5 ≤ z ≤ 3.5). Similarly, "B-drops" (or "G-drops") are expected to be galaxies at z ∼ 4, while "V-drops" should have z ∼ 5. Thus, deep broad-band optical imaging can be used to select samples of galaxies in bands of increasing redshift.
The simple act of colour selection yields redshifts accurate to δ z ≃ 0.1-0.2. Consequently, with the aid of simulations to estimate the effective redshift distribution and cosmological volume probed by each specific drop-out criterion, luminosity functions (LFs) can be derived in broad redshift bands without recourse to optical spectroscopy. However, for proper assessment of completeness/contamination, and the determination of redshifts with sufficient accuracy to allow robust clustering measurements, spectroscopic follow-up is essential.
The huge break-throughs enabled by the successful application of the "dropout" technique in the 1990s are perhaps best exemplified by the work of Steidel and collaborators (who were able to use the 10-m Keck telescope to spectroscopically confirm large samples of LBGs, enabling LF and clustering measurements - e.g. Steidel et al. 1996, 2000) and by the study of Madau et al. (1996) who applied the technique to the deep HST WFPC2 U300, B450, V606, I814 imaging in the Hubble Deep Field (HDF; Williams et al. 1996, Ferguson et al. 2000) to produce the first measurement of the average cosmic star-formation density out to z ∼ 4. A full overview of this "low-redshift" work is beyond the scope of this Chapter, but a thorough review of the success of the Lyman-break technique in enabling the discovery and study of galaxies in the redshift range 2 < z < 5 can be found in Giavalisco (2002).
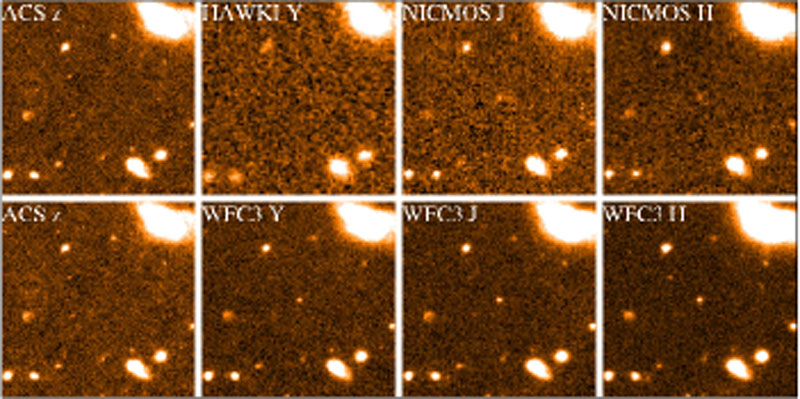 |
Figure 3. The Lyman-break selection of a z ≃ 7 galaxy uncovered in the Hubble Ultra-Deep Field (HUDF). The upper row of plots shows postage stamps of the available data at z850, Y, J110, H160 prior to the advent of the new WFC3/IR near-infrared camera on HST in 2009. The lower row of plots shows the hugely-improved near-infrared imaging provided by WFC3/IR for the same object; it can be clearly seen that this galaxy is strongly detected in the three longest-wavelength passbands (H160, J125 and Y105) but drops out of the z 850 image altogether, due to the presence of the Lyman-break redshifted to λobs ≃ 1 µm , as was illustrated in Fig. 1 (courtesy R. McLure). |
The ensuing decade has seen rapid progress from z ≃ 5 to z ≃ 8, in part because this selection technique is, in principle, even more straightforward at z ≥ 5 than at lower redshifts. This is because by z = 5 the Lyman-α forest produced by intervening clouds of neutral Hydrogen is expected to be so dense that the anticipated break in the continuum level at λe ≃ 1216 Å is ≃ 1.8 mag., or a factor ≃ 5 in average flux density (Madau 2005). This is more than twice as strong as any of the other intrinsically strong breaks displayed by the starlight from galaxies (e.g. the λ = 4000 Å break in an old stellar population, produced by an acculmulation of absorption lines from ionized metals, (especially Ca II H and K lines at 3933 and 3968 Å), or the λ = 3646 Å Balmer break in a ∼ 0.5 Gyr-old post-starburst galaxy, most prominent in A stars, with T ∼ 10000 K). By z > 6.5, observations of the highest-redshift quasars indicate that essentially all flux shortward of Lyman-α is extinguished (Fig. 2), and LBG selection effectively becomes the selection of galaxies with a complete "Gunn-Peterson Trough" (Gunn & Peterson 1965).
Thus, given sufficiently good signal:noise, and appropriate broad-band filters, the selection of Lyman-break galaxies at z > 5 should be easy and reasonably clean, and indeed has proved to be so once detector and telescope developments were successfully combined to deliver the necessary deep, red-sensitive imaging.
3.1.1. Lyman-break galaxies at z > 5
The main reason for a delay in progress in LBG selection beyond z ≃ 5 was the need for sufficiently deep imaging in at least two wavebands longer than the putative Lyman break; as illustrated in Figs. 1, 3, 4 and 5, at least two colours (hence three wavebands) are needed to confirm both the existence of a strong spectral break, and a blue colour longward of the break (as anticipated for a young, ultraviolet-bright galaxy; see subsection 3.1.3 on potential contaminants). This need was finally met with the refurbishment of the HST in March 2002 with a new red-sensitive optical camera, the Advanced Camera for Surveys (ACS), and a new cooling system for the Near Infrared Camera and Multi-Object Spectrometer (NICMOS). Crucially, the ACS was quickly used to produce and release the deepest ever optical image of the sky, the 4-band (B435, V606, i775, z850) Hubble Ultra Deep Field (HUDF; Beckwith et al. 2006), covering an area of ≃ 11 arcmin2 to typical depths of mAB ≃ 29 for point sources. This field (or at least 5.7 arcmin2 of it) was also imaged with NICMOS, in the J110 and H160 bands by Thompson et al. (2005, 2006) to depths of mAB ≃ 27.5. Around the same time the ACS was also used as part of the Great Observatories Deep Survey (GOODS) program to image two 150 arcmin2 fields (again in B435, V606, i775, z850) to more moderate depths, mAB ≃ 27.5 - 26.5 (GOODS-North, containing the HDF, and GOODS-South, containing the HUDF; Giavalisco et al. 2004). Deep Spitzer IRAC imaging (at 3.6, 4.5, 5.6, 8 µm ) was also obtained over both GOODS fields, and a co-ordinated effort was made to obtain deep Ks-band imaging for GOODS-South from the ground with ISAAC on the 8.2-m VLT (Retzlaff et al. 2010).
The result was a flood of papers reporting the discovery of "i-drop" galaxies at z ≃ 6 (Bouwens et al. 2003, 2004a, 2006; Bunker et al. 2003, 2004; Dickinson et al. 2004; Stanway et al. 2003, 2004, 2005; Yan & Windhorst 2004; Malhotra et al. 2005; Beckwith et al. 2006; Grazian et al. 2006), and even an (arguably premature, but partially successful) attempt to uncover "z850-drop" galaxies at z ≃ 7 (Bouwens et al. 2004c) and set limits at even higher redshifts (Bouwens et al. 2005).
Spectroscopic follow-up was rapidly achieved for several of the brighter "i-drops" yielding the first spectroscopically-confirmed LBGs at z ≃ 6 (Bunker et al. 2003; Lehnert & Bremer 2003; Vanzella et al. 2006; Stanway et al. 2007), and some of these were even successfully detected with Spitzer at 3.6 µm and 4.5 µm , yielding some first estimates of their stellar masses and star-formation histories (e.g. Labbé et al. 2006; Yan et al. 2006; Eyles et al. 2007)
Further spectroscopic follow-up of z ≥ 5 LBGs in the GOODS fields has been steadily pursued with Keck and the VLT over the last few years, (e.g. Stark et al. 2009, 2010, 2011; Vanzella et al. 2009) yielding interesting results on mass density, evolution, and Lyman-α emission from LBGs which are discussed further in sections 4 and 5.
From 2005, progress in wide-area red optical and near-infrared imaging with Suprime-Cam (Miyasaki et al. 2002) on the Subaru telescope, and WFCAM (Casali et al. 2007) on UKIRT (via the UKIDSS survey; Lawrence et al. 2007) led to the first significant samples of brighter z ≃ 6 galaxies being selected from ground-based surveys covering areas approaching ≃ 1 deg2 (Kashikawa et al. 2004; Shimasaku et al. 2005; Ota et al. 2005; McLure et al. 2006, 2009; Poznanski et al. 2007; Richmond et al. 2009). As discussed further below in section 4.1, this work complements the deeper but much smaller-area HST surveys by providing better sampling of the bright end of the LF.
Motivated by the availability of 12-band CFHT+Subaru+UKIRT+Spitzer-IRAC photometry in the UKIDSS Ultra Deep Survey (UDS) field (coincident with the Subaru/XMM-Newton Deep Survey (SXDS); Furusawa et al. 2008), McLure et al. (2006) also introduced a new approach to selecting galaxies at z > 5, replacing simple two-colour "dropout" criteria with multi-band redshift estimation via model spectral energy distribution (SED) fitting (a technique commonly adopted at lower redshifts – e.g. Mobasher et al. 2004, 2007; Cirasuolo et al. 2007, 2010). This approach has the advantage of using all of the data in a consistent way (including multiple non-detections) and captures the uncertainty in redshift (and resulting uncertainty in stellar masses etc) for each individual object (Fig. 4). In addition, it provides better access to redshift ranges where the simple two-colour dropout technique is sub-optimal (due, for example, to the Lyman-break lying within rather than at the edge of a filter bandpass; see Fig. 5). It can also yield a redshift probability distribution for each source (e.g. Finkelstein et al. 2010; although there is a debate to be had about appropriate priors), and explicitly exposes alternative acceptable redshift solutions (e.g. Dunlop et al. 2007), enabling targetted spectroscopic follow-up to reject these if desired. Nevertheless, careful simulation work is still required to estimate incompleteness and contamination, and the SED-fitting approach can arguably be harder for others to replicate than simple two-colour selection.
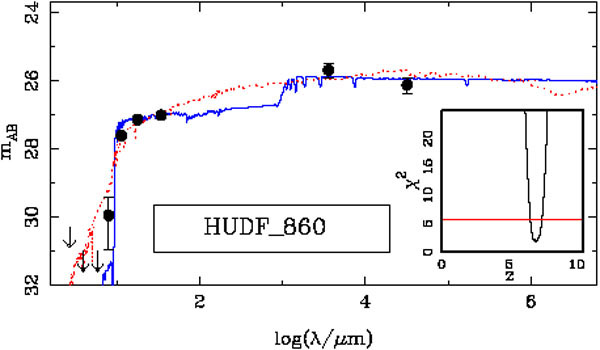 |
Figure 4. An example of the galaxy-template SED-fitting analysis employed by McLure et al. (2009, 2010, 2011) for high-redshift galaxy selection, which makes optimum use of the available multi-wavelength photometry (including de-confused Spitzer IRAC fluxes; McLure et al. 2011). Based on the evolutionary synthesis models of Bruzual & Charlot (2003), not only redshift, but also age, star-formation history, dust extinction/reddening, mass and metallicity are all varied in search of the best-fitting solution. This also enables robust errors to be placed on the range of acceptable photometric redshifts, after marginalising over all other parameters. In this case the photometry provides more than adequate accuracy and dynamic range to exclude all redshift solutions other than that indicated by the blue line, which yields z ≃ 6.96 ± 0.25. The thin dotted red line shows the best-fitting alternative solution at low redshift, albeit in this case this alternative is completely unacceptable. |
One disadvantage of ground-based imaging is the potential for z > 5 LBG sample contamination by cool dwarf stars (see section 3.1.3). On the other hand, because the LBG candidates are relatively bright, spectroscopic follow-up has proved very productive, and has now yielded Lyman-α redshifts in the range z ≃ 6 - 6.5 for ≃ 30 LBGs selected from ground-based surveys (Nagao et al. 2004, 2005, 2007; Jiang et al. 2011; Curtis-Lake et al. 2012). These spectroscopic programs provide not only more accurate redshifts, but also enable measurement of the prevalence and strength of Lyman-α emission from LBGs as a function of redshift and continuum luminosity. Such measurements have the potential to shed light on the connection between LBGs and LAEs, the cosmic evolution of dust, and the process of reionization (see sections 4.3 & 6.2)
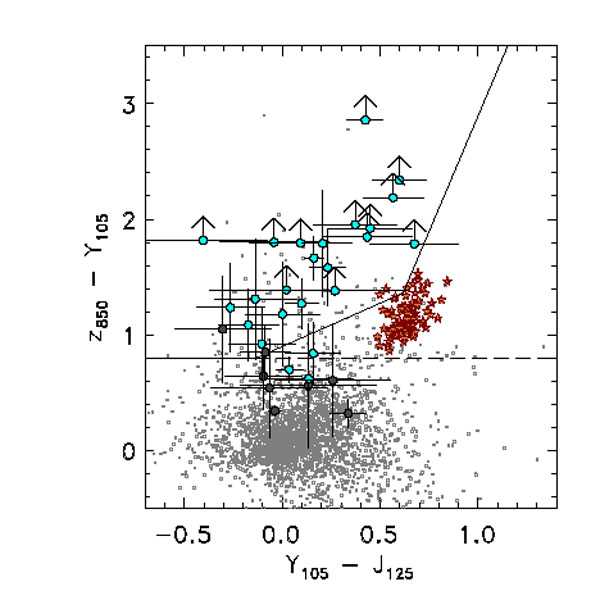 |
Figure 5. An illustration provided by Finkelstein et al. (2010) of some of the limitations of using a simple, strict, colour-colour criterion to select high-redshift LBGs. Filled circles indicate high-redshift galaxies selected by SED fitting, with the dark-grey circles indicating galaxies with 6.0 < zphot < 6.3 and the blue circles highlighting galaxies at 6.3 < zphot < 7.5. Arrows are 1-σ limits. The solid lines show the selection cuts adopted by Oesch et al. (2010), and the dashed line is from Yan et al. (2010) (both designed to select LBGs at z ≃ 7). The small grey squares are low-redshift galaxy contaminants with z phot < 6.0, and the red stars indicate the colours of galactic brown-dwarf stars. The colour cuts result in the inclusion of many contaminants as well as the exclusion of genuine high-redshift candidates that are identified via full SED fitting (which makes more optimal use of all the available data, including marginal detections at optical wavelengths) (courtesy S. Finkelstein). |
At z > 6.5 ground-based selection of LBGs becomes extremely difficult due to the difficulty in reaching the necessary near-infrared depths, although quite how difficult depends of course on the shape of the LF at z ≃ 7. Such progress as has been made with Subaru and the VLT between z ≃ 6.5 and z ≃ 7.3 is discussed in the next subsection.
3.1.2. Lyman-break galaxies at z = 7 - 10
By redshifts z ≃ 7, the Lyman break has moved to λobs ≃ 1 µm, beyond the sensitivity regime of even red-sensitive CCD detectors. As a result, efforts to uncover LBGs at z > 6.5 were largely hamstrung by the lack of sufficiently-deep near-infrared imaging, until the installation of the long-awaited new camera, WFC3, in the HST in May 2009. Due to its exquisite sensitivity and (by space standards) wide field-of-view (4.8 arcmin2), the infrared channel of this camera, WFC3/IR, offered a ∼ 40-fold improvement in mapping speed over NICMOS for deep near-infrared surveys. This, coupled with the availability of an improved near-infrared filter set, immediately rendered obsolete the few heroic early attempts to uncover LBGs at z > 6.5 with NICMOS (e.g. Bouwens et al. 2004, 2010c), even those assisted by gravitational lensing (e.g. Richard et al. 2008; Bradley et al. 2008; Bouwens et al. 2009a; Zheng et al. 2009).
The remarkable improvement offered by WFC3/IR at near-infrared wavelengths is illustrated in Fig. 3, which shows the imaging data available before and after Sept 2009 for (arguably) the only moderately-convincing "z850-drop" z ≃ 7 galaxy uncovered with NICMOS+ACS (Bouwens et al. 2004; Oesch et al. 2009; McLure et al. 2010). These images are extracted from the first (Sept 2009) release of the WFC3/IR Y105, J125, H160 imaging of the HUDF, taken as part of the HUDF-09 treasury program (PI: Illingworth). This reached previously unheard-of depths mAB ≃ 28.5, and immediately transformed our knowledge of galaxies at z > 6.5, with four independent groups reporting the first substantial samples of galaxies with 6.5 < z < 8.5 (Oesch et al. 2010a; Bouwens et al. 2010b; McLure et al. 2010; Bunker et al. 2010; Finkelstein et al. 2010). Both the above-mentioned alternative approaches to LBG selection were applied to these new data, with McLure et al. (2010) and Finkelstein et al. (2010) undertaking full SED fitting (Fig. 4), while the other groups applied standard two-colour "drop-out" criteria (Fig. 5). Three independent reductions of the raw data were also undertaken prior to LBG selection. Given this, the level of agreement between the 6.5 < z < 8.5 source lists was (and remains) undeniably impressive. The era of galaxy study at z > 7 has now truly arrived.
The initial HUDF WFC3/IR data release was rapidly followed by the release of the WFC3 Early Release Science (ERS) data (Windhorst et al. 2011). The infrared component of this dataset comprised 2-orbit depth WFC3/IR imaging in Y098, J125, H160 over 10 pointings in the northern part of the GOODS-South field, and thus complemented the HUDF imaging by delivering imaging of ≃ 40 arcmin2 to mAB ≃ 27.5. The intervening two years have seen the completion of the HUDF-09 program, involving deeper imaging of the HUDF itself to mAB ≃ 29, and Y105, J125, H160 imaging of two parallel fields to mAB ≃ 28.5. The combined HUDF-09 and ERS dataset has now been analysed in detail for LBGs at z > 6.5 (again by several independent groups; Wilkins et al. 2010, 2011a; Bouwens et al. 2011b; Lorenzoni et al. 2011; McLure et al. 2011), and has yielded samples of ∼ 70 candidate LBGs at z ∼ 7, ∼ 50 at z ∼ 8, and possibly one galaxy at z ∼ 10 (Bouwens et al. 2011a; Oesch et al. 2012). As with the original data release, despite disagreement over certain individual sources (see, for example, the careful cross-checking performed by McLure et al. 2011) there is generally good agreement over the z ∼ 7 and z ∼ 8 galaxy samples, especially if attention is restricted to the brighter objects. However, where the data have been pushed to the limit, potential contamination by low-redshift interlopers becomes more of an issue (see below), and in particular there is some debate over the robustness of the z ∼ 10 galaxy. This discovery relies on detection in a single band (H160) because the proposed Lyman-break lies at the long-wavelength edge of the J125 filter. Therefore, while there is little doubt that this is a real object, there is currently no direct observational evidence that it displays a blue slope longward of the break. As illustrated in Fig. 6, to push LBG selection beyond z ≃ 8 really requires still deeper imaging, and the additional use of the J140 filter (to provide two detections of the galaxy ultraviolet continuum above the Lyman-break at z ∼ 9). Such a program has now been approved in the HUDF, and is planned with HST WFC3/IR in summer 2012.
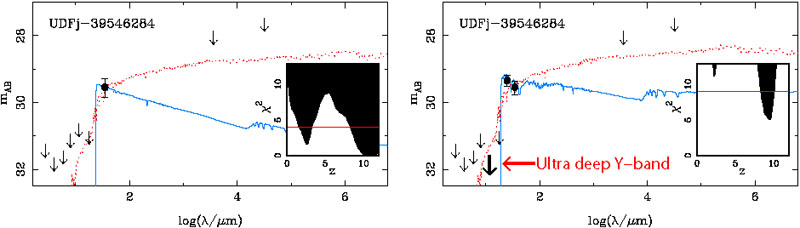 |
Figure 6. Recovering a reliable galaxy population at z ≃ 9-10 requires ultra-deep exposures across the Lyman-break and a strategically-chosen deployment of at least two WFC3/IR filters for source detection. (Left): The marginal nature of the z≃ 10 candidate claimed by Bouwens et al. (2011a) based on a sole H160 detection. In addition to a possible high z SED (blue line), an acceptable solution also exists at z≃ 2 (red dotted line). The inset shows χ2 as a function of redshift. Possible `flux-boosting' at H160 is an additional concern. (Right): Deeper Y105 imaging (as planned in 2012), coupled with the security of two detections (J140 & H160) above the Lyman break, should allow secure identification of this source and the elimination the low-z solution if this galaxy really does lie at extreme redshifts z > 9 (simulated J140 photometry was here inserted assuming ztrue ≃ 9.5). The planned ultra-deep WFC3/IR UDF12 imaging of the HUDF in HST Cycle 19 may detect up to ≃ 20 sources beyond z ≃ 8.5 to H160 = 29.5. |
In addition to this ground-breaking ultra-deep near-infrared imaging, wider field surveys with WFC3/IR are now underway. In particular Trenti et al. (2011, 2012) and Yan et al. (2011) have recently used parallel WFC3/IR imaging to search for "brighter" Y-drop z ∼ 8 LBGs, yielding several candidates which are potentially bright enough to be amenable to spectroscopic folow-up with ground-based near-infrared spectrographs. The 3-year, 902-orbit, Cosmic Assembly Near-infrared Deep Extragalactic Survey (CANDELS) Treasury Program has also recently commenced (Grogin et al. 2011; Koekemoer et al. 2011) 1. This will ultimately deliver WFC3/IR imaging (with parallel ACS optical imaging) to mAB ∼ 27 over ≃ 0.25 deg2 spread over 5 different well-studied fields, including deeper survey regions reaching mAB ∼ 28 over ≃ 0.04 deg2 (split between GOODS-North and GOODS-South). This survey is expected to provide the area and depth required to enormously clarify our understanding of the prevalence and properties of moderate luminosity (L*) galaxies at z ≃ 6.5 - 8.5.
Finally, progress is also expected from WFC3/IR imaging of lensing clusters. Imaging of the Bullet Cluster has already yielded several z ≃ 7 LBG candidates (Hall et al. 2012) and a second major (524 orbit) HST multi-cycle Treasury Program, the Cluster Lensing and Supernova Survey with Hubble (CLASH) 2, will deliver multi-band WFC3 imaging of 25 clusters over the next 3 years (Postman et al. 2012).
These rapidly-growing samples of WFC3/IR-selected LBGs at z > 6.5 are providing a wealth of new information on galaxies and their evolution in the first billion years, not least because many of the the brighter ones have also proved to be detectable at 3.6 µm with Spitzer IRAC. As a result, even without spectroscopic redshifts, it has already been possible not only to obtain the first meaningful measurements of the galaxy luminosity function at z ∼ 7 and z ∼ 8 (see section 4) but also to explore the physical properties of these young galaxies (i.e. masses, stellar populations, sizes; see section 5).
Nevertheless, spectroscopic follow-up is being vigorously pursued (e.g. Schenker et al. 2012). It is to be hoped that the new, wider area WFC3/IR surveys yield more bright z ∼ 7 - 8 LBGs which are amenable to spectroscopic follow-up, as effective ground-based near-infrared spectroscopy of the most distant galaxies revealed via the HUDF09 imaging at mAB ≃ 28.5 has, unsurprisingly, proved extremely challenging. In particular, while Lehnert et al. (2010) reported a spectroscopic redshift z ≃ 8.55 for the most distant credible HUDF LBG discovered by McLure et al. (2010) and Bouwens et al. (2010b), this observation took 15 hours of integration with the near-infrared spectrograph SINFONI on the VLT, and the claimed marginal detection of Lyman-α has not been confirmed by independent follow-up spectroscopy (Bunker et al., in prep). Indeed, as discussed further below, follow-up spectroscopy of even the brighter z ≃ 7 LBG candidates selected from ground-based surveys has, to date, not been particularly productive, for reasons that are still a matter of some debate (see section 4.3). But it must be noted that the current lack of spectroscopic redshifts should not be taken as implying that most of the z ≃ 7 and z ≃ 8 are not robust, as given sufficiently deep photometry all potential contaminants can be excluded, and a redshift estimated accurate to δ z ≃ ± 0.1. In fact, it may well be the case that, by z ≃ 7, many galaxies do not produce measurable Lyman-α emission, and much of the current ongoing spectroscopic effort is really directed at trying to better quantify the evolution of Lyman-α emission from LBGs, a measurement which has the potential to shed light on the physics of reionization (see sections 4.3 and 6.2).
From the ground, LBG selection has now been pursued with some success right up to (but not significantly beyond) z ≃ 7, due to the advent of deep Y-band imaging on both Subaru/Suprime-Cam (Ouchi et al. 2009b) and Hawk-I on the VLT (Castellano et al. 2010a, b). From the deep Y-band and z'-band imaging of both the Subaru Deep Field (SDF) and GOODS-North, Ouchi et al. (2009) reported 22 z'-drops to a depth of y = 25.5-26 over a combined area of ≃ 0.4 deg2, but the lack of comparably-deep near-infrared data at longer wavelengths forced them to make major corrections (by about a factor ≃ 2) for contamination. Nevertheless, three of these LBGs now have spectroscopically-confirmed redshifts at z ∼ 7 based on Lyman-α emission-line detections with the DEIMOS spectrograph on the Keck telescope (Ono et al. 2012). The VLT Hawk-I imaging undertaken by Castellano et al. (2010a, b) covered a smaller area (≃ 200 arcmin2), but to somewhat deeper depths, and has yielded ≃ 20 z-drops to Y ≃ 26.5. Spectroscopic follow-up of this sample with FORS2 on the VLT has now provided five Lyman-α spectroscopic redshifts in the range 6.7 < z < 7.1 (Fontana et al. 2010; Vanzella et al. 2011; Pentericci et al. 2011).
Given the current concerns over the validity of the Lehnert et al. (2010) redshift, at the time of writing the robust spectroscopic redshift record for an LBG (or indeed any galaxy or quasar) stands at z = 7.213 (Ono et al. 2012). Further spectroscopic follow-up at z ≃ 7 is, of course, in progress, but wide-area ground-based exploration of the bright end of the LBG luminosity function at even higher redshifts must await deeper Y, J, H, K-band imaging (now underway with UltraVISTA; see section 7).
3.1.3. Contaminants and controversies
Spectroscopic follow-up (or improved multi-frequency photometry) of LBG samples has revealed, not unexpectedly, that three different types of interloper can contaminate samples of LBGs at z > 5.
The first class of contaminant comprises very red dusty galaxies, or AGN, at lower redshifts. Such objects can produce a rapid drop in flux density over a relatively short wavelength range, which can sometimes be so severe as to be mistaken for a Lyman-break, especially if the two filters designed to straddle the break are actually not immediately adjacent in wavelength (e.g. z' and J). Because such red dusty objects do not rapidly turn over to produce very blue colours at longer wavelengths, LBG sample contamination by such objects is not too serious an issue provided i) a sufficently strong Lyman-break criterion is enforced (unfortunately not always the case), ii) sufficiently deep multi-band imaging is available at longer wavelengths to properly establish the longer wavelength SED slope, and iii) LBG selection is confined to young, unreddened, reasonably-blue galaxies. However, if, as attempted by Mobasher et al. (2005), one seeks to select more evolved objects without very blue slopes longward of the proposed Lyman-break, then things can become difficult. As shown by Dunlop et al. (2007), very dusty objects at z ≃ 1.5 - 2.5 can easily be mistaken for evolved, high-mass LBGs at z ≃ 5-6, and templates with reddening as extreme as AV > 6 sometimes need to be considered to reveal the alternative low-redshift solution. Such reddening is extreme, but the point is that "dropout" selection specifically designed to find LBGs at z > 5 transpires to also be an excellent method for selecting the rare, most extremely-reddened objects in the field at the appropriate lower redshifts. As discussed by Dunlop et al. (2007), often Spitzer MIPS 24 µm detections can help to reveal low-redshift dust-enshrouded interlopers, but this experience illustrates how difficult it will be to robustly uncover any significantly-evolved or reddened galaxies at z > 5.
This confusion lies behind several dubious/erroneous claims of extreme-redshift galaxies in the literature. Examples include not only the supposed z ≃ 6 ultra-massive galaxy uncovered by Mobasher et al. (2005) in the HUDF, but also the claimed discovery of a bright z ≃ 9 galaxy reported by Henry et al. (2008) (subsequently retracted when deeper optical imaging revealed a significant detection in the i'-band; Henry et al. 2009). It is also the likely reason that most of the z > 6.5 galaxies tentatively uncovered by Hickey et al. (2010) from the VLT Hawk-I Y-band imaging of GOODS-South have proved to be false (in the light of the subsequent ERS+CANDELS WFC3/IR imaging of the field) and, as illustrated in Fig. 7, is part of the explanation (in combination with inadequate photometric error analysis) for recent claims of very bright z ≃ 7 galaxies in the COSMOS field (despite supposed "tentative" spectroscopic confirmation at z ≃ 7 for two objects; Capak et al. 2011b). Fortunately, continuity arguments indicate that this may become less of a problem when attempting to select LBGs at the highest redshifts and faintest magnitude limits, as the reddened lower-redshift interloper population seems to become (relatively) much less prevalent in this region of parameter space.
 |
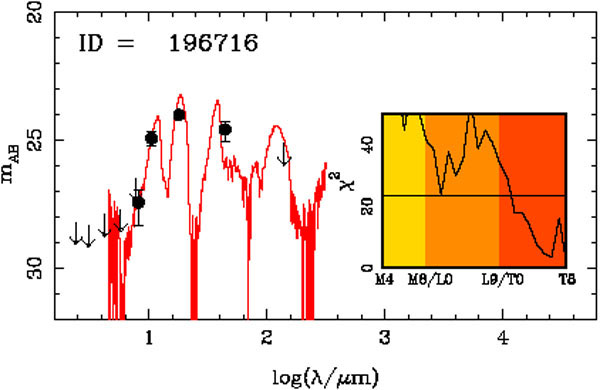 |
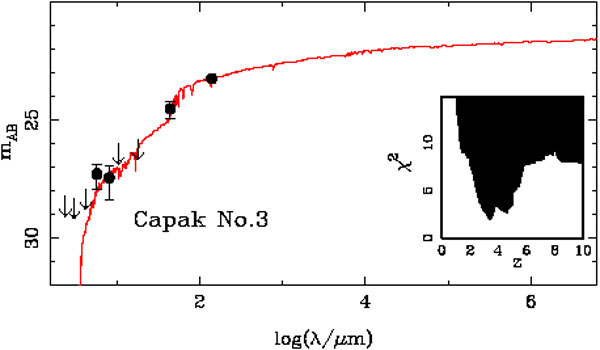
Figure 7. Examples of two different types of interlopers which can contaminate LBG samples, especially those selected at brighter magnitudes from ground-based imaging. The upper panel shows the best SED fit and χ2 versus z for a COSMOS galaxy claimed by Capak et al. (2011b) to meet the standard LBG selection criterion at z ≃ 7, and to be tentatively confirmed by near-infrared spectroscopy at z = 7.69. In fact, with the improved near-infrared photometry provided by the UltraVISTA survey it is clear that no acceptable redshift solution for this galaxy exists at z > 5 and that the original object selection was based on inadequate photometric error analysis (Bowler et al. 2012). The true best-fitting model solution corresponds to a moderately dusty galaxy at z ≃ 3.5. The lower panel shows another object selected from the UltraVISTA imaging in the COSMOS field which really does meet the standard z' - J:J - H colour criterion for a z = 7 galaxy, but which as shown here is in fact a T-dwarf galactic star. In this case the photometry (especially in the crucial Y-band) is of high enough quality that no acceptable solution could be found with a galaxy SED at any redshift, but this is not always the case. Fortunately, both these types of contaminant become (at least statistically) less of a problem for z ≃ 7 LBG surveys at fainter magnitudes, because the most dusty galaxies at z ≃ 2-4 tend to be high-mass objects, and because the number counts of cool dwarf stars fall (or at least certainly plateau) beyond J = 24 (Ryan et al. 2011) due to the scale-height of the galactic plane. |
The second class of contaminant comprises cool galactic stars, specifically M, L and (in the case of z ≃ 7 LBG selection) T dwarfs. This is a long-established problem in the colour-selection of high-redshift radio-quiet quasars which are unresolved in all but the very deepest images (Hewett et al. 2006). However, as discussed by many authors (e.g. McLure et al. 2006; Stanway et al. 2008a, b; Vanzella et al. 2009; Hickey et al. 2010) the compactness of high-redshift galaxies (see section 5.4) means that contamination by cool dwarf stars has also become an important issue in the search for high-redshift LBGs. The problem is most acute for ground-based surveys both because most z > 5 LBGs are unresolved with even good ground-based seeing, and because the brighter LBGs are so much rarer on the sky (McLure et al. 2009; Capak et al. 2011b) than the fainter more numerous population revealed by the deeper HST imaging.
The particular problem of T-dwarf contamination of z ≃ 7 LBG searches has arguably been under-estimated until very recently, in part because our knowledge of T dwarfs has evolved in tandem with LBG searches over the last decade (Knapp et al. 2004; Chiu et al. 2008; Burningham et al. 2010). Specifically, early z ≃ 7 LBG "dropout" criteria appear to have assumed that T dwarfs did not display colours redder than z-J ≃ 1.8 (e.g. Bouwens et al. 2004), but cooler dwarfs have since been found with z - J > 2.5 (e.g. Burningham et al. 2008, 2010; Delorme et al. 2008; Leggett et al. 2009; Lucas et al. 2010; Liu et al. 2011). For ground-based z ≃ 7 LBG searches, the key to excluding dwarf-star contamination lies in having sufficiently-accurate multi-band infrared photometry since, for example, T-dwarfs have redder Y-J colours (by ≃ 1 mag) than genuine z ≃ 7 LBGs (and different IRAC colours; Stanway et al. 2008a). This is a further argument in favour of multi-band SED fitting which, given Y, J, H, K and IRAC photometry can often reveal a stellar contaminant on the basis of failure to achieve an acceptable fit with any galaxy template (as shown in the lower panel of Fig. 7). Given the above-mentioned high level of spectroscopic completeness achieved by Curtis-Lake et al. (2012) and Jiang et al. (2011) (and the results of stacking analyses; McLure et al. 2006, 2009) it seems unlikely that the published ground-based z ≃ 6 LBG samples are seriously contaminated by dwarf stars, but the situation remains more confused for bright surveys at z ≃ 7.
Fortunately, due to the combination of image depth, small field-of-view, and high angular resolution, T-dwarf contamination of the z ≃ 7 LBG samples revealed by the new deep WFC3/IR imaging is expected to be extremely small. This is confirmed by considering that the typical absolute J-band (AB) magnitude of T-dwarf stars is J≃ 19 (Leggett et al. 2009). At the depths probed by the WFC3/IR imaging of the HUDF, a T-dwarf contaminant would thus have to be located at a distance of 0.5-1.0 kpc. Given this distance is 2 → 3 times the estimated galaxy thin disk scale-height of ≃ 300 pc (e.g. Reid & Majewski 1993; Pirzkal et al. 2009), it is clear that significant contamination is unlikely. This is not to suggest that dwarf stars cannot be found at such distances as, for example, Stanway et al. (2008a) report the discovery of M dwarfs out to distances of ≃ 10 kpc. However, the surface density is low, with the integrated surface density over all M-dwarf types contained within ≃ 1 kpc amounting to ≃ 0.07 arcmin-2. Extrapolating these results to T dwarfs is somewhat uncertain, but a comparable surface density for L and T-dwarf stars is supported by the search for such stars in deep fields undertaken by Ryan et al. (2005, 2011). The results of this work suggest that the 4.5-arcmin2 field-of-view of WFC3/IR data should contain ≤ 0.5 T-dwarf stars down to a magnitude limit of z850 = 29.
The final class of contaminant, as revealed by the lower-redshift secondary solutions in SED-based redshift estimation (McLure et al. 2010; Finkelstein et al. 2010) consists of fairly blue, ≃ 0.5 Gyr-old post-starburst galaxies which display a strong Balmer break. Given sufficient signal-to-noise there is really no room for confusion, as the Balmer break can never approach the strength of the anticipated Lyman-break at z > 5 (e.g. before it faded the z = 8.2 GRB displayed Y-J > 4). However, the SED-fits shown by McLure et al. (2010) demonstrate that, with inadequate photometric dynamic range, a Balmer break at z ≃ 2 can be mistaken for a Lyman-break at z ≃ 8. Fortunately the potential contaminants occupy a rather specific regime of parameter space (i.e. they must lie in a narrow redshift range, a narrow age range, be virtually dust-free, and have very low stellar masses to be confused with z ≃ 7-8 LBGs selected at the faintest magnitudes) and continuity arguments can be advanced that they are likely rare (e.g. Bouwens et al. 2011b), but the real lesson here is the importance of ensuring that any imaging shortward of any putative Lyman-break is sufficiently deep to exclude lower-redshift interlopers (not necessarily easy with the deepest WFC3/IR imaging, given the depth of the available complementary ACS optical imaging).
The intrinsic Lyman-α emission from young galaxies is expected to be strong, reaching large rest-frame equivalent widths EWrest ≃ 200 Å if driven by star formation (Charlot & Fall 1993). A star-formation rate of SFR = 1 M⊙ yr-1 corresponds to a Lyman-α luminosity of ≃ 1 × 1042 erg s-1 (Kennicutt 1998).
However, for many years, blank-field searches for Lyman-α emitters (LAEs) at even moderate redshifts were disappointingly unsuccessful (e.g. Koo & Kron 1980; Pritchet & Hartwick 1990), raising fears that observable Lyman-α in high-redshift galaxies might be severely compromised by dust, because of the potentially long path lengths traversed by Lyman-α photons through the interstellar medium due to resonant scattering (Charlot & Fall 1991; 1993). However, as mentioned at the beginning of this Chapter, by the end of the 20th century a few z > 5 LAEs had been uncovered through the complementary techniques of long-slit spectroscopy (covering small areas but a broad redshift range) and narrow-band imaging (covering larger areas but a narrower redshift range). For a while these two techniques were competitive (Stern et al. 2000) but, with the advent of genuinely wide-field CCD imaging cameras on 8-m class telescopes, narrow-band searches for LAEs have surged ahead, and have proved spectacularly successful in uncovering large samples of galaxies at z > 5 (e.g. Ouchi et al. 2005, 2008).
Modern narrow-band imaging searches are sensitive to Lyman-α rest-frame equivalent widths down to EWrest ≃ 15 Å (helped at high redshift by the fact that EWobs = (1 + z) EWrest) and limiting line flux-densities f ≃ 5 × 10-18 erg s-1 cm-2. At z ≃ 7 this corresponds to a Lyman-α luminosity L ≃ 2.5 × 1042 erg s-1 which, in the absence of obscuration, is equivalent to a star-formation rate SFR ≃ 2 M⊙ yr-1. Thus, like the most sensitive LBG surveys at high redshifts, LAE selection can now detect galaxies at z ≃ 7 with a star-formation rate comparable to that of the Milky Way (e.g. Chomiuk & Povich 2011).
The basic technique involves comparing images taken through a narrow-band (100-200 Å wide) filter with a broad-band (or nearby narrow-band) image at comparable wavelengths. At very high redshifts, the efficiency of this approach is sensibly optimized by designing filters to image in low-background regions between the OH atmospheric emission lines which begin to plague substantial wavelength ranges beyond λobs ≃ 7000 Å. For this reason, samples of z > 5 LAEs are generally confined to pragmatically-selected redshift bands (Fig. 8).
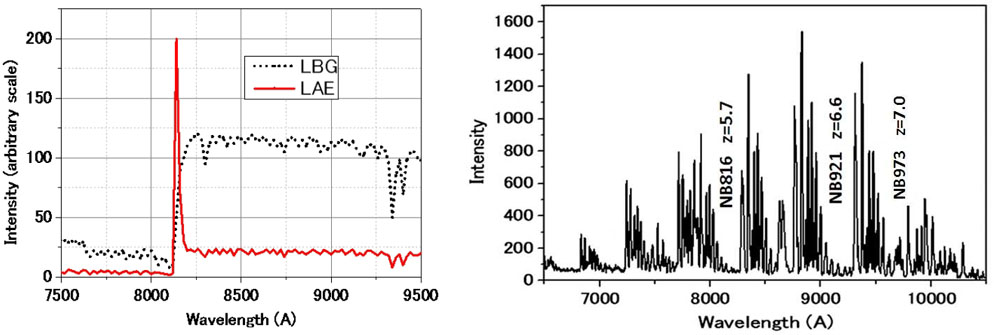 |
Figure 8. The selection of high-redshift galaxies via Lyman-α emission. The left-hand panel illustrates the typical spectrum of a Lyman-α emitter (solid line) compared with a Lyman-break galaxy (broken line) at an assumed redshift z = 5.7, showing the Lyman-α emission-line redshifted from λe = 1216 Å to λobs = 8150 Å and the stellar continuum long-ward of the Lyman-α emission line. The right-hand plot shows the OH night sky emission bands, highlighting the few gaps within which narrow-band filters can be most effectively targetted. The Subaru narrow-band filters whose transmission profiles are matched to these dark windows are used to detect LAEs at z = 5.7 (NB816), z = 6.6 (NB921) and z = 7.0 (NB973), as discussed in section 3.2.1 (courtesy M. Iye). |
Narrow-band searches for LAEs complement broad-band surveys for LBGs by probing a largely distinct region of parameter space. The weaknesses of narrow-band searches are that they probe smaller redshift ranges and hence smaller cosmological volumes (for a given survey area), and obviously can only uncover that fraction of the galaxy population which actually displays relatively bright Lyman-α emission. They are also subject to severe contamination by emission-line galaxies at lower-redshifts, which can only be sorted out via follow-up spectroscopy, or additional broad-band (or further tuned narrow-band) imaging (see subsection 3.2.2). On the other hand, narrow-band imaging is sensitive to objects with much fainter continua than can be detected in LBG surveys, delivers targets for follow-up spectroscopy which are at least already known to contain an emission line, and is extremely effective at uncovering large-scale structures where many objects lie within a relatively narrow redshift band (e.g. Capak et al. 2011a).
As with LBG selection, a detailed overview of LAE studies at z < 5 is beyond the scope of this Chapter, but a helpful overview of this "lower-redshift" work is provided by Ouchi et al. (2003), who first used narrow-band imaging through the NB711 filter on Subaru to uncover substantial numbers of LAEs at z ≃ 4.8. The successful use of Lyman-α selection at z > 5 is now described in detail below.
3.2.1. Lyman-α galaxies at z > 5
After passing the z = 5 threshold in 1998, the redshift record for LAEs rapidly advanced beyond z = 6.5 (Hu et al. 2002; Rhoads et al. 2003, 2004), and indeed LAEs were to provide the most distant known objects for the rest of the decade.
Since 2004, the discovery of LAEs at z > 5 has been largely driven by narrow-band imaging with the wide-field optical camera Suprime-Cam on the Subaru telescope, coupled with follow-up spectroscopy with the FOCAS spectrograph on Subaru, and the LRIS and DEIMOS spectrographs on Keck. A consortium of Subaru astronomers developed the required series of narrow-band filters at ever increasing wavelengths. As shown in Fig. 8, the band-passes of these filters are designed to fit within the most prominent dark gaps between the bands of strong telluric OH emission which come to increasingly-dominate the night-sky spectrum at λobs > 7000 Å.
A filter at 8160 Å (NB816) is able to target Lyman-α emission at z ≃ 5.7. This was used by Ouchi et al. (2005) to produce a very large sample of ≃ 500 z ≃ 5.7 LAEs from imaging of the Subaru XMM-Newton Deep Survey field (SXDS; Furusawa et al. 2008) and by Shimasaku et al. (2006) to produce another large and independent sample of z ≃ 5.7 LAEs from imaging of the Subaru Deep Field (SDF; Kashikawa et al. 2004). The NB816 filter was also used by Ajiki et al. (2006) to image both GOODS fields, and a fourth sample of NB816-selected LAEs was uncovered in the COSMOS field by Murayama et al. (2007).
Imaging of these survey fields through another, redder filter (NB921) led to the first substantial samples of potential LAEs at z ≃ 6.6 (Taniguchi et al. 2005; Kashikawa et al. 2006; Ouchi et al. 2010), and imaging of the SDF through the even redder NB973 filter yielded what remains to this day the most distant narrow-band selected galaxy. This LAE, IOK-1, was spectroscopically confirmed at z = 6.96 by Iye et al. (2006) and was, for four years, the most distant object known. The discovery image and spectrum of IOK-1 is shown in Fig. 9; the spectrum clearly shows the asymmetric emission-line profile which is characteristic of Lyman-α emission at extreme redshift (produced by neutral Hydrogen absorption of the blue wing of the emission line; Hu et al. 2010) and helps to enable single-line spectroscopic confirmation of narrow-band selected LAE candidates at these high redshifts (see below for potential contaminants).
 |
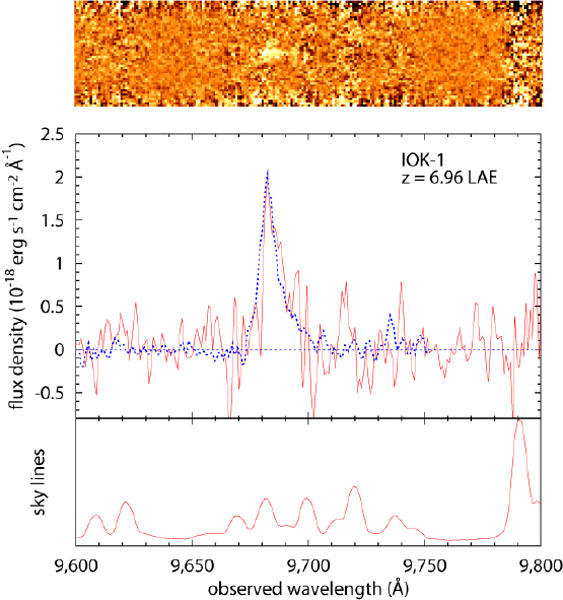 |
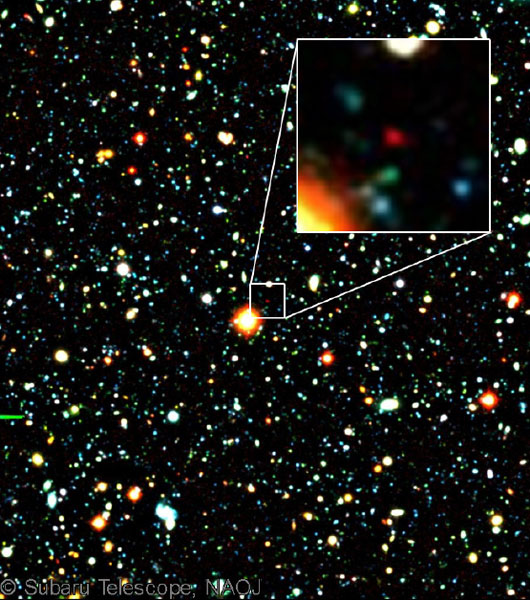
Figure 9. The most distant spectroscopically-confirmed LAE selected via narrow-band imaging, the galaxy IOK-1, is shown as a red blob in the colour postage-stamp insert image which covers 8 × 8 arcsec. The entire field of view shown in the larger image covers 254 × 284 arcsec (North is up and East to the left). The 2-dimensional and 1-dimensional Subaru FOCAS spectrum of IOK-1 is shown in the right-hand panels (Iye et al. 2006). The spectrum clearly shows an asymmetric Lyman-α emission line at a wavelength corresponding to a redshift z ≃ 6.96 (courtesy M. Iye). |
|
The NB973 filter has now been used on Subaru to provide a few more candidate LAEs at z ≃ 7 (Ota et al. 2008, 2010a). Most recently, following refurbishment of Suprime-Cam with new red-sensitive CCDs, the NB1006 filter has been installed to allow searches for LAEs at z ≃ 7.3 (Iye 2008).
Complementary deeper (but smaller-area) narrow-band searches for LAEs at z > 7 have recently been conducted on the VLT, but have not yet yielded any spectroscopically-confirmed candidates (Cuby et al., 2007; Clément et al. 2012). As discussed above in the context of the spectroscopic follow-up of the highest-redshift LBGs, there of course exists the interesting possibility that Lyman-α emission may not be so easily produced by many galaxies as we enter the epoch of reionization (see section 4.3.6). This issue may soon be clarified by further deeper narrow-band imaging searches in the near-infrared. Finally, it is probably fair to say that existing attempts to uncover extreme redshift LAEs up to z ≃ 10 via long-slit infrared spectroscopy targetted on the critical lines in strong-lensing clusters remain controversial (Stark et al. 2007b).
It must be emphasized that narrow-band selected LAE candidates at z > 5 need to be confirmed with spectroscopy because the vast majority of objects with a narrow-band excess will be contaminants. Many of these are genuine emission-line objects (galaxies or AGN) at lower redshifts, with the narrow-band excess being produced by, for example, CIV emission at 1549 Å, MgII at 2798 Å, [OII] at 3727 Å, [OIII] at 5007 Å, or H-α at 6563 Å. Isolation of genuine extreme-redshift LAEs is of course helped by the fact that, like LBGs, they should show essentially no emission at wavelengths shortward of λrest = 1216 Å. Thus, broad-band imaging at bluer wavelengths can be used to reject many low-redshift objects without recourse to spectroscopy. A second alternative to spectroscopy as a means to rule out at least some sub-samples of lower-redshift emission-line objects is observation through a second narrow-band filter at a wavelength specifically designed to pick up a second emission line (e.g. Sobral et al. 2012). However, this is rarely practical, and at least multi-object spectroscopy is reasonably efficient when targetting a subset of objects which are already known to likely display detectable emission lines.
Another potential source of LAE sample contamination is transient objects (e.g. variable AGN or supernovae) because often the narrow-band image is compared with a broad-band image which was taken one or two years earlier. Finally, the sheer size of the images means that rare, apparently significant (5-σ) noise peaks can occur in a single narrow-band image, and these need to be excluded by either repeated imaging or spectroscopy (this is the same single-band statistical detection problem which can afflict searches for extreme-redshift LBGs in the longest-wavelength broad-band filter; Bouwens et al. 2011a).
1 http://candels.ucolick.org Back.
2 http://www.stsci.edu/~postman/CLASH Back.