


While most DSFGs at high-z are either galaxies that appear to be in relative isolation, or an ongoing galaxy merger, a number of observations over the last five years have identified some of the most luminous DSFGs at high-z as lying in potential proto-clusters of galaxies. It should be noted that the galaxies that have been identified as being potential proto-cluster members are rare - the average DSFG is not found in these environments. The DSFGs that are described in this subsection are of order the most luminous DSFGs known, and comparable to the most luminous galaxies known in the Universe.
The first DSFG to be identified as part of a proto-cluster environment was LAB1 at z = 3.09 (Chapman et al., 2001) where the luminous 850 µm-detected SMG has diffuse Ly-α emission at a redshift with a known over-density of optical/UV-selected galaxies at z = 3.07 - 3.11; the submillimeter map around the proto-cluster revealed a higher density of submm sources than in a blank-field, which led to the first studies of DSFGs' environments.
In 2009, the clustering properties of SMGs were analyzed in more detail by Chapman et al. (2009) who discovered a z ~ 1.99 over-density of SMGs in GOODS-N. The over-density of six SMGs and two SFRGs (so eight DSFGs in total) overlaps with an over-density of 22 optically-selected BX/BM galaxies. By comparing the stellar masses and star formation rates of both optically-selected galaxies within and outside of the over-density, Chapman et al. arrive at the conclusion that the over-density's environment is no more substantially evolved than the field. The inferred halo mass of the cluster is relatively low, so the active episode of star formation and implied high merger fraction is unexpected according to simulations.
Another prominent 850 µm-selected SMG thought to be in a proto-cluster was GN20, discovered in the GOODS North (hence the “GN” in GN20) field (Pope et al., 2005). Serendipitously, Daddi et al. (2009) discovered CO emission lines from the system, and placed the redshift of the SMGs at z ~ 4 (the physical characterization of GN20 itself was discussed in § 6.3). The brightest galaxies in the area are GN20 with S850 = 20.3 mJy at z = 4.055 (potentially the brightest unlensed SMG known to date), and GN20.2a and b with a total flux density of S850 = 9.9 mJy and at z = 4.051. The concentration also contains a fourth fainter SMG at a few arcminutes away and at z = 4.0424. Along with these SMGs, numerous Lyman break galaxies reside within 25″ of GN20 (distance separation of 170 kpc), corresponding to an over-density of ~ 6σ (Daddi et al., 2009) (Fig. 32). The total estimated mass of the proto-cluster is around ~ 1014 M⊙. While such a mass is consistent with present-day galaxy groups or a low-mass galaxy cluster, at z ~ 4, such a mass corresponds to one of the highest density peaks. The evolutionary path of such a high mass halo at z ~ 4 is such that it will easily evolve to a massive cluster today with a total mass in excess of ~ 5 × 10¹⁵ M⊙. Thus the DSFGs seen in GN20 are likely the galaxies that will evolve in to brightest cluster galaxies (BCGs).
Capak et al. (2011) examined the COSMOS data set, and found four galaxies at z ~ 5.3, all centered around an extreme starburst originally detected with the AzTEC camera at 1.1 mm, COSMOS AzTEC-3 (Younger et al., 2007). The system has an inferred star formation rate of ~ 1500 M⊙ yr-1, and within 2 Mpc of the starburst, there are 11 objects with luminosities greater than L*. A similar over-density of galaxies has been seen to be associated with the z = 5.2 Scuba SMG, HDF850.1 (Walter et al., 2012). Finding multiple SMGs undergoing a concurrent starburst, such as GN20, is likely to be rare. It will be interesting to see in the near future if currently known highest redshift SMG, HFLS3 (Riechers et al., 2013b), is associated with a proto-cluster or not.
Moving down in redshift to the peak epochs of the SMG redshift distribution at z ~ 2.5, Ivison et al. (2013) exploited the relationship between L′CO and the CO line width to search for luminous galaxy mergers. L′CO and CO line widths are correlated for unlensed galaxies (Bothwell et al., 2013a), while lensed galaxies show a clear departure from this relation with a flat trend (Harris et al., 2012) (Fig. 37). Searching for for the brightest galaxies in the H-ATLAS survey that falls on the unlensed portion of the L′CO-CO FWHM relationship, Ivison et al. (2013) found a group of four intrinsically luminous galaxies at z~ 2.5 across a ~ 100 kpc region. A suite of panchromatic data showed that these galaxies are extremely molecular gas rich and have star formation rates between ~ 600 - 3500 M⊙ yr-1, for the individual components.
 |
Figure 37. L′CO vs FWHM for CO(1-0) of lensed and unlensed SMGs. The two red stars show the measurements of the two components of HXMM01 The big blue squares with error bars are unlensed and lensing-corrected SMGs with CO(1-0) measurements (Riechers et al., 2011c, Ivison et al., 2011, Harris et al., 2010, Carilli et al., 2010) and the small blue squares are mostly SMGs with higher-J CO line measurements converted to CO(1-0) using the mean observed ratios (Bothwell et al., 2013a, Carilli & Walter, 2013). The red line shows the best-fit relation for unlensed SMGs from Bothwell et al. (2013a), see also Harris et al. (2012). The grey filled circles with error bars are the GBT CO(1-0) measurements of the brightest lensed SMGs in the H-ATLAS survey (Harris et al., 2012). |
Similarly, Fu et al. (2013) identified HXMM01 from HerMES as an extremely bright SMG at z ~ 2.3 that resolves into two sources separated by ~ 3″ (roughly 25 kpc). The total flux density is roughly S870 ~ 20 mJy, and each individual galaxy qualifies as an SMG. The individual stellar masses from the system are each > 1011 M⊙ , while the galaxy is among the brightest CO emitters known to date. The baryonic gas fraction of the galaxy is ~ 50%, even after accounting for CO-H2 conversion factor issues (c.f. § 8.6), making this one of the most gas rich systems at these masses found to date.
The clustering of galaxies at high-redshift provides a valuable constraint on their dark matter halo masses and their occupation number, especially in the context of the halo model for large-scale structure galaxy distribution (Cooray & Sheth, 2002). The halo mass scale of DSFGs is helpful to understand the mass scale at which starbursts are frequently found and can be compared to theoretical and numerical predictions related to efficient gas-cooling in dark matter halos (Dekel et al., 2009a, b, Behroozi et al., 2013). The occupation number of DSFGs is useful to establish the satellite fraction of galaxies in the halos that host starbursts. In return the occupation number can provide information related to galaxy merging and concurrent starbursts in dark matter halos. With halo mass and occupation number in hand, one can also infer connections between seemingly different populations of galaxies at high-z, as well as provide strong constraints on the theory of dusty galaxy formation (as discussed in § 10). In recent years the simple halo model has been improved with conditional luminosity functions (De Bernardis & Cooray, 2012, Viero et al., 2012, Shang et al., 2012, Xia et al., 2012) and with functions that take into account the mass-dependent duty cycle of DSFGs and the radius-dependent efficiency for halos to convert accreted baryons into stars in dark matter halos (Béthermin et al., 2013). In this subsection, we review the results from clustering measurements of different populations of dusty galaxies.
The traditional approach in clustering studies is to measure the correlation length of a population of galaxies and compare it to cosmological structure formation simulations in order to infer the halo mass of the observed galaxies. Blain et al. (2004b) provided the first measure of the clustering length of 850 µm submillimeter galaxies with S850 > 5 mJy, and provided the first evidence that SMGs reside in extremely large halo masses, with masses ~ 1013 M⊙ (with relatively large error bars). The measured clustering length from the Blain et al. (2004b) study was ~ 6.9 ± 2.1 h-1 Mpc. While the uncertainty was large, this initial measurement provided critical information that SMGs resided in the extreme tail of the halo mass function, and constrained dusty galaxy formation scenarios accordingly. Weiss et al. (2009b) performed an 870 µm survey of the Extended Chandra Deep Field South (ECDFS) with the LABOCA camera on the APEX telescope, and found a spatial correlation length of ~ 13 ± 6 h-1 Mpc. While selected at a slightly longer wavelength (1.1 mm), Williams et al. (2011) presented a clustering measurement of AzTEC sources in the COSMOS field, and provided one of the first statistically significant measurements of SMGs at high-z. Williams et al. (2011) find upper limits on the correlation length of ~ 6 - 8 h-1 Mpc for 1.1 mm sources with S1.1 ~ 3.7 mJy (Fig. 38), which translates roughly to the 850 µm selection thresholds of the earlier works.
 |
Figure 38. Clustering measurements of DSFGs at a variety of far-IR/submm wavelengths. Clockwise from top-left, we show the clustering measurements reported in the recent literature at 24 µm (Magliocchetti et al., 2007) from Spitzer/MIPS, 250 µm (Cooray et al., 2010) with Herschel/SPIRE, 870 µm in terms of a cross-correlation with an overlapping lyman-break galaxy distribution in ECDFS (Hickox et al., 2012) with LABOCA, and at 1.1 mm (Williams et al., 2011) with AzTEC on ASTE. The figure panels are reproduced with permission from the authors of each of the above references and AAS. |
To date, the tightest constraint on the clustering amplitude of SMGs has been performed by Hickox et al. (2012), who re-analyzed the Weiss et al. (2009a) LABOCA surey of the ECDFS, though added new redshift constraints (Wardlow et al., 2011), as well as the clustering analysis methodology of Myers et al. (2009). In this approach, instead of a direct auto-correlation of the DSFG detected at 870 µm, which has a low signal-to-noise ratio due to overall low source counts in even deep ground-based fields such as ECDFS in the LESS survey (Weiss et al., 2009b), the authors pursue a cross-correlation of the 870 µm galaxies with optically-selected sample of galaxies in the same field with known redshifts and known clustering properties. By fixing the galaxy clustering properties, the authors can in return infer the clustering properties of the SMG sample. They infer an auto-correlation length of 7.7 ± 2.3 h-1 Mpc at 870 µm and a characteristic halo mass of ~ 6 × 10¹² h-1 M⊙ for SMGs (Hickox et al., 2012). Based on the evolution of dark matter haloes derived from simulations, Hickox et al. (2012) show that the present-day descendants of these bright S870 ~ few mJy SMGs are typically massive elliptical galaxies equivalent to L ~ 2 to 3 L⋆ luminous-red galaxies studied in SDSS and are located in small to moderate-size galaxy groups with halo masses ~ 1013 M⊙ (Fig. 39).
 |
Figure 39. Auto-correlation length r0 of DSFGs compared to a variety of galaxy populations over the redshift interval 0 < z < 3. These include optically-selected SDSS QSOs at 0 < z < 3 (Myers et al., 2006, Ross et al., 2009) Lyman-break galaxies (Adelberger et al., 2005), MIPS 24 µm-selected star-forming galaxies at 0 < z < 1.4 (Gilli et al., 2007), GES and DEEP2 red and blue galaxies at 0.25 < z < 1 from the AGES (Hickox et al., 2009, Coil et al., 2008) SDSS-selected luminous red galaxies (LRGs) at 0 < z < 0.7 (Wake et al., 2008), and optically-selected galaxy clusters at 0.1 < z < 0.3 (Estrada et al., 2009). The figure also shows the r0 for low-redshift galaxies with r-band luminosities in the range 1.5 to 3.5 L⋆, derived from the luminosity dependence of clustering (Zehavi et al., 2011). Dotted lines show r0 versus redshift for dark matter haloes of different masses. The thick solid line shows the expected evolution in r0 for the halo mass estimated by Hickox et al. (2012) as the best-fit halo mass for S870 > few mJy SMGs at z = 2. This evolution suggests that the SMGs are likely to evolve into luminous elliptical galaxies in the local Universe. The figure is reproduced with permission from Hickox et al. (2012). |
Interestingly, Dust Obscured Galaxies (DOGs) selected for optical faintness and 24 µm flux density exhibit similar clustering amplitudes as SMGs, though the amplitude is of course flux dependent. Brodwin et al. (2008) found that DOGs selected above a 24 µm flux density S24 > 0.3 mJy have r0 = 7.4 h-1 Mpc, quite similar to the Hickox et al. (2012) autocorrelation length of SMGs of r0 = 7.7 h-1 Mpc. The inferred halo masses for luminous SMGs and DOGs are not terribly dissimilar from constraints on optically-selected quasars (Croom et al., 2005, White et al., 2012).
Similarly, Cooray et al. (2010) utilized data from the HerMES survey to find that galaxies selected at 250 µm above 30 mJy have halo masses in the same range as observed SMGs (~ 5 ± 4 × 10¹² M⊙ ) with data from the Lockman-SWIRE field with close to 104 250 µm galaxies. Cooray et al. (2010) also showed the excess clustering at arcminute angular scales, resulting from the 1-halo clustering term. This non-linear clustering, under the halo model ansatz, can be described as due to the correlation of multiple DSFGs in dark matter halos. The halo model fits to the clustering (Fig. 38) shows that roughly (14 ± 8)% of DSFGs with S250 > 30 mJy appear as satellites in more massive halos than ~ 1012 M⊙ . We note that slightly different results related to galaxy clustering at Spire wavelengths is reported in Maddox et al. (2010). At low-redshifts with z < 0.5, the clustering of DSFGs are similar to blue, star-forming galaxies with a correlation length ~ 4.6 ± 0.5 Mpc (van Kampen et al., 2012, Guo et al., 2011) and are less-clustered than the dark matter distribution with a linear bias factor less than one (b = 0.7 ± 0.1).
7.3. Clustering of Faint, Unresolved DSFGs through the CIB Anisotropy Power Spectrum
While the spatial distribution of individually detected galaxy counts provides information on the DSFG clustering of resolved sources, maps at far-IR/submm wavelengths can also be used to probe the clustering properties of the unresolved, fainter galaxy population. This is similar in spirit to P(D) statistics that probe the faint source counts below the detection level by studying the histogram of the pixel counts associated with confusion noise.
In the case of clustering, information related to the spatial distribution of the fainter sources below the confusion noise comes from clustering studies related to the unresolved fluctuations. In particular, the angular power spectrum of the confusion noise, or the cosmic infrared background (CIB), captures the underlying spatial distribution of the fainter sources. While the fainter galaxies are individually undetected, due to gravitational growth and evolution in the large-scale structure these galaxies are expected to be clustered (Cooray et al., 2010, Hickox et al., 2012). In the ansatz of the halo model (Cooray & Sheth, 2002) the faint galaxy clustering captures the statistics on how they occupy the dark matter halos in the universe. The resulting anisotropies of the CIB are then a reflection of the spatial clustering of dark matter halos that are hosted by faint DSFGs and the total CIB intensity produced by those galaxies. In practice, these CIB anisotropies, are best studied with the angular power spectrum of the background pixel intensity with or without an accounting of the bright sources that are individually detected in the maps.
Early attempts to measure the angular power spectrum of the CIB resulted in low signal-to-noise ratio measurements at 160 µm with Spitzer/MIPS (Lagache et al., 2007) and at 250, 350 and 500 µm with BLAST (Viero et al., 2009). The wide area maps with Herschel-Spire have allowed CIB power spectrum studies to be extended to larger angular scales with improved signal-to-noise ratio measurements, while Planck/HFI have allowed these power spectrum studies to be extended to longer mm-wave wavelengths probing clustering of the CIB component arising from highest redshifts. The first clear detection of the CIB power spectrum over the angular scales between 30 arcseconds and 30 arcminute was reported in Amblard et al. (2011). Since then, additional measurements of the CIB power spectrum have come from Planck (Planck Collaboration et al., 2013b) and with additional Spire maps from HerMES (Viero et al., 2012) and Herschel-ATLAS (Thacker et al., 2013) (see Figure 40).
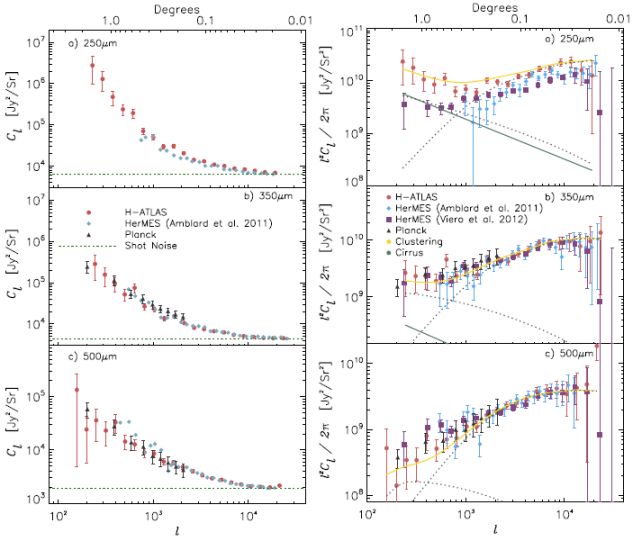 |
Figure 40. Angular power spectra of the CIB at 250 µm (top), 350 µm (middle) and 500 µm (bottom). In the left panels, the power spectra are plotted as Cl prior to the removal of the shot-noise term. In the right panels we show the power spectra as l2 Cl / 2π after removing the shot-noise level at each of the wave bands. The curves on the right panels show the halo models for CIB power spectrum separated into 1-halo, 2-halo, and the total signal. The solid line that scales roughly as l2 Cl ~ l - 0.9 is the best-fit Galactic cirrus fluctuation power spectrum. It is higher at 250 µm relative to the amplitude at 500 µm due to colder dust temperature of the Galactic ISM. The plotted measurements are from Herschel-ATLAS (Thacker et al., 2013), HerMES (Amblard et al., 2011, Viero et al., 2012, 2013a), and Planck (Planck Collaboration et al., 2013b), with latter including the most recent flux calibration of the Planck/HFI channels. Within the statistical errors, these power spectra measured over multiple fields and with two different instruments agree with each other. The figure also highlights the difference between Herschel-Spire resolution at 18 to 36 arcseconds vs. Planck/HFI resolution at 4.5 arcminutes and above: Spire spectra are able to probe more accurately the 1-halo term of CIB power spectra. This figure is reproduced from Thacker et al. (2013) with permission from the authors and AAS. |
With HerMES data, Viero et al. (2012) have also presented the cross-correlations between Spire wavelengths, providing additional information on the faint source spatial and redshift distributions. At wavelengths corresponding to Herschel-Spire, the CIB power spectrum at degree angular scales, especially at 250 µm, is contaminated by the Galactic cirrus. The spatial resolution of Spire, say relative to Planck/HFI, is such that one can probe the clustered fluctuations down to 30 arcsecond angular scales. At those small non-linear scales, the clustering power spectrum is dominated by the 1-halo term associated with correlations between bright central galaxies and fainter star-forming galaxies that appear as satellites in the same dark matter halos. The halo model interpretation of the first measurements of the HerMES spectra suggest that the halo mass scale for peak star-formation activity is logMpeak / M⊙ ~ 13.9 ± 0.6 and the minimum halo mass to host dusty galaxies is logMmin / M⊙ ~ 10.8 ± 0.6 (Amblard et al. 2011). These were based on earlier predictions related to the expected Herschel and Planck CIB fluctuations (Amblard & Cooray 2007). Recent modeling, involving conditional luminosity functions (Cooray, 2006), have now improved these early conclusions (De Bernardis & Cooray, 2012, Viero et al., 2012, Shang et al., 2012, Xia et al., 2012). The most recent models of CIB anisotropy spectra find that the effective mass scale DSFGs are at the level of logMeff / M⊙ ~ 12, consistent with the mass scale of dark matter halos where the star-formation efficiency is maximal (Viero et al., 2012, Planck Collaboration et al., 2013b).
Moving beyond statistics related to the faint DSFGs, the CIB angular power spectrum, in principle, captures the spatial distribution of the background intensity, regardless of whether the emission is from individual point sources or from smoothly varying diffuse sources, such as intra-cluster and intra-group dust. Thus the angular power spectrum is expected to be a sensitive probe of the total dust content in the Universe. The existing estimates of the dust abundance from direct emission measurements make use of the submm luminosity (Dunne et al., 2003) or dust mass (Dunne et al., 2011) functions. However, such functions are generally based out of extrapolations to fainter fluxes of the measured bright DSFG counts and the faint-end extrapolation could easily have a systematic bias. The CIB anisotropy power spectrum should capture the integrated emission from all DSFGs, including faint sources at the flux density scale that dominates the confusion noise. At shorter UV to optical wavelengths estimates of the cosmic dust abundance rely on the extinction of optical light, especially with measurements that combine magnification and extinction of quasars behind samples of foreground galaxies ( Ménard et al. 2010, Ménard & Fukugita 2012). The indirect dust abundance estimates from extinction at UV and optical wavelengths should in principle be consistent with direct dust abundance measurements in the far-infrared and submm wavelengths. In Thacker et al. (2013) this comparison was made by making use of the CIB anisotropy power spectrum as a way to estimate the total dust abundance responsible for CIB fluctuations, Ωdust(z), the cosmic abundance of dust relative to the critical cosmological density, as a function of redshift. Integrating over the dusty galaxy population responsible for the background anisotropies, Thacker et al. (2013) find Ωdust = 10-6 and 8 × 10⁻⁶ in the redshift range z ~ 0 - 3. This dust abundance is consistent with estimates of the dust content in the Universe using quasar reddening and magnification measurements in the SDSS (Fig. 41).
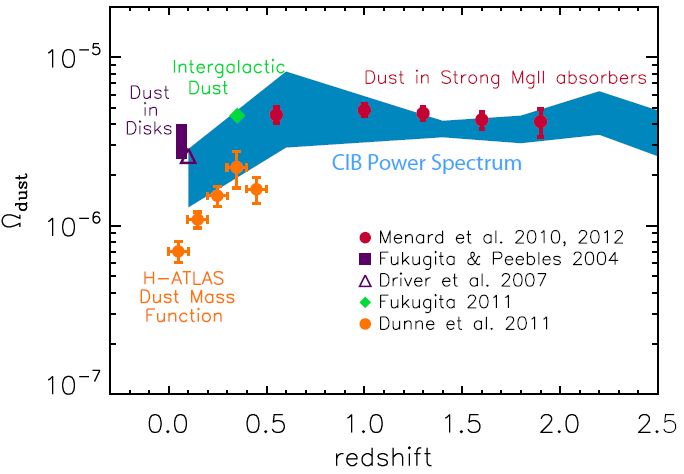 |
Figure 41. Cosmic abundance of dust, relative to cosmological critical density, Ωdust, against redshift as determined from the CIB power spectrum (Thacker et al., 2013) compared to measurements in the literature using the low-redshift dust mass function (Dunne et al., 2011), optical extinction of SDSS (Ménard et al., 2010, Ménard & Fukugita, 2012, Fukugita, 2011, Fukugita & Peebles, 2004) and 2DF (Driver et al., 2007) galaxies and quasars. This figure is reproduced from Thacker et al. (2013) with permission from the authors and AAS. |
7.4. Cosmic Magnification of Submm Sources
In addition to changes to the number counts, gravitational lensing of background sources by foreground large-scale structure also results in an angular cross-correlation between the background lensed source population and the foreground mass distribution. For a background population with steep number counts like DSFGs at far-IR and submm wavelengths, the resulting effect is such that near the foreground mass concentrations, where the magnification is expected to be high, there will be an overall density enhancement of DSFGs. Near low density environments, one does not expect to see an increase in the magnified DSFG counts. In terms of the large-scale structure spatial distribution this then results in a correlation between a tracer field of the foreground mass, such as foreground galaxies, and the background DSFGs. And this cross-correlation exists even if the tracer field in the foreground has no overlap in the redshift distribution with the background sources. To separate intrinsic clustering from this magnification effect, the magnification-induced cross-correlation is best measured with samples of foreground galaxies and background DSFGs that do not overlap in redshift. When combined with the number counts, such a cross-correlation study can provide constraints on cosmological parameters and galaxy bias, a key ingredient in galaxy formation and evolution models (Cooray & Sheth 2002, Jain 2002).
Previous attempts at measuring the lensing-induced cross-correlation between foreground optical galaxies and background submm sources resulted in statistically insignificant results. Almaini et al. (2005) measured the cross-correlation between 39 submm sources detected by SCUBA and optical sources at lower redshifts with a median of about 0.5 and found some marginal evidence for a cross-correlation due to magnification. This significance was further lowered in a similar study by Blake et al. (2006). Using DSFGs detected in the early Herschel-Spire data of HerMES (Wang et al. 2011b) found a statistically significant evidence for cosmic magnification over the angular scales of 1 to 50 arcminutes by cross-correlating DSFG samples selected to be at high redshift based on SPIRE colors against a sample of SDSS galaxies with known redshifts overlapping in the same sky area.
A separate study on cosmic magnification was presented by Hildebrandt et al. (2013). Here, instead of cross-correlating background Spire sources against foreground galaxies, the authors selected a sample of low-redshift DSFGs at 250 µm. They were cross-correlated against a sample of z ~ 3 - 5 LBGs. The resulting cross-correlation function was interpreted as due to cosmic magnification, i.e. lensing of LBGs by dark matter halos of low-redshift DSFGs, and dust extinction. They measure the typical dark matter halo mass of bright 250 µm-selected DSFGs to be about logMhalo / M⊙ = 13.2 ± 0.08 with a dust mass of about 6 × 10 - 5 × Mhalo in these dark matter halos. These measurements connect 250 µm-bright DSFGs at z ~ 0.5 to 1 to be hosted in massive group-sized dark matter halos instead of Milky-way or late-type like halos with total dark matter masses of around 1012 M⊙.
7.5. DSFGs as a tracer of the CMB lensing potential
Gravitational lensing of the cosmic microwave background (CMB) by large-scale structure dark matter distribution has now been detected with arcminute-scale CMB experiments, such as the South Pole Telescope (van Engelen et al., 2012) and the Atacama Cosmology Telescope (Das et al., 2013) and with Planck (Planck Collaboration et al., 2013c). With the background source at the last scattering surface at a redshift of 1100, CMB is mostly lensed by large-scale structure at redshifts of z ~ 2 - 3 (Cooray & Hu, 2000). The CIB and DSFGs that make up the background are ideal tracers of the CMB lensing potential, as was first proposed by Song et al. (2003). The cross-correlation between DSFGs and the mass map responsible for CMB lensing has now been detected with SPT (Holder et al., 2013), with a map of Herschel/SPIRE for DSFGs (Fig. 42), and separately with Planck, using Planck/HFI CIB maps (Planck Collaboration et al., 2013a). A cross-correlation of the Herschel/SPIRE map and SPT polarization maps has also been used to detect the arcminute-scale lensing signal in the CMB B-modes of polarization (Hanson et al., 2013).
 |
Figure 42. The South Pole Telescope (SPT) survey's lensing mass map of the CMB in its deepest 100 sq. degree area (top left) overlaid on DSFG/CIB maps from Herschel-Spire at 500 µm (top right), 350 µm (bottom left), and 250 µm (bottom right). The color scale shows the CIB intensity, with red/blue showing the increased/decreased galaxy intensity, while contours represent the CMB lensing mass map. The maps and overlays show a strong cross-correlation of the two even by eye. The figure is reproduced from Holder et al. (2013) with permission from the authors and AAS. |