


In this chapter we summarize properties of DSFGs as obtained from detailed individual galaxy studies. In this context, gravitational lensing has played a critical role because the spatial enhancement associated with magnification provides a way to investigate the internal structure of distant, faint galaxies to levels unattainable with the current generation of instrumentation for typical DSFGs. A second important fact here is that large samples of gravitationally lensed galaxies can be efficiently selected by searching for bright sources in wide area submillimeter surveys (Blain, 1996, Perrotta et al., 2002, Negrello et al., 2007, 2010, Hezaveh & Holder, 2011, Wardlow et al., 2013). While the early submm surveys were limited to smaller sky areas, the advent of wide-field surveys, especially with Herschel and SPT, at sub/millimeter wavelengths have allowed detections of large samples of lensed DSFGs that can be followed up with a host of radio and submm/mm-wave interferometers. Similarly, and pre-dating the large area survey work, important targets of lensed DSFGs have come from submm/mm-wave imaging of known massive lensing galaxy clusters (Smail et al. 1997).
The DSFG SMM J02399-0136, with S850 = 26 ± 3 mJy, was the first SCUBA SMG to be unambiguously identified with a optical/near-IR counterpart (Ivison et al., 1998). The SMG is located towards the massive galaxy cluster A370 leading to a lensing magnification factor of 2.5 (Ivison et al., 1998). The optical identification allowed the redshift of 2.80 to be determined with optical spectroscopy. This was later confirmed with the first detection of CO molecular gas in a SMG, CO(3-2) line in this case, leading to a molecular gas mass estimate of 8 × 10¹⁰ M⊙ (Frayer et al., 1998) extending over at least 25 kpc. The system is made up of at least three components within this large reservoir of gas. This includes a X-ray detected broad absorption line (BAL) quasar (Bautz et al., 2000, Genzel et al., 2003, Valiante et al., 2007), a dusty starburst galaxy coincident with an extended Ly-alpha cloud (Vernet & Cimatti, 2001), and a faint third component (Ivison et al., 2010c). The LIR ~ 3 × 10¹³ L⊙ resulted in a first detection of the [NII] 122 µm line from a galaxy at z > 2.5 (Ferkinhoff et al., 2010). In combination with the [OIII] 88 µm line intensity, Ferkinhoff et al. (2010) find that the [OIII]/[NII] line ratio of SMM J02399-0136 is consistent with a scenario where the dominant source for the line emission is HII regions ionized by massive O9.5 stars, especially in light of the fact that the detected AGN is no longer considered to be the dominant contributor the IR luminosity of this system (Ivison et al., 2010c). Detected free-free emission from the system implies an AGN contribution to IR luminosity of at most 35% (Thomson et al., 2012).
6.2. SMM J2135-0102: the Cosmic Eyelash
The DSFG SMM J2135-0102 (the “Cosmic Eyelash”) was serendipitously identified by Swinbank et al. (2010) in a LABOCA 870 µm observation of the galaxy cluster MACS J2135-010217 (z = 0.325) with a 870 µm flux density of 106 mJy. The redshift was identified to be z = 2.33 from CO line emission and lens models of the cluster mass distribution shows it to be magnified by a factor of 32; the fact that it is magnified by a cluster and not a galaxy means that differential extinction is not a substantial concern (Hezaveh et al., 2012, Serjeant, 2012). Once corrected for magnification, the source has an intrinsic luminosity consistent with a ULIRG at z ~ 2 with a SFR of around 200 M⊙ / year. The observed flux density at 500 µm of 325 mJy (Ivison et al., 2010d) puts this source among the brightest of all the lensed DSFGs discussed in the literature with Herschel-Spire (Negrello et al., 2010, Wardlow et al., 2013, Harris et al., 2012). Moreover, the high magnification of 32, compared to a magnification of about 10 for most lensed DSFGs found with Herschel (Bussmann et al., 2013, which are for galaxy-galaxy lenses, also more prone to differential lensing uncertainties), allows spatial resolution down to 100 parcsec scales within the galaxy. The lensing magnification resolves the individual giant molecular clouds (GMCs) in SMM J2135-0102, which were identified to be larger and more luminous than the GMCs of local star-forming galaxies by about a factor of 100 (Swinbank et al. 2010).
Ivison et al. (2010d) presented the Herschel-Spire FTS spectrum with a clear detection of the 158 µm [CII] line. The L[CII] / Lbol ratio was found to be significantly higher than in local ULIRGS, but consistent with the ratio of local star-forming galaxies. Combined with CO measurements, the photo-dissociation regions (PDRs) were found to have a characteristic gas density of 103 cm - 3 and a UV radiation field, G0, 1000 times stronger than that of the Milky Way. In combination, Ivison et al. (2010d) has suggested that the galaxy contains kpc-scale starburst clumps distributed over a large disk, different from nuclear starbursting local ULIRGS. Further PDR modeling using a combination of 12CO, [CI], and HCN line intensities are presented in Danielson et al. (2011).
Using IRAM/PdBI and VLA CO(6-5) and CO(1-0) high resolution imaging data, respectively, Swinbank et al. (2011) studied the kinematics of this galaxy as traced by the CO molecular gas. The CO velocity maps showed the galaxy to be rotationally-supported disk with a rotation speed of 320 ± 25 km s-1 and with a ratio of rotational-to-dispersion support of v / σ = 3.5 ± 0.2. The disk has a dynamical mass of (6.0 ± 0.5) × 1010 M⊙ within a radius of 2.5 kpc. The linewidth-size scaling relation based on the highest resolution CO data was found to be significantly offset from the local Larson scaling relation for molecular clouds (Fig. 31). Swinbank et al. (2011) argues that such a high offset is evidence for the importance of supersonic turbulence on scales 100 times smaller than in the kinematically quiescent interstellar medium of the Milky Way. Given the high external hydrostatic pressure of the ISM of this galaxy, with Ptot / kB ~ 2 × 10⁷ K cm-3, the subsonic star-forming regions of are expected to have densities in excess 17 of 108 cm-3.
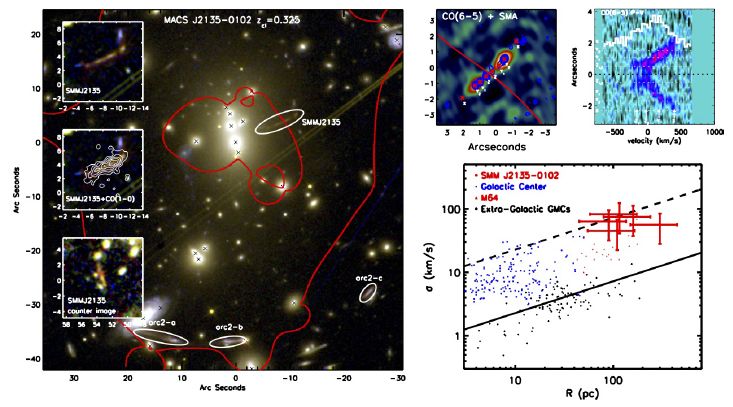 |
Figure 31. Left: HST image of the cluster MACS J2135-010217. The red line is the z = 2.3 critical curve. The insets show the images of the lensed DSFG SMM J2135-0102 and another triple-imaged galaxy at z = 2.3. The middle inset shows the CO1-0 map VLA. Right: The top two panels show the IRAM/PdBI CO(6-5) map with SMA 870 µm contours while the second panel shows the image-plane position-velocity diagram of the CO(6-5) line emission extracted along a position angle of 45 degrees east or north across the lensed galaxy in the long direction. The PV diagram shows a velocity gradient of 500 km s-1 across an angular extent of 6 arcseconds. The lower panel shows the scaling relation of velocity dispersion versus cloud radius. The local relation shown by the solid line (Larson 1981) is consistent with extragalactic GMCs in quiescent environments. The GMCs in gas-rich, high-turbulent-pressure environments, such as the Galactic Center, are systematically offset from this relation. The line width data for star-forming regions in SMM J2135-0102 are compatible with a higher normalization than the Milky Way. These figures are reproduced from Swinbank et al. (2011) with permission from the authors and AAS. |
The lensing flux density enhancement has also allowed studies, for the first time at high redshifts, of the spectral line energy distributions (SLEDs) of 13CO and C18O from J = 1 - 0 to J = 7 - 6 transitions of this galaxy (Danielson et al. (2013)). The 13CO emission from optically thin regions imply a total gas mass for the galaxy of ~ 1.5 × 10¹⁰ M⊙ and a conversion of CO to H2 mass αCO ~ 0.9, consistent with bright SMG-like DSFGs for a ULIRG system at z ~ 2. The velocity-integrated flux ratio 13CO / C18O ~ 1 implies an abundance ratio [13CO] / [C18O] that is at least a factor of seven below that of the Milky Way. The enhanced C18O abundance implies star-formation is preferentially biased to high-mass stars. The ISM is best-modeled with two phases: a cold phase at ~ 50K with a density of 103 cm-3 and a warm phase at 90K with density 104 cm-3. Further modeling suggests that the ISM heating contribution from cosmic-rays and UV is adequate to explain this warm phase at 90K. It has a cooling rate of (1-20) × 10-25 erg s-1 per H2 molecule from the CO SLED. The high temperature of 140 to 200K derived for the highest density regions of the warm phase implies that the cosmic ray heating is more important than UV heating where the star-formation is most active.
GN20 (Pope et al., 2005), whose redshift was serendipitously discovered by Daddi et al. (2009), is a bright SMG in a proto-cluster of multiple DSFGs. GN20 is the brightest SMG in the GOODS-N field with a 850 µm flux density of 20.3 mJy, suggesting a SFR at the level of 1800 M⊙ yr-1 (Fig. 32; the environment of this source is discussed in Section 7). The individual DSFG components have been well-studied over the last few years with a variety of interferometers. At high resolution with EVLA in CO(2-1) the gas in GN20 appears to be resolved into at least five star-forming molecular clumps of size around 1.3 kpc (limited by the beamsize of observations) with line widths of ~ 100 to 500 km s-1 (FWHM) and a mass surface densities in excess of 3000 M⊙ pc-2 (Hodge et al., 2012). The clumps are self-gravitating and they have CO-to-H2 conversion factors αCO with values between 0.2 and 0.7. The gas reservoir extends to a diameter of ~ 15 kpc and also shows clumpy structure. GN20 is a rotating disk with a maximum rotational velocity of 575 ± 100 m/s and a dispersion of 100 ± 30 km/s. The dynamical mass for GN20 is 5 ± 2 × 10¹¹ M⊙ (Hodge et al., 2012, Carilli et al., 2011) with gas a fraction at the level of 40% (though see § 8.6 for reasons why this may be an overestimate).
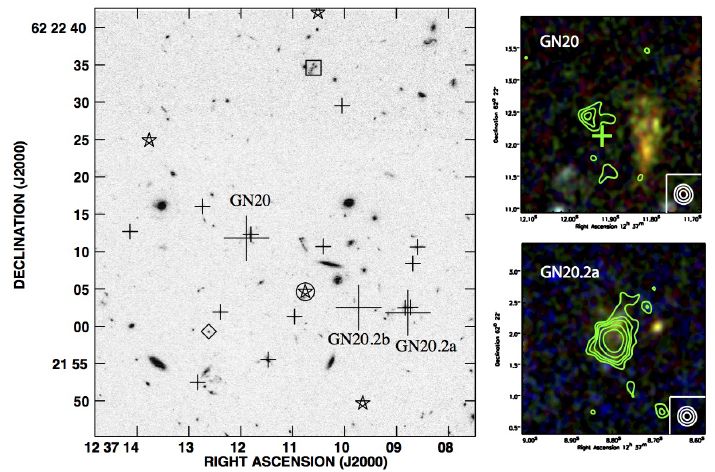 |
Figure 32. Left: HST/ACS F850W z-band image of the GN20 proto-cluster field. Large crosses mark the 1.4 GHz positions of the three known SMGs in the field. Small crosses mark the positions of the LBGs within 25 arcseconds of the SMG GN20. The stars mark the positions of the new CO emission line sources and the diamond marks the LBG with a possible detection in CO(2-1) as found by Hodge et al. (2013a). The circled star is the emission line candidate with an optical counterpart within one arcsecond. The figure is reproduced from Hodge et al. (2013a) with permission from the authors and AAS. Right: Combined MERLIN and VLA radio contours overlaid on HST/ACS color images of GN20 and GN20.2a. The field sizes are 3 × 3 arcseconds and the MERLIN beam size is 0.3 arcseconds. The levels of the radio contours are drawn at 3, 4, 5, 7, and 10 σ. The emission centroid for GN20 in the mid-IR (Spitzer IRAC/MIPS) is consistent with the radio and submm continuum position, while GN20 shows a statistically significant offset between submm and optical emission. GN 20.2b is undetected in the radio. These panels are reproduced with permission from Casey et al. (2009b). |
The 6.2 µm polycyclic aromatic hydrocarbon (PAH) line from GN20 was detected by Riechers et al. (2013a) using Spitzer/IRS. This remains the highest redshift SMG to which a PAH feature has been detected. SED modeling of the rest-frame 4 to 7 µm continuum emission shows the dominant contribution to the mid-IR flux density is from a faint, dust-obscured AGN. Using the scaling relation between 6 µm continuum and 2 to 10 keV X-ray luminosity, Riechers et al. (2013a) estimate a Eddington limit for the black hole mass of GN20 AGN to be 1.5-3 × 10⁸ M⊙ at the level of 0.03-0.06% of the dynamical mass of the galaxy, and consistent with the average ratio of 0.05% for AGN-dominated SMGs at z ~ 2 (Alexander et al., 2005a).
The second component GN20.2 is made up of two separate galaxies GN20.2a and GN20.2b with de-convolved sizes of ~ 5 × 3 kpc and ~ 8 × 5 kpc (Gaussian FWHM) in CO(2-1) imaging data with VLA, respectively (Hodge et al., 2013a). GN20.2a is radio bright (Pope et al., 2006, Casey et al., 2009b), while GN20.2b is not. GN20.2a has the largest gas surface density of all galaxies in the proto-cluster with a surface density estimated to be at the level of 13,000 M⊙ pc-2 for the most compact components of the galaxy in the highest resolution data. The gas surface density of GN20.2b is lower at 1700 M⊙ pc-2. The difference in the gas surface densities suggest that the two galaxies are two different stages of star-formation with the possibility that GN20.2a is fueled by a major merger to reach the high surface density observed.
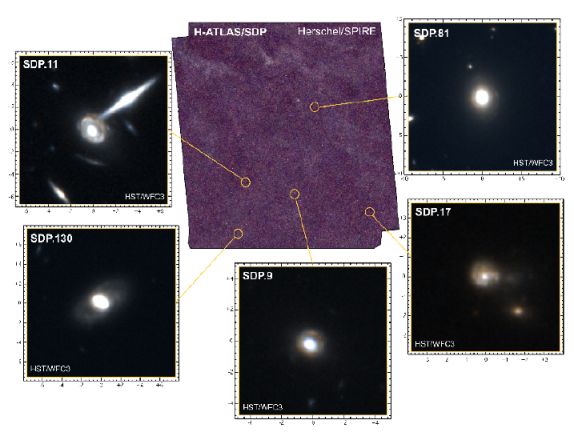 |
Figure 33. HST/WFC3 F110W and F160W images of the first five confirmed gravitationally lensed DSFGs from Herschel-Spire (Negrello et al., 2010). The center image shows the three-color 250 µm, 350 µm, and 500 µm Spire image of the H-ATLAS Science Demonstration Phase (SDP) field from which these lensed DSFGs were identified, simply based on their 500 µm flux density having values with S500 > 100 mJy. The figure is reproduced from Negrello et al. (2013) with permission from the authors and AAS. |
The wide area surveys with Herschel-Spire, especially H-ATLAS (Eales et al., 2010) and HerMES (Oliver et al., 2012), and the South Pole Telescope (Vieira et al., 2013) have now resulted in large samples of rare and bright lensed DSFGs. The selection is especially easy since the lensed sources are the brightest sources in the submm maps, and only basic spectral filtering for radio-bright blazars is needed to find the lensed DSFGs in millimeter maps. Negrello et al. (2010) demonstrated through multi-wavelength follow-up observations of the first five Herschel-selected DSFGs with S500 > 100 mJy at 500 µm, after accounting for nearby spiral galaxies and radio-bright blazars, are all gravitationally lensed (Fig. 34). However due to small sample size it was not possible to conclusively establish whether all of the extragalactic sources with S500 > 100 mJy are gravitationally lensed or whether there are intrinsically luminous, but possibly rare, DSFGs at such high flux densities. With 13 DSFGs with S500 > 100 mJy, Wardlow et al. (2013) addressed the same issue and found > 93% of the sample was confirmed to be gravitational lensed DSFGs implying < 7% of the sources would be intrinsically bright. At z > 1, the non-lensed sources would have luminosities with L > 1013 L⊙ (HyLIRGs). Detailed follow-up of such luminous sources are rare, but in the two Herschel-selected cases, one from HerMES in Wardlow et al. (2013) and another from Herschel-ATLAS in Harris et al. (2012), they have been both confirmed to be DSFG-DSFG (Fu et al., 2013) or multi-DSFG (Ivison et al., 2013) merger.
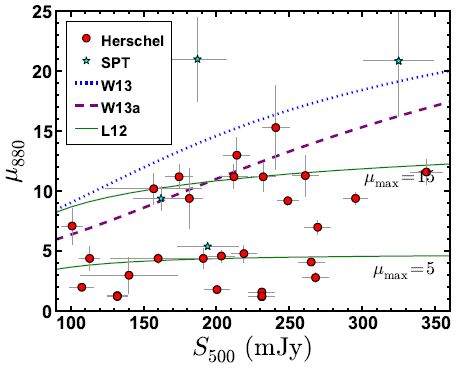 |
Figure 34. Magnification factors from lens modeling of high-resolution Submillimeter Array (SMA) imaging data of Herschel-selected DSFG samples with S500 > 100 mJy. The lines are various model predictions on the expected magnification as a function of the 500 µm flux density with 'W13' and 'W13a' predictions from Wardlow et al. (2013) and 'L13' from Lapi et al. (2011). The plot also shows magnification factors of two SPT-selected lensed DSFGs from Hezaveh et al. (2013). This figure is reproduced from Bussmann et al. (2013) with permission from the authors and AAS. |
With a surface density for S500 > 100 mJy lensed DSFGs at the level of 0.2 deg - 2 (Negrello et al., 2010, Wardlow et al., 2013, Bussmann et al., 2013), and with close to 1200 deg2 of Spire imaging data in the Herschel Science Archive, there should be close to 250 lensed DSFGs. To confirm if all of these are indeed lensed rather than intrinsically bright requires time-consuming multi-wavelength follow-up programs. In addition to high resolution interferometric imaging, a lensing event can be confirmed with redshift of the background lensed DSFG and an optical image showing the presence of a foreground lensing galaxy. As the sample sizes of lensed Herschel-selected DSFGs are increasing, physical properties of those sources are now starting to appear in the literature (Hopwood et al., 2011, Negrello et al., 2013, Dye et al., 2013, Bussmann et al., 2013).
An example of a detailed study of the kind possible with Herschel-selected lensed DSFGs is HERMES J1057+5730 (Conley et al., 2011, Gavazzi et al., 2011). It has S500 ~ 230 mJy and an intrinsic luminosity that puts it among HyLIRGs with L = 1.4 ± 0.1 × 10¹³ L⊙ , with a SFR of 2500 M⊙ yr-1 (Conley et al., 2011). The CO observations, especially the velocity structure traced by CO at high resolution, show that it is a gas-rich (a.k.a. “wet”) merger (Riechers et al., 2011b) and the molecular gas properties show at least a two-phase medium with with Tkin ~ 100K and ngas ~ 103 cm-3 gas combined with very dense gas at Tkin ~ 200K and ngas ~ 105 cm-3 (Scott et al., 2011). Another example is H-ATLAS J1146-0011 (Fu et al., 2012a) with S500 ~ 300 mJy. The source is lensed by four galaxies in the foreground providing differential magnification factors of 17, 8 and 7 for near-IR (stars), submm (dust), and radio (gas traced by CO) wavelengths. The DSFG is gas rich (fgas ~ 70% relative to total baryons) and young with an estimated age of 20 Myr. The dusty star-burst phase is also likely to be short with a total estimated lifetime of 40 Myr to consume the remaining gas.
While they are magnified by gravitational lensing, almost all apparently bright DSFGs selected by Herschel are also intrinsically bright or have intrinsic (i.e., magnification-corrected) luminosities that correspond to ULIRG to HyLIRG-like IR-bright galaxies. This is because the magnification factor for S500 > 100 mJy samples are small with a mean value around 6 - 3+5 (Bussmann et al., 2013). While published statistics are limited to a handful of galaxies, such a low magnification factor is in contrast to the SPT-selected lensed DSFGs at 1.4 mm that have magnification factors around ~ 20 (Hezaveh et al., 2013). The difference could easily point out biases in the sample selection with Herschel finding more of the lensed DSFGs that have large intrinsic sizes while the SPT selection is biased to intrinsically small subset of the lensed DSFGs that also happen to be primarily at higher redshifts, with latter due to the longer wavelength selection. However, this conclusion is based on limited statistics for the SPT sample. While ~ 30 lensed Herschel-selected SMGs now have well-determined magnification factors (Bussmann et al., 2013), magnification factors for SPT sample is limited to four sources (Hezaveh et al., 2013). Similarly, the intrinsic size distribution measured from lensed DSFGs could be biased low since compact sources are more likely to be highly magnified (Hezaveh et al., 2012).
 |
Figure 35. Spire color ratios for candidate z > 4 DSFGs in Dowell et al. (2013) (black dots) with confirmed sources shown as red diamonds, including the highest redshift Herschel-selected SMG HFLS3 at z = 6.34. SED tracks based on Arp 220 and the Cosmic Eyelash (Swinbank et al., 2010) are shown for comparison. They gray dashed lines are the selection from Dowell et al. (2013). The figure is a modified version of the same figure published in Dowell et al. (2013); its reproduction here is done with permission of the authors and AAS. |
On the topic of lensed DSFGs detected by SPT, Vieira et al. (2013) reported a sample of 23 spectroscopically-confirmed with ALMA, lensed DSFGs (of 26 targeted DSFGs). At least 10 of these DSFGs are at z > 4 with 2 secure detections at z > 5. Fig. 36 shows ALMA contours at 350 GHz on HST and other near-IR imaging data for four of the lensed DSFGs studied in Hezaveh et al. (2013). These four lensed DSFGs have magnification factors that range from 5 to 22 with lens Einstein radii of 1.1 to 2.0 arcseconds. The lensing masses in the foreground range from 1-7 × 10¹¹ M⊙ , suggesting that SPT-selected lensed DSFGs events involve massive galaxies in the foreground. SPT-S 053816-5030.8 (a.k.a. SPT0538) at z = 2.78 involves two components, with SFR densities of 630 ± 240 M⊙ yr-1 for the compact (0.5 kpc) and 31 ± 11 M⊙ yr-1 for the extended (1.6 kpc) component, respectively (Bothwell et al., 2013b). SPT0538 has a strong H2O detection confirmed through Z-Spec, and exhibits the highest LH20 / LIR ratio of all high-z DSFGs. With a SFR surface density reaching the levels of local ULIRGs, 70% of the total star-formation in SPT0538-50 is in the compact region. The estimated molecular gas mass is Mgas ~ 2 × 10¹⁰M⊙ (Aravena et al., 2013), and the galaxy is expected to exhaust its molecular gas supply in about 20 Myr (Bothwell et al., 2013b).
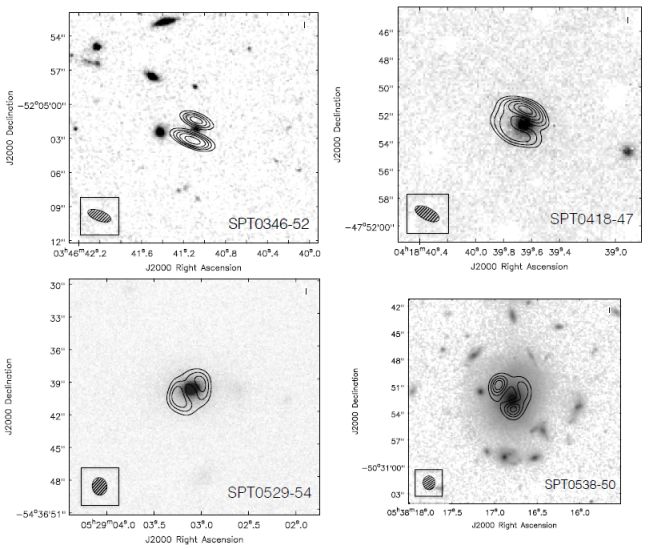 |
Figure 36. ALMA 350 GHz contours of four SPT-selected lensed DSFGs on top of near-IR images of the lensing galaxy. The four targets shown here are SPT 03456-52 (z = 5.65), SPT 0418-47 (z = 4.22), SPT 0529-54 (z = 3.36), and SPT0538-50 (z = 2.78). The figure is reproduced from Hezaveh et al. (2013) with permission from the authors and AAS. |
While with the advent of wide-area submm surveys have increased the sample sizes of DSFGs at z > 2, we are still limited to a handful of SMG-like DSFGs with S850 > 5 mJy at z > 5 (see Table 3). Most of these SMGs at z > 5 are serendipitous discoveries.
| Name | Redshift | S850obs (mJy) | Reference |
| J1148+5251† | 6.42 | 7.8 ± 0.7 | Wang et al. (2007) |
| HFLS3 | 6.34 | 33 ± 2 | Riechers et al. (2013b) |
| SPT0243-49 | 5.69 | 73 ± 12 | Vieira et al. (2013) |
| SPT0346-52 | 5.65 | 138 ± 24 | Vieira et al. (2013) |
| Aztec-3 | 5.30 | 8.7 ± 1.5 | Capak et al. (2011) |
| HLS J0918+5142 | 5.24 | 125 ± 8 | Combes et al. (2012) |
| HDF 850.1 | 5.18 | 7.0 ± 0.5 | Walter et al. (2012) |
| † J1148+5251 is a QSO which happens also to be a bright SMG. | |||
HDF850.1 dates back to the original SCUBA survey of the HDF-N by Hughes et al. (1998). The multi-wavelength counterpart identification has been challenging, despite many attempts (Downes et al., 1999, Dunlop et al., 2004, Wagg et al., 2007, Cowie et al., 2009), highlighting the challenge at identifying and studying properties of extreme DSFGs at very high redshifts. The redshift of HDF850.1 was found to be z = 5.183, among an over-density of galaxies in the HDF-N field around the same redshift, through a combination of IRAM/PdBI CO(6-5) and CII and VLA CO(2-1) spectral line measurements (Walter et al., 2012). With the redshift determined, HDF850.1 is estimated to be forming stars at the rate of 850 M⊙ yr-1. Despite such high star-formation, gas and dust properties of HDF850.1 have been determined to be comparable to normal local star-forming galaxies, including a LC[II] / LFIR ratio higher than extreme starbursts and AGN-hosted SMGs. Unfortunately, an infrared/optical counterpart remains undetected and the stellar properties of the galaxy has yet to be constrained.
J1148+5251 in Table 3 barely meets the canonical 850 µm SMG criterion of S850 > 5 mJy. It was detected as a bright quasar at a redshift of 6.42 in SDSS (Fan et al., 2003). The source is bright in submm wavelengths with a far-infrared luminosity of a HyLIRG with value ~ 2 × 10¹³ L⊙ (Beelen et al., 2006) and a SFR in excess of 3000 M⊙ yr-1. It is also gas rich with a total molecular gas mass of ~ 2.5 × 10¹⁰ M⊙ distributed over a diameter of 5 kpc (Walter et al., 2003). Riechers et al. (2009) find that half of the integrated SFR is concentrated over a nuclear region of just 0.75 kpc in radius (Riechers et al., 2009) with an SFR surface density of 1000 M⊙ yr-1 kpc - 2, close to an Eddington-limited maximal starburst (Walter et al., 2009). J1148+5251 is interesting in that the maximal SFR is spread over a kpc region while in z ~ 2 SMGs and local nuclear ULIRG starbursts such high SFR surface density is limited to 100 pc areas.
AzTEC-3 is one of the brightest mm-wave source in the 2 deg.2 COSMOS field with S1.1 = 11.3 ± 1.2 mJy (Aretxaga et al., 2011) and S2 mm = 3.7 ± 1.4 mJy (Capak et al., 2011). With a IR luminosity of 1.7 ± 0.8 × 10¹³ L⊙, AzTEC-3 is starbursting with a SFR of > 1500 M⊙ yr-1. We have discussed this source with respect to its environment in Section 7.1. The molecular gas properties of the galaxy are discussed in Riechers et al. (2010b) where the CO(2-1), CO(5-4) and CO(6-5) observations allow an estimate on the gas mass of Mgas ~ 5 × 10¹⁰ M⊙. The implied SFR is such that this gas content will be consumed in over 30 Myrs (Riechers et al., 2010a). The measured gas and stellar masses are such that the gas mass fraction is > 80% and between 30% to 80% when measured relative to the total baryon content and total dynamical mass, respectively. These fractions are comparable to z ~ 2 SMGs. The implications of the measured dust and stellar mass of AzTEC-3 on the formation of dust through supernovae processes are discussed in Dwek et al. (2011).
The Herschel-Spire-selected z = 6.34 galaxy HFLS3 was found from a systematic search for z > 4 SMGs in HerMES Spire maps based on the color information from 250 to 500 µm (Figure 35). As the SED is redshifted, assuming typical dust temperatures at the level of 30-45 K, one expects the SED for z > 4 DSFGs to peak at 500 µm with a non-detection at 250 µm. The selection process of such red galaxies, using optimally filtered maps based on a color criterion, is discussed in Dowell et al. (2013). One of the reddest galaxies in this sample is HFLS3 (Riechers et al., 2013b) with LFIR ~ 2 × 10¹³ and inferred SFR of 2,900 M⊙ yr-1. It has been detected in 7 CO lines, 7 H2O lines, OH, OH+, H2O+, NH3, [CI], and [CII] lines in emission or absorption, providing a wealth of information on the conditions related to a starburst during the end of reionization epoch. The dust, molecular, and atomic gas masses of HFLS3 are 109 M⊙, 1011 M⊙, and 2 × 10¹⁰ M⊙, respectively. The gas-to-dust ratio of 80, the gas mass fraction of 40% relative to the dynamical mass of ~ 3 × 10¹¹ M⊙, and the gas depletion time scale of Mgas / SFR ~ 40 Myr are comparable to z ~ 2 SMGs. From [CI], HFLS3 is known to contain an atomic carbon mass of ~ 4 × 10⁷ M⊙. At the measured SFR, such a high mass of carbon could be assembled through supernovae over a timescale of 10 Myrs. The CO SLED and radiative transfer modeling show the molecular gas mass to have a kinetic temperature of about 150K with a gas density around 6,000 cm - 3, similar to gas densities in local ULIRGs. More interestingly, the submm spectra show H2O and OH lines with upper level energies E / kB > 300-450 K and critical densities in excess of 108 cm - 3. These H2O line intensities and ratios are consistent with radiative pumping by infrared photons of the massive starburst in addition to collisional excitations. This scenario is different from AGN-dominated ULIRGs such as Mrk 231 where the H2O line intensities and ratios provide evidence for hard radiation associated with the luminous AGN.
The z = 5.2 lensed DSFG HLS J0918+5142 was identified from Spire maps of galaxy cluster Abell 773 at z = 0.22, though the DSFG is primarily lensed by a foreground galaxy at z = 0.63 and not the galaxy cluster (Combes et al., 2012). At submm wavelengths it is magnified by a factor of 9 ± 2 (Rawle et al., 2013). The source is made up of multiple velocity components in the CO(1-0) line with one of the components at - 700 ± 40 km s-1 having an unusually high L[NII] / L[CII] ratio of ~ 0.12, where a ratio with typical values around 0.05 is seen in another high-z [NII] detection at z = 4.7 (Nagao et al., 2012). Rawle et al. (2013) identifies this velocity-resolved component as an ionized, molecular outflow. Another possibility is a less active companion galaxy with a lower density and cooler gas leading to less vigorous star-formation than in other components.
The two SPT sources, SPT0243-49 and SPT0346-52, at z = 5.69 and z = 5.65 respectively, are the two z > 5 lensed SMGs from the 1.4mm-selected SPT DSFGs with ALMA-determined redshifts (Vieira et al., 2013). The lens model of SPT0346-52 is described in Hezaveh et al. (2013) and is found to have a magnification in the submm of 5.6 with an intrinsic 860 µm flux density of 23 mJy. This puts a intrinsic SFR surface density of 4200 M⊙ yr-1 kpc-2, close to or well-above the Eddington limit for starbursts.
17 Note that upon a correction to the calculation in Swinbank et al. (2011), the actual pressure is even higher, an order of magnitude above these published values (Jacqueline Hodge, private communication). Back.