


In this section, we discuss 3 powerful cluster lensing based methods at various stages of development and application that may provide competitive and important constraints on cosmological parameters. These are: cosmography using several sets of multiple-images lensed by the same cluster; the abundance of arcs and the statistics of lensed image triplets. For cosmography and triplet statistics purely geometric constraints are obtained via the ratio of angular diameter distances, whereas the abundance of arcs provides potentially strong constraints on the growth of structures and primordial non-gaussianity.
6.1. Cosmography with multiple-images
Measurements of the Hubble diagram for Type Ia Supernovae (SNIa) (Riess et al. 1998; Perlmutter et al. 1999) combined with constraints from the Wilkinson Microwave Anisotropy Probe (WMAP5) (Spergel et al. 2003), cosmic shear observations (Bacon, Refregier & Ellis 2000; Kaiser et al. 2000; van Waerbeke et al. 2000; Wittman et al. 2000; Semboloni et al. 2006), cluster baryon fraction (Allen et al. 2004), cluster abundances (Vikhlinin et al. 2009) and baryon acoustic oscillations (BAO) from galaxy surveys (Efstathiou et al. 2002; Seljak et al. 2005; Eisenstein et al. 2005) suggest that ∼ 72% of the total energy density of the Universe is in the form of an unknown constituent with negative pressure - the so-called dark energy, that powers the measured accelerating expansion. These observations probe the equation-of-state parameter wX, defined as the ratio of pressure to energy density, through its effect on the expansion history of the Universe and the growth of structures.
Constraining the geometry and matter content of the Universe using multiple sets of arcs has been explored in cluster lenses using different techniques (Paczynśki & Gorski 1981; Link & Pierce 1998; Cooray 1999; Golse et al. 2002; Sereno 2002; Sereno & Longo 2004 Soucail et al. 2004; Dalal et al. 2005; Meneghetti et al. 2005a, b; Maccio 2005; Gilmore & Natarajan 2009; Jullo et al. 2010).
As shown in Section 1, the lensing deflection produced in the image of a background source depends on the detailed mass distribution of the cluster as well as on the ratio of angular diameter distances. The cosmological dependence arises from the angular diameter distance ratios that encapsulate the geometry of the Universe and are a function of both Ωm and ΩX.
The most promising technique, is using multiple sets of arcs with measured redshifts. By taking the ratio of their respective Einstein radii and marginalizing over parameters of the mass distribution, one can in principle constrain the cosmological parameters Ωm and ΩX. In this method, the angular diameter distance ratios for two images from different sources defines the ‘family ratio' Ξ, from the cosmological dependence of which constraints on Ωm and wX are extracted:
 |
(58) |
where zL is the lens redshift, zs1 and zs2 are the two source redshifts, and D(z1, z2) is the angular diameter distance.
Link & Pierce (1998) showed that the cosmological sensitivity of the angular size-redshift relation could be exploited using sources at distinct redshifts and developed a methodology to simultaneously invert the lens and derive cosmological constraints. Golse et al. (2002) using simulated cluster data, showed that the recovery of cosmological parameters was feasible with at least 3 sets of multiple-images for a single cluster. Soucail et al. (2004) then applied the technique to the lensing cluster Abell 2218 using 4 systems of multiple-images at distinct redshifts, and found (Ωm < 0.37, wX < −0.80) assuming a flat Universe.
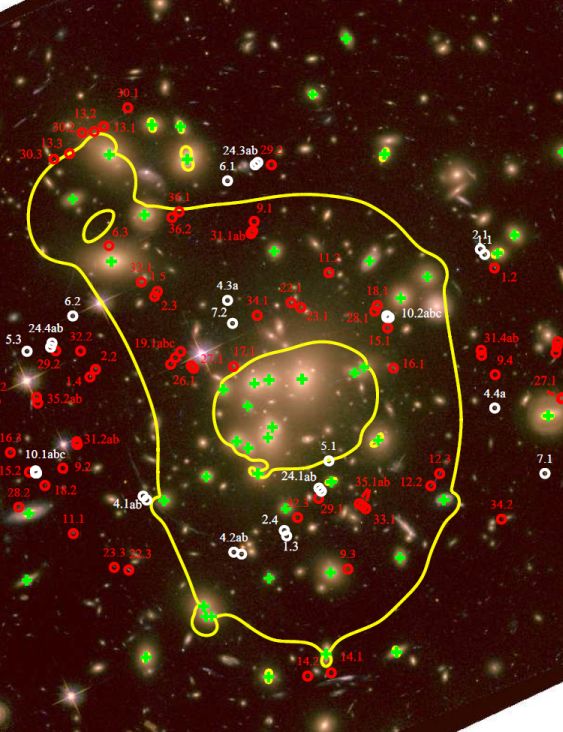 |
Figure 40. The critical lines for a source at z = 3 are over-plotted in yellow on the HST ACS image of Abell 1689. The lensing mass model used is the one from which we derived cosmological constraints. In addition to two large-scale clumps and the BCG, this model includes the contribution of 58 cluster galaxies. The positions of cluster galaxies are marked with green crosses. Over-plotted in white are the 28 multiple-images arising from 12 families used in their work; the red circles mark the positions of the rejected images (Figure from Jullo et al. 2010). |
Jullo et al. (2010) have presented the results of the first application of this method to the massive lensing cluster Abell 1689 at z = 0.184 (see Figure 40). Based on images from the Advanced Camera for Surveys (ACS) aboard the Hubble Space Telescope (HST) this cluster has 114 multiple-images from 34 unique background galaxies, 24 of which have secure spectroscopic redshifts (ranging from z ∼ 1 to z ∼ 5) obtained with the Very Large Telescope (VLT) and Keck Telescope spectrographs (Broadhurst et al. 2005; Limousin et al. 2007). Their parametric model has a total of 21 free parameters consisting of two large-scale potentials, a galaxy-scale potential for the central brightest cluster galaxy (BCG), and includes the modeling of 58 of the brightest cluster galaxies. The contribution of substructure in the lens plane and along the line of sight is explicitly included (see D'Aloisio & Natarajan 2011 for a detailed discussion of the systematics). Combining the lensing derived cosmological constraints with those from X-ray clusters and the Wilkinson Microwave Anisotropy Probe 5-year data gives Ωm = 0.25 ± 0.05 and wX = −0.97 ± 0.07 which are consistent with results from other methods (see Figure 41). Inclusion of this work with all other techniques available brings down the current 2σ contours on the dark energy equation of state parameter wX by about 30%.
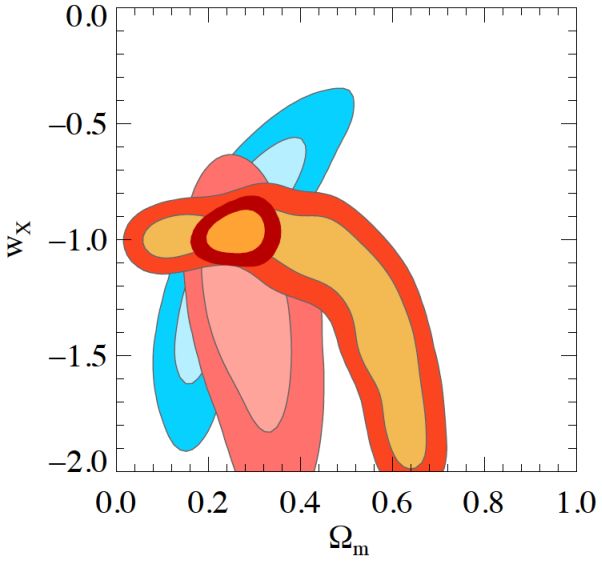 |
Figure 41. The current cosmological constraints in the (Ωm, Ωλ) based on the best-fit model of Abell 1689 from Jullo et al. (2010): the results from combining cosmological constraints from WMAP5 + evolution of X-ray clusters + cluster strong lensing (cluster only methods); the 1 and 2σ contours are plotted, blue contours - constraints from WMAP5, pink contours - X-ray clusters, orange contours - cluster strong lensing. |
As with all techniques, an accurate inventory of the key systematics and their contribution to the error budget is also the challenge for this technique. The two significant current limitations arise from: (i) accounting appropriately for the lensing effect of the uncorrelated line of sight substructure (see schematic in Figure 42) and (ii) the simplifying scaling relations assumed to relate galaxy total mass to galaxy light. However, the results from Abell 1689 are extremely encouraging and the future prospects for this method look promising due to the power from combining several clusters at various redshifts.
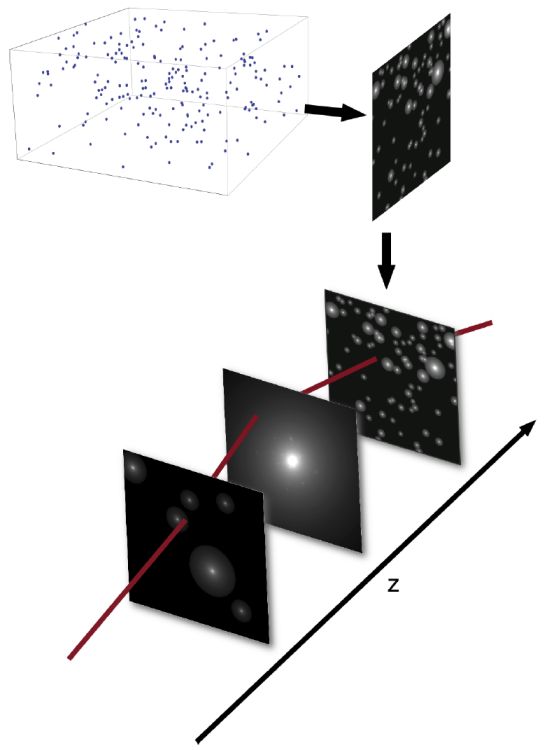 |
Figure 42. Schematic diagram illustrating the creation of lens planes to quantify the lensing effects of halos along the line of sight. A rectangular slice of the Millennium Simulation box is taken and the locations of halos are projected along the long axis and analytic NFW potentials are placed on those positions. The NFW parameters are obtained through scaling relations with mass and redshift. The lens plane is inserted at the appropriate redshift and a multi-plane lensing algorithm is used to trace rays. Many lens planes between z = 0 and z = 5 are used to estimate the systematic errors at the positions of multiple-images from the structure along the line of sight. |
6.2. Arc statistics and Primordial Non-gaussianity
The production of giant arcs by lensing clusters is ubiquitously observed. The abundance of massive clusters available to do so is sensitive both to the expansion history and initial conditions of the Universe. Given the scaling of the lensing efficiency with redshift, it is known that the frequency of giant-arc formation depends on the abundance and characteristics of galaxy-clusters roughly half-way to the sources. Cluster physics, cosmological effects and the properties of the high-redshift source population all play a role in determining the abundance of giant arcs, however, isolating these effects is difficult. It was originally claimed by Bartemann et al. (1998) that the ΛCDM model predicted approximately an order of magnitude fewer arcs than seen in observations. Subsequent studies (e.g. Zaritsky & Gonzalez 2003; Gladders et al. 2003) substantiated this claim of a ‘giant-arc problem'. This mis-match between observations and the concordance cosmological model predictions suggest that either the Bartelmann et al. (1998) analysis was lacking a crucial component of properties exhibited by real cluster lenses and the source population (Williams et al. 1999) or that the concordance cosmology is in fact inconsistent with the observed abundance of giant arcs. A significant amount of effort has been expended toward understanding the most important characteristics of arc-producing clusters, and how they may not be typical of the general cluster population (e.g. Hennawi et al. 2007; Meneghetti et al. 2010; Fedeli et al. 2010). Other studies focused on effects that were not captured in early simulations. The mass contribution of central galaxies appears to have a significant effect, though not enough to entirely resolve the Bartelmann et al. (1998) disagreement alone (Meneghetti et al. 2003; Dalal et al. 2004). The probability of giant-arc formation increases with source redshift, therefore the overall abundance is sensitive to uncertainties in the high-redshift tail of the source-redshift distribution (Wambsganss et al. 2004; Dalal et al. 2004; Li et al. 2005). However, none of these effects can account for the observed discrepancy. On the other hand, taking into account a realistic source population and observational effects, Horesh et al. (2005) claimed that the clusters predicted by ΛCDM have the same arc production efficiency as the observed clusters. The effects of baryonic physics, such as cooling and star formation, on central mass distributions have also been investigated (Meneghetti et al. 2010).
The amplitude of the linear matter power spectrum plays a critical role in determining how severe and if there is a giant-arc problem or not. Observations seem to be converging on σ8 ≈ 0.8 (Fu et al. 2008; Vikhlinin et al. 2009; Komatsu et al. 2011), while most numerical studies on the giant-arc abundance to date have assumed σ8 = 0.9. It is likely that adjusting σ8 from 0.9 to 0.8 will lower the predicted giant-arc abundance significantly, increasing tension with observations (Li et al. 2005; Fedeli et al. 2008). The cosmological model may play a role here. In arguing that the giant-arc problem may be unavoidable if σ8 ≈ 0.8, Fedeli et al. (2008) mention in passing that early dark energy or non-Gaussian initial conditions may provide “a way out.” The effects of dark energy on giant-arc statistics have been investigated in Bartelmann et al. (2003), Maccio (2005), Meneghetti et al. (2005a, b, c), and Fedeli & Bartelmann (2007). On the other hand, the possible effects of non-Gaussian initial conditions have only been explored recently by D'Aloisio & Natarajan (2011). They argue that primordial non-Gaussianity (PNG) can affect the probability of giant-arc formation in at least two ways. 7 First, PNG can lead to an enhanced or diminished abundance of galaxy clusters, depending on the particular model (e.g. Matarrese et al. 2000; Lo Verde et al. 2008; Dalal et al. 2008), which would lead to a change in the number of supercritical lenses that are available in the appropriate redshift range. Secondly, PNG is expected to influence the central densities of halos (Avila-Reese et al. 2003; Oguri & Blandford 2009; Smith et al. 2010). Since lensing cross sections are sensitive to central densities, we expect corresponding changes in them as well. If a cluster-lens cannot produce arcs with length-to-width ratios above some threshold, then its cross section for giant-arc production is zero. Roughly speaking, this corresponds to a minimum mass required to produce giant arcs. Owing to the effects on central densities, we expect PNG to alter this minimum mass threshold as well.
D'Aloisio & Natarajan (2011) quantify the impact of non-Gaussian initial conditions with the local bispectrum shape on the predicted frequency of giant arcs. Non-Gaussianity is generally expressed in terms of fNL that characterizes the amplitude of non-Gaussianity in the primordial curvature perturbation (Komatsu & Spergel 2001). Using a path-integral formulation of the excursion set formalism, extending a semi-analytic model for calculating halo concentrations to the case of PNG, they show that massive halos tend to collapse earlier in models with positive fNL, relative to the Gaussian case, leading to enhanced concentration parameters. The converse is true for fNL < 0. In addition to these effects, which change the lensing cross sections, non-Gaussianity also modifies the abundance of supercritical clusters available for lensing. These combined effects work together to either enhance (fNL > 0) or suppress (fNL < 0 ) the probability of giant-arc formation (see Figure 43). Using the best value and 95% confidence levels currently available from the Wilkinson Microwave Anisotropy Probe, they report that the giant-arc optical depth for sources at zs ∼ 2 is enhanced by ∼ 20% and ∼ 45% for fNL = 32 and 74 respectively. Conversely they report a suppression of ∼5% for fNL = −10. These differences translate to similar relative changes in the predicted all-sky number of giant arcs. Ideally the goal is to use giant-arc statistics to constrain small scale PNG. The prospects are extremely promising given upcoming all sky surveys planned by future deep wide-field imaging surveys such as foreseen by the Dark Energy Survey (DES), the Large Synoptic Survey Telescope (LSST) and future wide-field space mission (e.g. EUCLID).
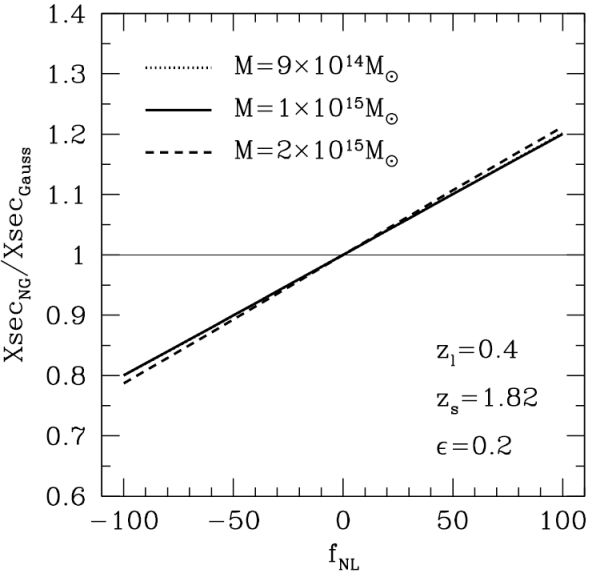 |
Figure 43. The ratio of giant-arc cross sections in the case of non-Gaussian and Gaussian initial conditions. Halos have enhanced central densities in models with fNL > 0. Their giant-arc cross sections are therefore increased relative to the Gaussian case and vice versa (Figure from D'Aloisio & Natarajan 2011). |
Triplet statistics offer an interesting geometrical method that uses the weak gravitational lensing effects of clusters to constrain the cosmological parameters Ωm and ΩΛ (Gautret, Fort & Mellier 2000). For each background galaxy, a foreground lensing cluster induces a magnification that depends on the local convergence κ and shear terms γ1 and γ2 and on the cosmological parameters through the angular diameter distance ratio DLS / DOS. To disentangle the effects of these three quantities, the ellipticities of each triplet of galaxies located at about the same apparent position in the lens plane (although at three distinct redshifts) needs to be compared. The simultaneous knowledge of ellipticities and redshifts of each triplet enable the building of a purely geometrical estimator G(Ωm, ΩΛ) that is independent of the lens potential. This estimator G has the simple form of the determinant of a 3x3 matrix built with the triplet values of DLS / DOS and observed ellipticities.
When G is averaged over many triplets of galaxies, it provides a global function which converges to zero for the true values of the cosmological parameters. However, in order to apply this method the various sources of statistical noise need to be quantified. The linear form of G with respect to the measured ellipticity of each galaxy implies that the different sources of noise contributing to G decrease as 1 / √N, where N is the total number of observed lensed galaxies. From simulations that incorporate realistic geometries and convergences for lensing clusters and a redshift distribution for galaxies, the results are promising for a sample of 100 clusters. These 100 clusters essentially need to be imaged in multiple bands to obtain accurate photometric redshifts for the triplets. With next generation cosmological surveys the observational data needed for this sample size would not be impossible to obtain.
7 The PNG model considered here is the simplest one that gives rise to a non-zero 3-point correlation function. Back.