


5.1. Magnification due to Gravitational Lensing
Cluster lenses magnify and distort the shapes of distant galaxies that lie behind them. For strong lensing clusters, the amplification factor can in principle be infinite if the source is compact enough and is located exactly behind the caustic, of course such an event is infinitely rare! Nevertheless, in several strong lensing clusters, amplification factors larger than 40 × (∼ 4 magnitudes) have been measured (Seitz et al. 1998), and in fact, amplification factors larger than 4 × (∼ 1.5 magnitudes) are quite common (Richard et al. 2011). It is thus not surprising that “Cluster Lenses” are often referred to as “Nature's Telescopes” or “Cosmic Telescopes” and have been rather effectively used to discover and study the most distant galaxies that lie behind them.
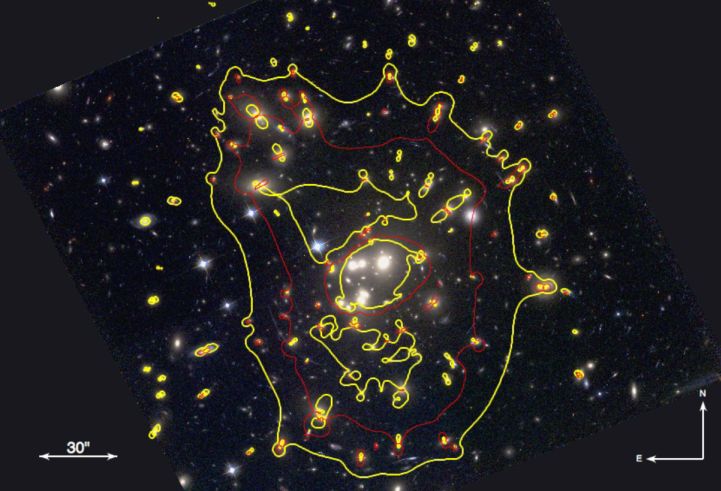 |
Figure 32. The high magnification critical region in the core of the massive cluster Abell 1689. Red lines are the critical line for z = 7 (both radial and tangential lines are shown) and the yellow contours delimit the regions of the sky having a magnification larger than a factor of ten. |
The regions with the largest magnification are the regions closest to the critical lines in the image plane (typically less than 1 square arcminute), and closest to the caustic line in the source plane (typically a few tens to hundreds square arcsecond). The cross section for high amplification will vary from cluster to cluster and depends on the detailed mass distribution. To first order, the cross section scales with the square of the Einstein radius as well as with the ellipticity or anisotropy of the projected mass distribution on the sky.
As the magnification is wavelength independent, the benefit of using cluster lenses as cosmic telescopes has been exploited at various wavelengths, from X-ray to the radio domain. Lensing clusters were first used as cosmic telescopes in the optical/NIR domain, where a large population of the most distant galaxies (at their time of discovery) were found behind these cluster magnified regions (e.g Yee et al. 1996; Franx et al. 1997; Ellis et al. 2001; Hu et al. 2002; Kneib et al. 2004; Richard et al. 2011). Lensing clusters were also used at longer wavelengths in sub-millimeter using SCUBA at JCMT (e.g Smail et al. 1998) and in the mid-infrared domain using the ESA ISO space telescope (Altieri et al. 1999; Metcalfe et al. 2003, Coia et al 2005a, 2005b) and now in the far-infrared using the Herschel space observatory (Egami et al. 2010; Altieri et al. 2010).
There are two important and unprecedented advantages that cluster lenses offer as cosmic telescopes as they provide the largest field of view with high magnification:
Furthermore, we note that as cluster lenses magnify they also distort the shapes of distant galaxies. In general, the further the sources, the stronger the distortions. Hence to first order, the shape of a lensed galaxy (assuming it can be resolved), and whether it is multiply imaged or not, can be used as a good distance indicator.
Rather similar to other galaxy surveys two distinct observational strategies that trade-off depth with area have been explored thus far:
1) deep mapping (in imaging or spectroscopy) of a few well modeled lensing clusters to search for distant lensed sources - this allows us to probe down the luminosity function of the targeted distant source population,
2) shallow mapping on a large cluster sample to search for rare highly magnified background sources (e.g. Figure 33), with the idea to thereafter conduct detailed follow-up observations of these sources benefiting from the high amplification/magnification to constrain important physical and morphological properties of high-redshift sources (e.g. Lemoine-Buserolle et al 2003).
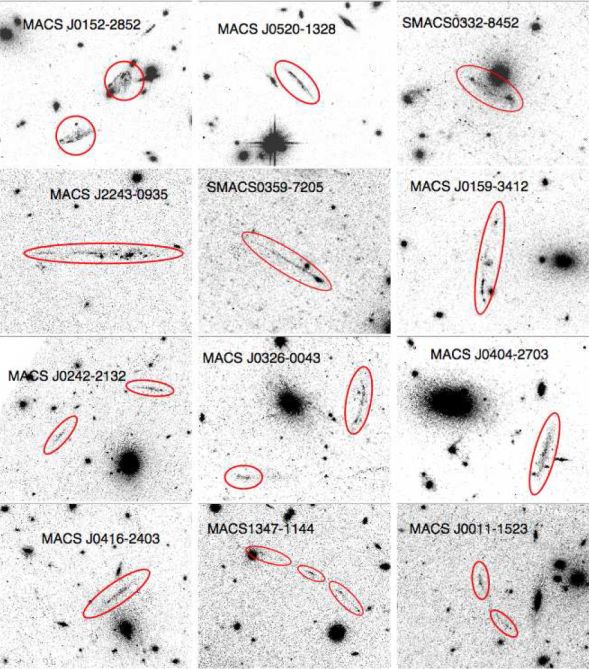 |
Figure 33. Newly discovered giant arcs or multiple-images as part at the SNAPSHOT HST observations (PI. H. Ebeling) of the MACS cluster sample. These images show the diversity of morphology for these serendipitously discovered strongly lensed galaxies (Figure is from Richard et al. private communication). |
As the strong magnification region covers typically at most about a few square arcminutes, surveys through cluster lenses are particularly adapted to those instruments/telescopes that have an instantaneous field of view comparable to the strong lensing region. The HST cameras are particularly well matched to cluster strong lensing regions and are thus very well adapted to use for the search and study of distant sources. Incidentally, this was also the case for the SCUBA instrument on JCMT, as well as the ISOCAM on the ISO space mission. In the near future ALMA, MUSE (the one square arcminute integral field unit on the VLT), and the forthcoming JWST instruments are all facilities that will most effectively exploit lensing magnification.
Of course when conducting a detailed follow-up study of highly magnified sources, the most effective instruments are high-resolution imagers and spectrographs. In particular, because of the extended nature of the most amplified sources, integral field spectrographs are more adapted compared to long-slit instruments, and it is thus natural to conduct follow-up studies with instruments such as SINFONI on VLT or OSIRIS on Keck for the extremely magnified, rare, lensed sources.
Finally, an other particular observation strategy of cosmic telescope is that of “critical line mapping”. In this case, one specifically targets regions near the critical lines using dedicated instruments such as a long slit spectrograph (e.g. Santos et al. 2004; Stark et al. 2007), an integral field spectrograph (Clement et al. 2011 in preparation) or a millimeter wave interferometer to blindly probe the distant Universe. In this case the effective field of view of the instrument is small compared to the critical region, thus requiring a mapping strategy to cover the region with the highest amplification.
5.3. “Lens redshift” measurement
As lensing distortion and magnification are a function of the redshift of the background sources, once a cluster mass distribution is well known, the lens model can be used to predict the redshifts for the newly identified multiple systems (e.g. Kneib et al. 1993; Natarajan et al. 1998; Ellis et al. 2001) as well as for the arclets (Kneib et al. 1994b, 1996).
For multiple-image systems, the relative positions of the different images is a strong function of the redshift of the background source. Although the redshift sensitivity decreases with the redshift of the background source (because the DLS / DS variation is smaller with increasing redshift) it can nevertheless be used to easily distinguish between low and high-redshift solution. In this respect, one can easily discriminate z ∼ 1–2 obscured galaxies from z > 4 high-redshift lensed galaxies, and this property has been used many times very effectively (Ellis et al. 2001; Kneib et al. 2004; Richard et al. 2008; Richard et al. 2011). For the arclets, the redshift prediction is based on the fact that on average a distant galaxy is randomly orientated, and its ellipticity follows a relatively peaked ellipticity distribution (σє ∼ 0.25). Hence, by conducting high-resolution imaging (e.g. with Hubble), and by measuring the ellipticity and orientation of the background lensed sources in the core of massive cluster lenses, one can statistically derive the redshift distribution of the background lensed population. Such measurements were first introduced by Kneib et al. (1993), and developed further in Kneib et al. (1996). These predictions were tested and verified by Ebbels et al. (1998) using spectroscopy in the case of the lensing cluster Abell 2218. Despite the successful demonstration of the technique, it never became popular due to the following limitations. First, the derived probability distribution p(z) distribution is relatively broad, particularly, at high-redshift. Therefore the method is not really competitive with photometric redshift determinations, except may be for disentangling catastrophic photometric redshifts. Second, the cluster galaxy contamination is high in the optical/near-infrared domain and statistical estimates always have limited utility. Third, galaxy sizes decrease rapidly with redshift, and accurate measurement of the galaxy shape can only be done efficiently with deep Hubble imaging yet again limiting the use of this technique. Finally, as there are many other good science drivers to obtain multi-band information on these massive clusters, and as photometric redshift determination methods are rapidly improving, the statistical lens redshift measurements never became attractive and/or popular.
5.4. Lensing Surveys in the Sub-millimeter
The SCUBA (the JCMT Submillimeter Common-User Bolometer Array) Lensing survey was likely one of the first systematic surveys to exploit distant lensed galaxies using massive clusters. This survey first started with the mapping of two massive clusters: Abell 370 at z = 0.37 and Cl 2244-02 at z = 0.33 (Smail et al. 1997) and continued to map the region behind five similarly massive clusters covering a total area of 0.01 square degree (Smail et al. 1998). Each SCUBA continuum map from this cluster lens survey covered a total area of about 5 square arcminutes to 1σ noise levels less than 14 mJy/beam and 2 mJy/beam at 450 and 850 micron wavelengths respectively.
Since SCUBA was a new instrument that achieved a sensitivity 2–3 orders of magnitude deeper than was previously possible and thanks to the cluster magnification, Smail et al. (1997) were the first to find the distant sub-millimeter (sub-mm) selected galaxy population. In total 17 sources brighter than the 50% completeness limits (10 brighter than the 80% limit) were discovered (Smail et al. 1998). The sub-millimeter spectral properties of these first sources indicated that the majority lie at high-redshift (1 < z < 5.5), which was confirmed later with redshift measurements. Measured redshifts for a large number of these submm-selected galaxies placed the bulk of this population at z ∼ 2.5 (Ivison et al. 1998; Barger et al. 2002; Chapman et al. 2005).
The use of cluster lenses in the case of the sub-millimeter high-redshift searches was strongly motivated by the fact that cluster galaxy members are not sub-millimeter sources and are therefore transparent at this wavelength, making clusters perfect telescopes to preferentially probe the distant galaxy population (Blain 1997). Importantly, the use of cluster lenses increases the sensitivity of sub-mm maps and reduces the effects of source confusion (which plagues bolometer surveys in sub-mm and mm wavelengths) due to the dilution produced by lensing clusters. With accurate lens models Blain et al. (1998) first corrected the observed sub-mm source counts for lensing amplification using the SCUBA lensing survey data on the first seven clusters, thus pushing the 850 micron counts down below the SCUBA confusion limit; for example at 1 mJy, 7900 ± 3000 galaxies per square degree were found. Down to the 0.5 mJy limit, the resolved 850 micron background radiation intensity was measured to be (5 ± 2) × 10−10 W m−2 sr−1, comparable to the current COBE estimate of the background, indicating for the first time that the bulk of the 850 micron background radiation is effectively produced by distant ultra-luminous galaxies. These first sub-mm galaxy counts were confirmed later with a larger sample of clusters mapped by SCUBA (Cowie et al. 2002; Knudsen et al. 2008) reaching a lens-corrected flux limit of 0.1 mJy. The first sub-mm multiple-images were found in Abell 2218 (Kneib et al. 2004) and MS0451-03 (Borys et al. 2004) identified at z = 2.516 and z ∼ 2.9 respectively. In particular, the source SMM J16359+6612 is gravitationally lensed by Abell 2218 into three discrete images with a total amplification factor of ∼45, implying that this galaxy has an unlensed 850-micron flux density of only 0.8 mJy. Furthermore, SMM J16359+6612 shows a complex morphology with three sub-components arguing for either a strong dust (lane) absorption or a merger. Interestingly, these sub-mm sources are surrounded by two other highly amplified galaxies at almost identical redshifts within a ∼ 100-kpc region suggesting this sub-mm galaxy is located in a dense high-redshift group (see Figure 34). Further mapping at the IRAM Plateau de Bure interferometer indicated that this source is a compact merger of two typical Lyman-break galaxies with a maximal separation between the two nuclei of about 3 kpc, thus it bears a close similarity to comparable luminosity, dusty starbursts that result from lower-mass mergers in the local Universe.
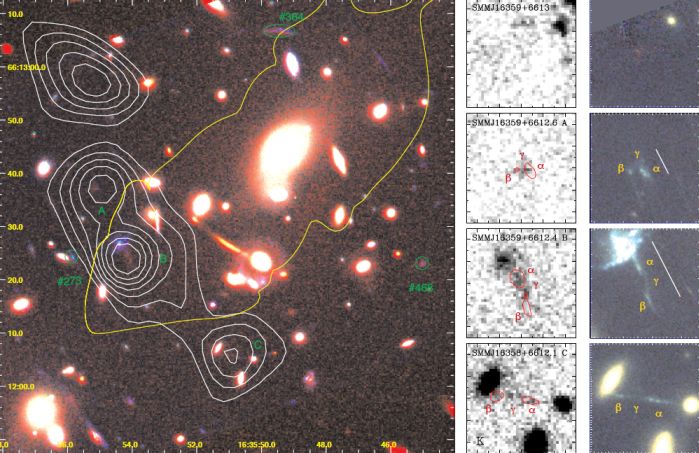 |
Figure 34. (Left) A true-color image of the core of A 2218 (blue:HST F450W, green:HST F814W and red: WHT/INGRID Ks). The 850 µm sub-mm image from SCUBA is overlayed as white contours. The three images of the multiply imaged sub-mm galaxy are annotated as A, B and C. The sub-mm contour at the top left corresponds to a z = 4.04 sub-mm galaxy discussed in Knudsen et al.(2010). Two other galaxies at z ∼ 2.5, are identified: the single-image #273 and the fold-image #384 and its counter-image #468. The yellow line shows the critical line at z = 2.515. (Right) Panel of 10” × 10” images showing the INGRID Ks-band (left column) and HST true color image from F450W/F606W/F814W (right column) of the four submm sources in the core of A 2218. Note how each of the sub-mm sources, SMM J16359+6612.6, SMM J16359+6612.4 and SMM J16358+6612.1, comprises a NIR source (γ) which is bracketed by two features in the F814W image (α and β). [From Kneib et al. 2004]. |
However, the most spectacular lensed sub-mm galaxy is certainly the recently discovered SMM J2135-0102 at redshift z = 2.3259 that is gravitationally magnified by a factor of 32 by the massive cluster MACS J2135-010217 (Swinbank et al. 2010; Figure 35). This large magnification, when combined with high-resolution sub-mm imaging, resolves the star-forming regions at a linear scale of just ∼ 100 parsec. The luminosity densities of these star-forming regions are comparable to the dense cores of giant molecular clouds in the local Universe, but they are ∼ 100 × larger and 107 times more luminous. The star formation processes at z ∼ 2 in this vigorously star-forming galaxy appear to be similar to those seen in local galaxies even though the energetics are unlike anything found in the present-day Universe.
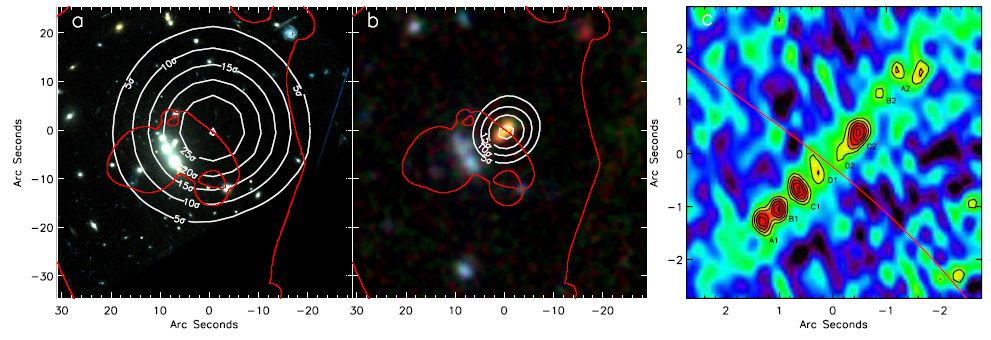 |
Figure 35. (Left) Hubble Space Telescope V, I -band color image of MACSJ2135-010217 with white contours denoting the 870 micron emission of SMM J2135-0102 with flux 106.0 ± 7.0 mJy as observed by APEX/LABOCA. The optical counter part is faint with IAB = 23.6 ± 0.2. The solid red lines denote the z = 2.326 radial and tangential critical curves from the best-fit lens model. (Center) True color IRAC 3.6, 4.5, 8.0 micron image of the cluster core with contours denoting the 350 micron emission from APEX/LABOCA. The mid-infrared counterpart is clearly visible as an extended red galaxy centered at the sub-mm position. (Right) SMA 870 micron image of the galaxy. The map shows eight individual components, separated by up to 4” in projection. The red line is the same z = 2.326 radial critical curve. Components (A,B,C,D) represent two mirror images of the galaxy, each comprising four separate emission regions reflected about the lensing critical curve. Figure from Swinbank et al. (2010). |
In the sub-mm domain, lensing has proven to be truly useful in revealing details about high-redshift sources that would otherwise be impossible, even with the next generation of large aperture telescopes.
5.5. Mid-Infrared Lensing Survey
In the late 90's, the ISOCAM camera on the ESA Infrared Space Observatory (ISO) targeted a number of massive cluster lenses. The motivation for these observations was to probe the faint and distant Mid-Infrared galaxy population and their contribution to the cosmic mid-infrared background radiation. In particular a few well-known massive cluster lenses were imaged deeply by ISO at 7 and 15 micron. The deepest ISO observation of a cluster targeted Abell 2390 (Altieri et al. 1999). Cross-identification of the numerous mid-infrared sources with optical and near-infrared data showed that almost all 15 micron sources were identified as lensed distant galaxies. These observations allowed the computation of number counts in both the 7 and 15 micron bands and led to the ruling out of non-evolutionary models, and favoring very strong number count evolution. By combining the data on three massive clusters (Abell 370, Abell 2218 and Abell 2390), Metcalfe et al. (2003) detected a total of 145 mid-infrared sources, and after a very careful lensing correction derived the intrinsic counts of the background source population. It was found that roughly 70% of the 15 micron sources are lensed background galaxies. Of sources detected only at 7 micron, 95% are cluster galaxies in this sample. Of the 15 sub-mm sources already identified within the mapped regions of the three clusters, 7 were detected at 15 micron. Flux selected subsets of the field sources above the 80% and 50% completeness limits were used to derive source counts to a lensing corrected sensitivity level of 30 micro-Jy at 15 micron, and 14 micro-Jy at 7 micron. The source counts, corrected for the effects of completeness, contamination by cluster sources and lensing, confirmed and extended earlier findings of an excess by a factor of ten in the 15 micron population with respect to source models with no evolution, with a redshift distribution that spans between z = 0.4 and z = 1.5.
5.6. Lensed Extremely Red Objects
The benefits of lensing have also been used to search for Extremely Red Objects (EROs) behind a sample of 10 X-ray luminous galaxy clusters (Smith et al. 2002a, 2002b) imaged by both the WFPC2 camera (using F702W filter) and UKIRT in the K-band. EROs are galaxies with R − K > 5.3 as defined by Daddi et al. (2000) as the criterion to select distant elliptical galaxies. The other more stringent definition with R − K > 6 was adopted by Thompson et al. (1999). In these clusters a total of about 60 EROs have been identified so far allowing the number counts of these rare objects to be computed down to about 2 magnitudes fainter than previous work published at that time. The exploitation of the lensing effect has also permitted a more accurate study of the morphology of these peculiar galaxies, revealing in some cases spectacular disky components already in place at fairly early times (Figure 36). In particular, for the case of the multiply imaged ERO J003707, morphological and photometric analyses reveal an L* early-type disk-galaxy. It has been estimated that ∼ 10% of EROs with R − K > 5.3 and K < 21 have similar properties. The unique association of passive EROs with elliptical galaxies therefore appears to be too simplistic and has been reconsidered. More recent work on searching for lensed EROs was conducted in A1835 and AC114 (Schaerer et al. 2007) taking advantage of complete wavelength coverage including HST, ground based and Spitzer data. They found in these observations that most of the EROs were, in fact, young dusty star-bursts at z ∼ 2−3.
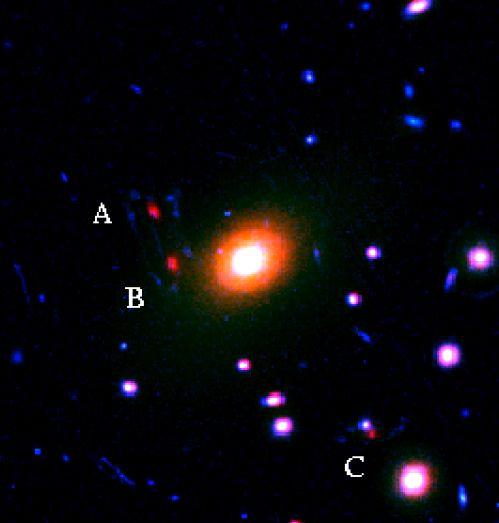 |
Figure 36. True color R, K view (50″ × 50″) of the Abell 68 cluster core (combining HST and near-infrared UKIRT data). The bright elliptical galaxy in the center of the frame is the central galaxy of the cluster. Three images of ERO J003707 are clearly visible and are marked as A, B and C. Each image comprises a central red “bulge”, surrounded by numerous fainter blue knots of current or recent star formation (from Smith et al. 2002). |
One of the exciting current ventures is to map the critical region of massive clusters (Figure 32) in order to search for Lyman-alpha emitters at very high redshifts (z > 4), compute their number density, derive their luminosity function and therefore characterize this population. By pushing to very high-redshift z > 7 one should get closer to re-ionization, and the increase in neutral gas content of the Universe should block Lyman-α photons. Thus at some point one should expect a strong evolution of the Lyman-α emitter luminosity function. Two approaches have been pursued in the search for Lyman-α emitters, a direct search through intense spectroscopy, and an indirect one that relies on conducting narrow-band imaging searches in which the wavelength range is tuned to probe a specific redshift window.
5.7.1. Spectroscopic critical line mapping
The first dedicated critical line mapping using spectroscopy was conducted at Keck, using the long slit mode of LRIS (Santos et al. 2004). Nine intermediate redshift, massive clusters with good lensing mass models were carefully selected, and a number of long-slit observations was conducted, sliding the long slit across the critical line region thus achieving magnification factors generally greater than 10. Eleven emission-line candidates were located in the range 2.2 < z < 5.6 with Lyman-α as the line identification. The selection function of the survey takes into account the varying intrinsic Lyman-α line sensitivity as a function of wavelength and sky position. By virtue of the strong magnification factor, these measurements provide constraints on the Lyman-α luminosity function to unprecedented limits of 1040 erg/s, corresponding to a star formation rate of 0.01 M⊙/yr. Combining these lensing results with other surveys, limited to higher luminosities, Santos et al. (2004) argue that there exists evidence for the suppression of star formation in low-mass halos, as predicted in popular models of galaxy formation. The highest redshift Lyman-α emitter discovered in this survey is the z = 5.576 pair in the cluster Abell 2218 (Ellis et al. 2001). High-resolution spectroscopic follow-up confirmed the lensing hypothesis of the LRIS discovery by identifying the second image. The unlensed source appears to be a very faint source with (I ∼ 30)and is compact in nature (< 150 h65−1 pc). This source is a promising candidate for an isolated ∼ 106 M⊙ system seen likely producing its first generation of stars close to the epoch of reionization.
Pushing to higher redshifts than z > 7 requires an infra-red spectrograph. In a challenging experiment, Stark et al. (2007) blindly surveyed the critical line region of nine massive clusters using the Keck/NIRSPEC long slit. The magnification boost ranges from 10 to 50 × for a background galaxy between ∼ 8 < z < ∼ 10, thus pushing the sensitivity limits to unprecedented low fluxes (1041 - 1042 erg/s) for this redshift range. This survey identified six promising (> 5 σ) candidate Lyman-α emitters that lie between z = 8.7 and z = 10.2. Lower redshift line interpretations were mostly excluded through the non-detection of secondary emission in further spectroscopy undertaken with LRIS and NIRSPEC. Nonetheless, it is considered plausible that at least two of the candidates are likely at z ∼ 9. If true, then given the small volume surveyed, this suggests there is an abundance of low-luminosity star-forming sources at z ∼ 8−10 that could provide a significant proportion of the UV photons necessary for cosmic reionization. A parallel study was conducted using the SINFONI 3D spectrograph at VLT, and three of the Keck/NIRSPEC candidates were re-observed - as part of the SINFONI critical line mapping program. However, no confirmation of the Keck/NIRSPEC detected lines was found, casting some doubt on the real redshifts of these particular sources. The results of this survey are presented in Clement et al. (2011). Future 8-10m class instruments such as MUSE in the visible and MOSFIRE, KMOS and EMIR in the near infrared should, thanks to their higher multiplexing, provide new opportunities to further conduct critical line surveys and find more robustely numerous high-redshift Lyman-α emitters.
An alternative to direct spectroscopy of Lyman-α emitters, is to conduct narrow-band imaging. Although this technique has been very popular in blank fields, only a few such observations have been conducted in the direction of cluster cores. Hu et al. (2002) have discovered a redshift z = 6.56 galaxy lying behind the cluster Abell 370 (Figure 37). The object nicknamed HCM-6A was found in a narrow-band imaging survey using a 118 Å bandpass filter centered at 9152 Åusing LRIS on the Keck telescope. At the time of discovery, HCM-6A was the first galaxy to be confirmed at redshift z > 6 (its observed equivalent width is 190 Å, with a flux of 2.7 10−17 erg/cm2/s). Using the detailed lensing model of this cluster, a lensing amplification factor of 4.5 was estimated as the source is situated about 1 arcminute away from the cluster center. This discovery suggested that the re-ionizing epoch of the Universe lies beyond z ∼ 6.6. Follow-up of this source with Spitzer (Chary et al. 2005) and in millimeter with MAMBO-2 (Boone et al. 2007 - which provided an upper limit at 1.2mm) have helped derive some physical parameters with relatively high accuracy considering the distance of this source. Even more ambitious was the narrow J-band filter NB119 survey (corresponding to Lyman-α at z ∼ 9) nicknamed the ‘z equals nine' (ZEN) survey conducted towards three massive lensing clusters: Abell clusters A1689, A1835 and AC114 (Willis et al. 2008). However, no sources consistent with a narrow-band excess were found and no detection in bluer deep optical was reported. The total coverage of the ZEN survey sampled a volume at z ∼ 9 of approximately 1700 co-moving Mpc3 to a Ly-α emission luminosity of 1043 erg/s. The limits from this survey still offer the best constraints at this redshift.
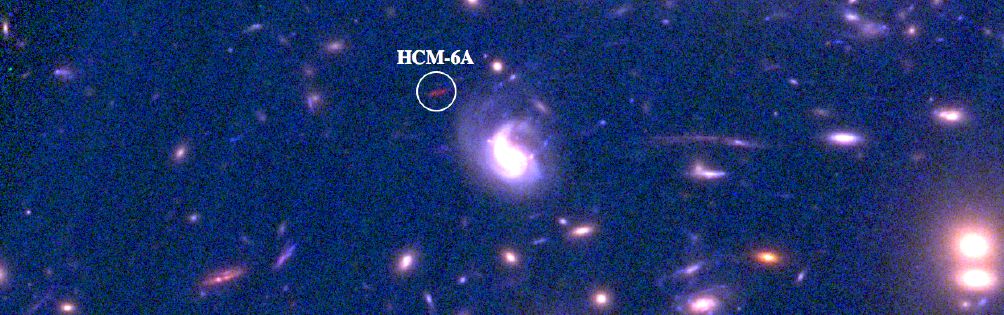 |
Figure 37. HST (ACS+WFC3) color V, I, J view of the HCM-6A z = 6.56 Lyman-α emitter located near the core of the Abell 370 cluster. Note the strong detection in the F110W (J-band) filter and its bimodal light distribution. The region shown covers 60” × 20”. |
As the number density of Lyman-break galaxies (at 3 < z < 3.5) is typically half a galaxy per square arcminute down to R = 25 (Steidel et al. 1996), a massive cluster will likely magnify one of them, and if we consider a wider range in redshift, the probability that one of them is multiply imaged is almost guaranteed. The first giant arc in Cl 2244-04 at z = 2.24 is considered to be the first Lyman-break galaxy detected in a cluster lens, although at the time of its discovery in the late 80's, this galaxy was not classified as such. As part of the CNOC survey, Yee et al. (1996) identified a “proto-galaxy” at z = 2.72, the galaxy cB58 in the cluster MS1512+36. Interestingly, they assumed that this object although being very close to the cluster center was unlikely to be lensed. But soon after, Seitz et al. (1998) demonstrated that cB58 was highly lensed, magnified by more than a factor of 50, thanks to the identification of its counter image. The estimate of such a high magnification led to a number of follow-up studies at high spectral resolution to further constrain the physical properties of this high-redshift galaxy (e.g. Pettini et al. 2002). At about the same time, the triple arc at z = 2.515 in Abell 2218 (Ebbels et al. 1996) was the first recognized Lyman Break galaxy lensed by a massive cluster, however its magnification is only ∼ 15 × , much less than that of cB58. Shortly afterward in the course of a spectroscopic cluster galaxy survey of MS1358+62, Franx et al. (1997) discovered a Lyman-break galaxy at z = 4.92 multiply imaged by the cluster. Further study and modeling by Swinbank et al. (2010) derived a magnification factor for the brightest image of 12.5 ± 2. At the time of discovery the arc in MS1358+62 was the most distant galaxy known. In the massive cluster Abell 2390, Frye & Broadhurst (1998) and Pelló et al. (1999) independently found a z = 4.04 pair, strongly lensed by the cluster. These high-redshift discoveries have demonstrated the potential of discovering even higher redshift galaxies lensed by massive clusters. Thanks to deep F850LP/ACS data, following-up the z = 5.56 Lyman-α galaxy pair of Ellis et al. (2001), Kneib et al. (2004) found an i-band dropout detected in z-band (see Figure 38). Detection with NICMOS confirmed a z ∼ 6.8 redshift, however a NIRSPEC/Keck spectrum failed to detect a Lyman-α line, but Spitzer IRAC 3.6 and 4.5 micron detections (Egami et al. 2005) provided strong constraints on the age of the underlying stellar population, making it one of the best studied objects at this redshift.
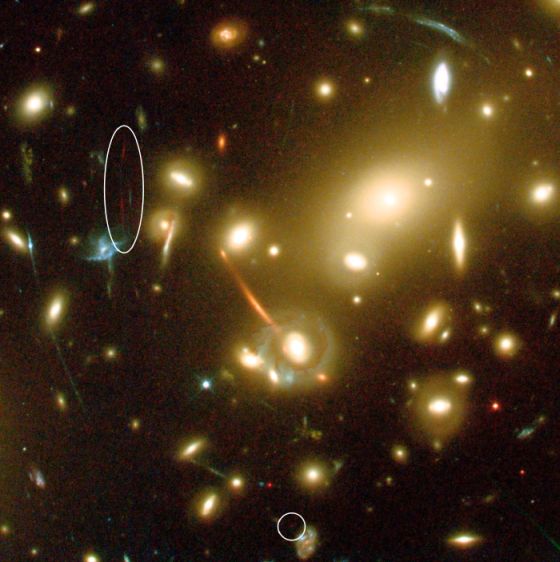 |
Figure 38. HST ACS color V, I, z view of Abell 2218 showing the triply-imaged Lyman-break galaxy at z ∼ 6.8 (Kneib et al. 2004). |
Using the ESO/VLT instruments FORS and ISAAC, a deep imaging survey of the clusters AC114 and A1835 was conducted by Richard et al. (2006) to search for lensed optical and near infrared dropout galaxies. In this work, they identified 26 optical dropout candidates in both A1835 and AC114 (with H ∼ 23.5 − 24.0). Half of these candidates show an SED compatible with star-forming galaxies at z > 6, and 6 of them are likely intermediate-redshift extremely red objects based on luminosity considerations. With this dataset a first attempt was made to characterize the luminosity function of these high-redshift galaxies, that are not well constrained by deeper HST/NICMOS observations of the HUDF (Hubble Ultra Deep Field). This work lead to the study by Richard et al. (2008) of a further 6 massive clusters with HST using the NICMOS camera and complemented by Spitzer observations. The survey yielded 10 z-band and 2 J-band dropout candidates to photometric limits of J110 ∼ 26.2 AB (5σ). By taking into account the magnifications afforded by the clusters, they probed the presence of z > 7 sources to unlensed limits of J110 ∼ 30 AB, fainter than those charted in the HUDF. Taking into account the various limitations of this work, they concluded that about half of the sample of z-band dropouts are at high-redshift. An ambitious infrared spectroscopic campaign undertaken with the NIRSPEC spectrograph at the Keck Observatory for seven of the most promising candidates failed to detect any Ly-α emission.
Behind Abell 1689, using HST/NICMOS Bradley et al. (2008) found a bright H = 24.7 z ∼ 7.6 galaxy candidate: A1689-zD1. This source is 1.3 mag brighter than any known z850-dropout galaxy (thanks to a cluster magnification factor of ∼ 9.3×). Nevertheless, no spectroscopic observations have yet confirmed the redshift of this candidate. In the more recent years, discoveries have been reported using either the ground based ESO/Hawk-I infrared imager (Laporte et al. 2011) or the new WFC3 camera installed in May 2009 onboard HST (Bradley et al. 2011; Kneib et al. 2011; Paraficz et al. 2012). In the long term, the James Webb Space Telescope (JWST) and the Extremely Large Telescopes will uncover large numbers of these very high-redshift systems, enabling the study of their sizes, morphologies and physical parameters (e.g. Wyithe et al. 2011; Salvaterra et al. 2011).
5.9. Far Infra-Red Lensing Surveys
With the launch of the Herschel Space Observatory in May 2009, a new window to the Universe has been opened. The Herschel Lensing Survey (HLS) conducted deep PACS and SPIRE imaging of 44 massive clusters of galaxies. These observations complement the observation of 10 massive clusters by the GTO teams. In particular, it is foreseen that the strong gravitational lensing power of these clusters will enable penetration through the confusion noise, which sets the ultimate limit on our ability to probe the Universe with Herschel. Although the analysis of this large dataset is still in progress, some early results were presented in the A&A Herschel special issue in spring 2010. In particular, Egami et al. (2010) summarized the major results from the science demonstration phase observations of the Bullet cluster (z = 0.297). The study of two strongly lensed and distorted galaxies at z = 2.8 and 3.2 and the detection of the Sunyaev-Zel'dovich (SZ) effect increment of the cluster with the SPIRE data have been reported.
By looking at Abell 2218, Altieri et al. (2010) studied the population of intrinsically faint infrared galaxies that lie below the sensitivity and confusion limits using ultra-deep PACS 100 and 160 micron observations (Figure 39). They derived (unlensed) source counts down to a flux density of 1 mJy at 100 micron and 2 mJy at 160 micron. In particular, the slope of the counts below the turnover of the Euclidean-normalized differential curve could be constrained in both bands and was found to be consistent with most of the recent evolutionary models. By integrating the number counts over the flux range accessed by exploiting lensing by Abell 2218 they retrieved a cosmic infrared background surface brightness of ∼ 8.0 and ∼ 9.9 nW/m2/sr, in the 110 and 160 micron bands respectively. By combining the Abell 2218 results with wider/shallower fields, the source fluxes correspond to ∼ 60% and ∼ 90% of the DIRBE cosmic infrared background at 100 and 160 micron. These first Herschel results from HLS and the GTO sample will certainly expand as the data are getting analyzed and we can envision numerous follow-up observations at optical and near-infrared wavelengths as well as with ALMA.
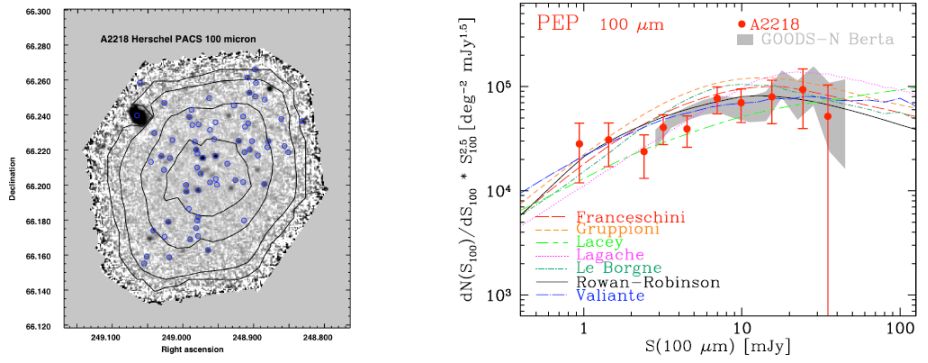 |
Figure 39. (Left) PACS 100 µm map toward Abell 2218 with lensed and foreground sources marked with blue circles, other sources are identified cluster members. Overlaid contours in black show the rms contours at 0.7, 1.0, 2.0 and 4.0 mJy. (Right) Number counts at 100 micron with lensing correction (red filled circles), normalized to the Euclidean slope , against the prediction of various synthetic counts models. Errors refer to pure Poisson statistics at 68% C.L. GOODS-N counts are contrasted in the shaded area (from Berta et al. 2010). (Figures from Altieri et al 2010). |
As part as the second call for observations another interesting lensing search has been implemented in the Herschel observing program to find a larger number of exceptionally bright lensed galaxies such as the one found by Swinbank et al. (2010). This project is aiming to conduct a SPIRE snapshot survey of ∼ 300 X-ray-selected massive galaxy clusters to discover the few extreme magnified objects that will then be very easy to follow-up at various wavelengths for an in-depth study. Although this survey is not yet finished, a number of highly amplified SPIRE sources have been identified, and intensive multi-wavelength follow-up are in progress.
5.10. Cluster Lensed Supernovae
In the last two decades, Supernovae (SNe) have been used for several astrophysical and cosmological applications. In particular, core collapse SNe trace the star formation history while the standard candle property of Type Ia SNe can be used for probing the expansion history of the Universe (e.g. Riess et al 1998, Perlmutter et al 1999, Amanullah et al. 2010). One of the focus on current SNe research is to probe the distant Universe. However, one strong limitation is the light collecting power of existing telescopes.
A possible alternative to current investigation is to target these SNe in the field of view of massive clusters. Although, the idea is not new and was first discussed by Narasimha & Chitre (1988) and then by Kovner & Paczynski (1988), it is only recently that SNe observations in cluster fields has become more popular (Kolatt & Bartelmann 1998, Sullivan et al. 2000; Gal-Yam et al. 2002). The most interesting locations are of course the strong lensing regions of clusters where the amplification is the largest, and were SNe could be multiply imaged offering the possibility to measure the time delay between the different images.
At first SN searches were done at optical wavelengths where SNe typically emit most of their light. For example, Gal-Yam et al. (2002) using archival HST imaging of 9 clusters, in which they discovered two or three likely cluster SNe and three other SNe, with one background to a cluster at redshift z = 0.985. More recently, Sharon et al (2010) in a dedicated SNe HST multi-epoch ACS I-band survey of 16 massive clusters (ranging from z = 0.5 to z = 0.9) have discovered 24 SNe, with 8 of them being background to these clusters (the highest SN redshift found is at z = 1.12). However, none of those lensed SNe are in the regions of multiple-images. At even higher cluster redshift z ∼ 1, the Supernova Cosmology Project (PI: Perlmutter) has targeted 25 clusters through an HST multi-epoch program in which nine clusters and twenty other (foreground or background) SNe have been discovered (Dawson et al. 2009). However, the main focus of these cluster multi-epoch surveys was essentially geared toward the discovery and study of cluster type Ia SNe, and thus were not optimized to benefit from the cluster lens magnification.
On the contrary, Gunnarsson & Goobar (2003) presented the feasibility of detecting high-z SNe along the line of sight of massive clusters, in particular focusing on the SNe detection in the near-infrared. Using a dedicated VLT/ISAAC multi-epoch SN survey, Stanishev et al. (2009) and Goobar et al. (2009) reported the discovery of a highly amplified SN at z ∼ 0.6 behind the well-studied Abell 1689 cluster. More recently, using the new VLT/Hawk-I infrared camera, Amanullah et al (2011) found one of the most distant SNe ever found at z = 1.703 (measured through X-Shooter spectroscopy of the galaxy host) thanks to the large magnification (∼ 4.3 ± 0.3) of the massive cluster Abell 1689. This study demonstrated that further SNe follow-up may lead to important new discoveries.