


In the 1920's and 30's the systematics of the HR diagram and the "theory of the spectral type" paved the way for the modern theories of stellar atmospheres and interiors. It is likely that current efforts to discover the basic physical parameters behind the more successful classification systems will likewise advance our understanding of the nature and evolution of galaxies. In this sense the best classification system is that which is most closely correlated with the most basic physical parameters such as mass, angular momentum, gas fraction, etc. - or, perhaps, with the largest possible number of measurable derived parameters such as absolute luminosity, color, rotation velocity, hydrogen content, etc.
Principal component analysis as well as multiple correlation studies (see de Vaucouleurs 1974 for references) have already indicated that 2 or 3 parameters are dominant. For example, 2 variables contribute more than 80 percent of the total variance in a 6-variable analysis of 31 galaxies (Brosche 1973). Pending the results of new analyses of larger samples based on improved data, the dependence on T and L of various measured parameters has been investigated anew from RC2 data.
Let k(r*) be the fraction of the total luminosity LT
emitted within (equivalent) radius r*, k(r*) = L(r*) / LT,
with L(r*) = 2

 0 I(r*) r* dr*. If
r*1, r*e, r*3 are the radii such that
k(r*1) = 1/4, k(r*e) = 1/2, k(r*3) =
3/4, then C21 = r*e / r*1 and
C32 = r*3 / r*e are light concentration
indices. Such indices have been derived from detailed surface
photometry for some 120 galaxies
(de Vaucouleurs 1962,
1977c;
Fraser 1972,
1977;
de Vaucouleurs and
Agüero 1973).
For greater
simplicity consider only the combined concentration index
C31 = C21C32. The correlation between
C31 and morphological type T is shown in
Fig. 5. The large
scatter is caused by measuring errors, inclination effects and
structural details (e.g. SB vs. SA). A more precise relationship
emerges from a similar analysis of integrated magnitude-aperture
relations m(A) derived in RC2 from photoelectric photometry for some
1000 galaxies (Fig. 5).
0 I(r*) r* dr*. If
r*1, r*e, r*3 are the radii such that
k(r*1) = 1/4, k(r*e) = 1/2, k(r*3) =
3/4, then C21 = r*e / r*1 and
C32 = r*3 / r*e are light concentration
indices. Such indices have been derived from detailed surface
photometry for some 120 galaxies
(de Vaucouleurs 1962,
1977c;
Fraser 1972,
1977;
de Vaucouleurs and
Agüero 1973).
For greater
simplicity consider only the combined concentration index
C31 = C21C32. The correlation between
C31 and morphological type T is shown in
Fig. 5. The large
scatter is caused by measuring errors, inclination effects and
structural details (e.g. SB vs. SA). A more precise relationship
emerges from a similar analysis of integrated magnitude-aperture
relations m(A) derived in RC2 from photoelectric photometry for some
1000 galaxies (Fig. 5).

|
Figure 5. Correlations between concentration index C31 and morphological type t. Dots are for individual objects from detailed photographic photometry; dashed line is mean from photoelectric aperture photometry of ~ 1000 objects. |
Light concentration is highest for ellipticals (t = -5) following the r1/4 law (Section 3.1) and lowest for magellanic irregulars (t = +10) following the exponential law. The smooth, monotonic transition with morphological type t demonstrates the validity of the revised Hubble sequence. The concentration index is, of course, a measure of the varying bulge/disk ratio (Section 3.1) along the sequence, but it is more objective in that it does not presume any specific model for the light distribution nor its decomposition into 2 or more components.
Similar conclusions can be reached by considering the n index in Sérsic's (1968) formula
|
where m'' = m0 - 1.086n, and m = -2.5 log [0.921
m0 IS(m)
dm] is the integrated magnitude
within the isophote of area S; m0 is the surface magnitude
at the center. The exponent n varies with morphological type from n =
8 at type E (t = -5) to n = 2 at type Im (t = +10).
However, the scatter in the C(t) arid n(t) relations is too large to make either C or n acceptable quantitative substitutes for t. In particular inclination effects, possible differences between families (SA vs. SB) and varieties (r vs. s) at t = const. have not yet been investigated.
While concentration indices are structural parameters, color indices are population parameters. Total (or asymptotic) color indices (U - B)oT, (B - V)oT corrected for galactic extinction, internal absorption and redshift are listed in RC2 for, respectively, 583 and 953 galaxies.
For each morphological type the average intrinsic colors of normal galaxies are defined by the mean corrected colors CoT(t) obtained after iterative rejection of aberrant residuals (generally negative and caused by line emission) until the residual distribution function becomes quasi-normal. Within statistical errors, the normal colors < CoT > vary smoothly and monotonically with t (Fig. 6a, b) as expected from earlier work (Holmberg 1958, de Vaucouleurs 1961, G. and A. de Vaucouleurs 1972); in particular, the broad-based index (U - V)oT varies from 1.36 at t = -5 (E) to 0.04 at t = +10 (Im) (Fig. 7a). The monotonic variation of C(t) demonstrates again the basic validity of the revised Hubble system, and in particular confirms the order of the stages along the sequence (analogy with color-spectral type relation).

|
Figure 6. Correlations between mean corrected color indices (B - V)oT, (U - B)oT and morphological type t. Open circles: before rejection of aberrant values; filled circles: after rejection. |

|
Figure 7. Correlation between mean corrected color index (U - V)oT and morphological type t. (a) normal scale. (b) probability scale. |
A simple, convenient analytical expression of the functional relation
CoT(t) is by means of a Laplace-Gauss integral
(Fig. 7b) with mean < (U - V)oT >
= 0.70 at < t > = 3, total amplitude 1.40, and dispersion
 t = 1.85. The
observed mean colors are listed in
Table 4a; the adopted values
interpolated as in Fig. 7b are listed in
Table 4b. The color-color
relation is very nearly linear (Fig. 8); in the
spirit of principal
component analysis it is, therefore, convenient to replace the
original variables x1 = (B - V)oT,
x2 = (U - B)oT by the dominant
variable
t = 1.85. The
observed mean colors are listed in
Table 4a; the adopted values
interpolated as in Fig. 7b are listed in
Table 4b. The color-color
relation is very nearly linear (Fig. 8); in the
spirit of principal
component analysis it is, therefore, convenient to replace the
original variables x1 = (B - V)oT,
x2 = (U - B)oT by the dominant
variable  1 =
x1 cos
1 =
x1 cos  + [x2 + K]
sin and its associated
rectangular variable
2 =
-x1 sin +
[x2 + K] cos , where
=
56°.85 and K = 0.8913. The values of
< 1 >,
< 2 > are
also given in Table 4b; note that
< 2 > is
everywhere less than 0.01 mag. The total range of
< 1 > is
about 1.00 from 0.65 to 1.65; a normalized
principal color parameter
*1 may then
be defined by
*1 =
1 - 0.65,
varying from 0 to 1 when t
varies from E to Im. Except for observational error and cosmic scatter
(mainly due to line emission, see below) this normalized color
parameter could, in principle, be used as an objective measure (among
others) of Hubble stage t.
+ [x2 + K]
sin and its associated
rectangular variable
2 =
-x1 sin +
[x2 + K] cos , where
=
56°.85 and K = 0.8913. The values of
< 1 >,
< 2 > are
also given in Table 4b; note that
< 2 > is
everywhere less than 0.01 mag. The total range of
< 1 > is
about 1.00 from 0.65 to 1.65; a normalized
principal color parameter
*1 may then
be defined by
*1 =
1 - 0.65,
varying from 0 to 1 when t
varies from E to Im. Except for observational error and cosmic scatter
(mainly due to line emission, see below) this normalized color
parameter could, in principle, be used as an objective measure (among
others) of Hubble stage t.
|
Figure 8. Mean color-color relation
(a) mean points in
usual variables, (b) interpolated values in principal variables
|
| t | < (B - V)oT > | m.e. | 1 | n | < (U - B)oT > | m.e. | 1 | n |
| -5 | 0.894 | 0.003 | 0.033 | 134 | 0.471 | 0.006 | 0.057 | 98 |
| -3 | .863 | .006 | .051 | 67 | .462 | .007 | .039 | 30 |
| -2 | .856 | .005 | .049 | 82 | .419 | .013 | .092 | 51 |
| -1 | .808 | .011 | .071 | 42 | .374 | .018 | .078 | 19 |
| 0 | .804 | .011 | .053 | 23 | .180 | .067 | .298 | 20 |
| 1 | .704 | .015 | .097 | 41 | .267 | .016 | .070 | 18 |
| 2 | .737 | .009 | .057 | 40 | .226 | .022 | .106 | 24 |
| 3 | .657 | .010 | .080 | 70 | .060 | .017 | .123 | 51 |
| 4 | .564 | .008 | .066 | 70 | - .042 | .015 | .104 | 47 |
| 5 | .511 | .008 | .070 | 81 | - .072 | .016 | .103 | 44 |
| 6 | .441 | .014 | .080 | 34 | - .190 | .024 | .110 | 21 |
| 7 | .444 | .020 | .079 | 16 | - .213 | .039 | .102 | 7 |
| 8 | .418 | .027 | .098 | 13 | - .218 | .028 | .085 | 9 |
| 9 | .353 | .019 | .087 | 20 | - .337 | .028 | .087 | 10 |
| 10 | 0.370 | 0.015 | 0.079 | 27 | -0.331 | 0.025 | 0.108 | 19 |
| 1 After 8 cycles of
2 rejection of large
residuals.
| ||||||||
| t | < (B - V)oT > | < (U - B)oT > | < 1 >
| < 2 >
| < *1 >
| ð< *1 >
|
| -6 | 0.892 | 0.486 | 1.641 | +0.006 | 0.991 | 0.009 |
| -5 | .888 | .478 | 1.632 | + .004 | .982 | .015 |
| -4 | .881 | .465 | 1.617 | + .004 | .967 | .021 |
| -3 | .870 | .447 | 1.596 | + .003 | .946 | .031 |
| -2 | .854 | .420 | 1.565 | + .002 | .915 | .047 |
| -1 | .830 | .380 | 1.518 | .000 | .868 | .063 |
| 0 | .797 | .326 | 1.455 | - .002 | .805 | .083 |
| 1 | .753 | .256 | 1.372 | - .003 | .722 | .100 |
| 2 | .699 | .171 | 1.272 | - .004 | .622 | .113 |
| 3 | .637 | .077 | 1.159 | - .004 | .509 | .112 |
| 4 | .575 | - .017 | 1.047 | - .003 | .397 | .104 |
| 5 | .517 | - .103 | 0.943 | - .002 | .293 | .086 |
| 6 | .469 | - .174 | 0.857 | .000 | .207 | .066 |
| 7 | .431 | - .228 | 0.791 | + .002 | .141 | .048 |
| 8 | .404 | - .268 | 0.743 | + .003 | .093 | .034 |
| 9 | .386 | - .296 | 0.709 | + .002 | .059 | .023 |
| 10 | .373 | - .315 | 0.686 | + .003 | .036 | 0.014 |
| 11 | 0.365 | -0.327 | 0.672 | +0.003 | 0.022 | |
|
< *1 > =
< 1 > - 0.65
| ||||||
Individual galaxies have corrected colors CoT which differ from the mean for their estimated type, that is, leave color residuals

|
Previous work
(de Vaucouleurs 1961,
G. and A. de
Vaucouleurs 1972)
has shown that the cosmic scatter is mainly along the color-color
sequence, i.e., along the
1 axis,
while the scatter
perpendicular to it, i.e., in
2, is due
mainly to
observational errors. This is again demonstrated in
Fig. 9 where the
 1,
2 residuals
are plotted for each type. The scatter in
2 is < 0.15 mag
(2
1,
2 residuals
are plotted for each type. The scatter in
2 is < 0.15 mag
(2
 0.05), consistent with the
observational m.e.'s of the original RC2 colors (0.03 in B - V, 0.04
in U - B). The
1 residuals
are generally < 0.25 mag
(1
0.08), significantly in excess of
measuring errors. Part of this scatter may be introduced by
classification errors, especially near the middle of the sequence (0 <
t < 6) where
ð1 /
ðt 0.10 mag per stage
unit and (t)
0.75
(Brosche 1973),
but the large negative residuals are clearly
caused by line emission, particularly among types earlier than Sc (t <
5) (for a more detailed discussion see
G. and A. de
Vaucouleurs 1972).
0.05), consistent with the
observational m.e.'s of the original RC2 colors (0.03 in B - V, 0.04
in U - B). The
1 residuals
are generally < 0.25 mag
(1
0.08), significantly in excess of
measuring errors. Part of this scatter may be introduced by
classification errors, especially near the middle of the sequence (0 <
t < 6) where
ð1 /
ðt 0.10 mag per stage
unit and (t)
0.75
(Brosche 1973),
but the large negative residuals are clearly
caused by line emission, particularly among types earlier than Sc (t <
5) (for a more detailed discussion see
G. and A. de
Vaucouleurs 1972).

|
Figure 9. Color residuals in
|
For ellipticals and lenticulars (t < 0) there is a well-known correlation between integrated colors and absolute magnitude which can be used as a distance indicator (de Vaucouleurs 1961, see de Vaucouleurs 1974 for references). However, compact dwarfs (t = -6) seem to have normal colors (Faber 1971).
Curiously, there is no luminosity effect in the color residuals for
spirals (t  0) as shown by
Table 5 confirming previous work
(G. A. de
Vaucouleurs 1972);
a weak apparent correlation between color
and luminosity class is present only if the original Hubble types Sc
and Irr are used
(de Vaucouleurs 1961,
Iye and Kodaira 1976).
0) as shown by
Table 5 confirming previous work
(G. A. de
Vaucouleurs 1972);
a weak apparent correlation between color
and luminosity class is present only if the original Hubble types Sc
and Irr are used
(de Vaucouleurs 1961,
Iye and Kodaira 1976).
| L | 1 | 2 | 3 | 4 | 5 | 6 | 7 | 8 |
| < (U -
V)oT >
| +0.04 | +0.01 | +0.01 | +0.04 | -0.00 | +0.01 | +0.02 | -0.02 |
| 1 1
| 0.03 | 0.06 | 0.03 | 0.04 | 0.05 | 0.05 | 0.10 | 0.11 |
| N | 24 | 18 | 49 | 20 | 17 | 6 | 6 | 5 |
| 1
1 is s.d. of
individual values from mean.
| ||||||||
Likewise, there is little indication of a systematic dependence of
color residuals on RDDO class (S0, A or S). According to
van den Bergh (1976)
the mean corrected color C0 (from RC1) decreases (at
constant Hubble type) from S0 to A to S. There is only a slight
tendency in this sense in the RC2 data
(Table 6, left half),
but no definite effect is indicated by the color residuals
(B - V)oT at t
= const. (Table 6, right half).
| RDDO | S0 | A | S | RDDO | < (B -
V)oT >
| n |
| a | 0.83 (9) | 0.82 (4) | 0.845 (2) | S0a-b | -0.02 | 14 |
| ab | 0.805 (2) | 0.825 (2) | 0.75 (7) | Aa-ab | -0.02 | 22 |
| b | 0.84 (3) | 0.74 (15) | 0.715 (30) | Sa-bc | +0.06 | 46 |
| bc | - | 0.57: (3) | 0.63 (8) | Sc | -0.035 | 32 |
| c | - | 0.495 (33) | ||||
| 1 < (B - V)oT > and (n)
(left);
< (B - V)oT >
at t = const. and n (right).
| ||||||
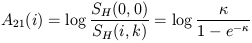
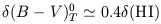
Let SH be the total flux density (in W m-2) in the 21 cm line of HI from a galaxy integrated over frequency and solid angle; the HI mass MH is given by

| (2) |
if  = distance of galaxy is in
Mpc. Values of log SH
where SH is in 10-28 W m-2 are listed
in RC2 for 474 galaxies with an average m.e.
0.07.
= distance of galaxy is in
Mpc. Values of log SH
where SH is in 10-28 W m-2 are listed
in RC2 for 474 galaxies with an average m.e.
0.07.
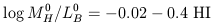
By analogy with the optical case, define a "magnitude" corresponding to SH, corrected for self-absorption,
| (3) |
where
| (4) |
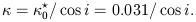
The constant is chosen to give approximately equal optical and 21 cm magnitudes when SH is in 10-28 W m-2 units; the 21 cm self-absorption is given by
| (5) |
(Heidmann, Heidmann
and de Vaucouleurs 1971)
for a galaxy whose spin
axis is inclined i degrees to the line-of-sight, if the effective
optical depth  is
is
| (6) |
The inclination can be replaced by the apparent axis ratio R as
explained in RC2 where the individual values of A21 are
given. The validity of equation (5) with the adopted value of
*0 has been verified
by Balkowski (1973).
Then the hydrogen index, defined as HI = mo21 -
BoT, is a measure of the ratio of the mass of neutral
hydrogen to the corrected B-band optical luminosity of the
galaxy. Values of HI are given in RC2 for 240 galaxies. If
MB( ) = +5.41, the
normalized hydrogen/luminosity ratio is given by
) = +5.41, the
normalized hydrogen/luminosity ratio is given by
| (7) |
where MoH and LoB are in solar
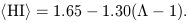
units. The average value of this ratio varies with morphological type
from ~ 0.07 for t  3 to ~ 0.5 for t
7 (Sd-Im) as shown by
Fig. 10. Late-type spirals contain about 7
times as much hydrogen per
unit of optical luminosity as do early-type spirals. However, at t =
const., HI and g = MH / LB vary also with color
and luminosity; that is, HI is a function of both T and L and is
actually more closely correlated with the composite luminosity index
3 to ~ 0.5 for t
7 (Sd-Im) as shown by
Fig. 10. Late-type spirals contain about 7
times as much hydrogen per
unit of optical luminosity as do early-type spirals. However, at t =
const., HI and g = MH / LB vary also with color
and luminosity; that is, HI is a function of both T and L and is
actually more closely correlated with the composite luminosity index
 than with either of its
components. From 288 galaxies for which
both HI and are known, a
linear correlation is indicated
(Fig. 11)
than with either of its
components. From 288 galaxies for which
both HI and are known, a
linear correlation is indicated
(Fig. 11)
| (8) |
The residuals (HI) = HI - < HI >
are weakly correlated with the
color residuals
1 [or
(B - V)oT for a
larger sample] in both the high and low luminosity groups
( < 1.0,
1.0)
(Fig. 12a, b): in the mean
| (9) |
but with a large scatter, too large to permit using HI and (B -
V)oT as a substitute for
.
A small number of galaxies stand out as unusually hydrogen-deficient
for their type and luminosity
(HI > +1.2,
log
MoH / LoB < -0.5); examples
at
<
1.0 are NGC 613, 2613, 3627, 4321, 4501, 5247, 5676; two of them
(NGC 4321, 4501) are members of the Virgo cluster which has led to the
speculation that galaxies in clusters may be depleted of their
interstellar gas through encounters
(Davies and Lewis
1973,
Bottinelli and
Gouguenheim 1974);
however, the others are members of pairs (NGC 3627, 5676) or are isolated. Two
examples at > 1.0 are the
LMC and the Pegasus dwarf = DDO 216; one
might speculate that the LMC lost half or more of its hydrogen to the
magellanic stream and/or to the LMC - SMC common envelope (but, perhaps,
the integrated HI flux from the LMC should first be checked by new
observations).

|
Figure 10. Mean hydrogen index HI and hydrogen/luminosity ratio g = MoH / LoB versus morphological type t. Circles are mean points. Dashed lines show trend of luminosity effects (schematic). |

|
Figure 11. Mean hydrogen index HI versus
luminosity index |

|
Figure 12. Correlations between residuals
in hydrogen index |
Conversely, a small number of galaxies have unusually high
hydrogen/luminosity ratios
(HI < -1.2,
log
MoH / LoB > +0.5). Examples
at <
1.0 are NGC 628, 7640 and IC 342; in the latter two cases HI is
uncertain; one might suspect that the internal extinction correction
A(i) (N 7640) or the galactic extinction correction
AB (IC 342) were overestimated or, perhaps, that because of
obscuration the
luminosity classes are in error. An example at
1.0 is NGC 4244,
an edge-on Scd whose luminosity classification and internal extinction
correction are unavoidably uncertain.
The radio continuum emission of most normal galaxies can be
characterized by the integrated monochromatic flux density
SR at the standard frequency
 R
1410 MHz and
by 2 spectral gradients
R
1410 MHz and
by 2 spectral gradients  =
-ð log S / ð log ,
- at
<
R,
+ at
>
R. Values of
log SR (in 0.01 Jy = 10-28 W m-2
Hz-1) are given in RC2 for 279 galaxies with m.e.'s of 0.04
to 0.10 for sources stronger than 0.1 Jy. Spectral indices are given
for 253 (-) and 239
(+) objects.
=
-ð log S / ð log ,
- at
<
R,
+ at
>
R. Values of
log SR (in 0.01 Jy = 10-28 W m-2
Hz-1) are given in RC2 for 279 galaxies with m.e.'s of 0.04
to 0.10 for sources stronger than 0.1 Jy. Spectral indices are given
for 253 (-) and 239
(+) objects.
Following Hanbury Brown and Hazard (1961) a radio magnitude may be defined by

| (10) |
where the constant was chosen to roughly match radio and optical magnitudes. The radio magnitude corrected for redshift is

| (11) |
where R =
(a- + a+) / 2 is the
average spectral index near
=
R. For z < 0.04 (cz <
12,000 km s-1) a close enough approximation is
|
The correction is < 0.05 mag for z < 0.04 and normal values of
R (0 <
R < 1). By analogy
with the color index define the (corrected) radio index as
|
where BoT is the corrected total B magnitude. Values of RI are given in RC2 for 174 galaxies ranging from -4.2 for strong radio galaxies (3C 88, 3C 75, NGC 7236 - 37) to +5.0 for the weakest detectable normal galaxies (M 33, NGC 55, 3368).
The mean radio index < RI > = +2.65 is essentially constant and
independent of morphological type for t
2 with a large scatter
(
0.5 to 1.5 mag)
(Fig. 13a). In other words the emission ratio is
independent of type for normal spirals, whose radio and optical
emissions are dominated by the disk component. For t < 0 (E, L types)
< RI > = -1.25, indicating for this selected sample (dominated
by nuclear and/or double sources) a radio/optical emission ratio some
36 times stronger than for the average spiral
( = 2.5 mag).
The mean spectral index
< - > is almost completely
independent of type (Fig. 13b) with
< - > = 0.70 for all
types, but < + > =
0.80 for t < 0 and t > 6, and 0.95 for
0 t
5.

|
Figure 13. (a) Mean radio index RI
(above) and (b) mean spectral indices
|
Continuum radio emission and its spectral distribution are clearly not
good indicators of morphological type. However, for spirals which have
a strong nuclear radio source, a loose correlation between the
monochromatic power at R
and Byurakan nuclear class has been noted by
van der Kruit (1973)
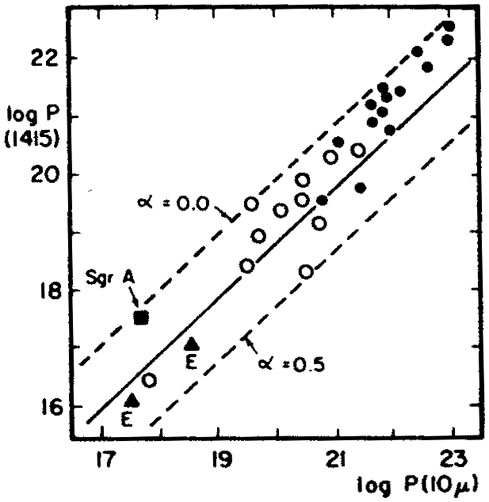
(Fig. 14). The most powerful
sources (log P > 21) are generally found in Seyfert nuclei (BYU N = 5)
(Fig. 15).

|
Figure 14. c Radio power at 1415 MHz and Byurakan nuclear class N, after van der Kruit (1973). |
|
Figure 15. Correlation between radio power
at 1415 MHz and infrared emission at 10µ, after
van der Kruit (1973).
Filled circles refer
to Seyfert galaxies. Two values of radio/infrared spectral index
|
2.5 Ellipticities
In a large collection of galaxies a few of each type will be seen
almost exactly edge-on; the maximum apparent flattening measured by
log R = log a/b must be about equal to the true (maximum) flattening
log R0 = log a/c of a given type
(Fig. 16). This maximum
increases from log R(max)
a) Elliptical galaxies have true ellipticities e = 1 - c/a = 1 -
q0 distributed normally about a mean
Figure 16. Correlation between maximum
observed ellipticity log R25 and morphological type.
b) Lenticular galaxies give evidence for 2 groups, a dominant group (~
90% of sample) with a prominent disk represented by < e > = 0.7 and
c) Spirals from S0/a to Sm have ellipticity distributions similar to
the lenticulars with a major group (~ 70% of sample) at < e > = 0.7 to
0.8 and a minor one (~ 30%) at < e >
d) Magellanic irregulars Im are distinctly less flat than Sc-Sd
spirals and may also be divided into a major group (60%) at < e >
This analysis suggests that the popular concept of the Hubble sequence
as a single angular momentum sequence is oversimplified; at each stage
t of the sequence there is a wide range of intrinsic ellipticities
and, therefore, of bulge/disk ratios
(Fig. 17). This conclusion is
consistent with the large scatter observed in the correlation between
type t and concentration index C31
(Section 2.1).
Figure 17. Trend of fractional luminosity
in spheroidal component
KI = LT(I) / LT as a function of
morphological type t for galaxies with different bulge/disk ratios
(schematic). Compare FIG. 20.
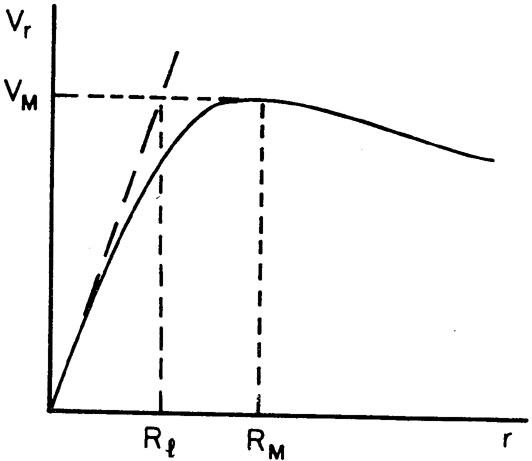
The inner part of the rotation curve of a normal galaxy is often well
approximated by a straight line (inflection tangent)
(Fig. 18).
Mayall (1960) and
Mayall and Lindblad
(1970)
have discussed the correlation
between the mean angular velocity < w > and radius Rl of
this "linear" branch of the rotation curve as a function of
morphological type. The lower angular velocities of barred spirals at
constant Rl and t suggested by this work needs
confirmation; if it is not an artifact due to preferential orientation
of the spectrograph slit along the bars it may be an important clue to
the dynamics of barred spirals.
Figure 18. Schematic rotation curve showing
definition of RM,
VM and "linear branch" Rl.
Because both Rl and w depend on some estimate of the
distance of the galaxy neither is suitable as an empirical
classification parameter. (See, however,
3.3.)
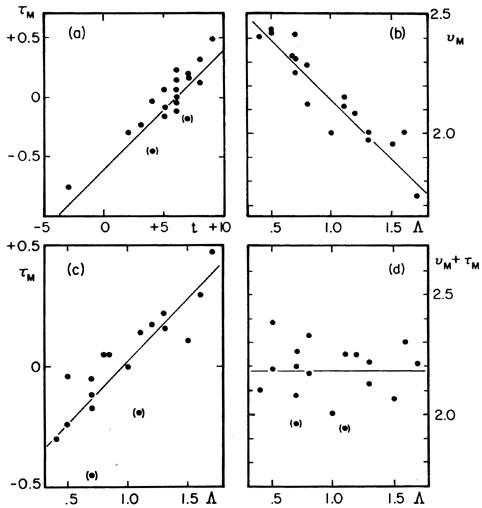
2.7 Maximum Rotational Velocities
Brosche (1971)
found that the maximum rotational velocity
VM is loosely correlated
(
Iye and Kodaira
(1976)
report a similar correlation
(
Actually, VM is better correlated with the luminosity index
The radius RM where V = VM is poorly defined;
nevertheless, recent data
(Huchtmeier 1975,
Wakamatsu 1976)
confirming earlier conclusions
(Brosche 1971)
indicate that
2RM / D0, where D0 is the corrected
face-on isophotal diameter in the RC2 system, is a rapidly varying
function of morphological type t (Fig. 19a) or
possibly of
is not (Fig. 19d) at least for spirals
(
Figure 19. Correlations between
Instead of VM, the "quasi-total" width W of the 21 cm line
in galaxies unresolved by the antenna beam can be used as an indicator
of absolute luminosity and distance
(Roberts 1969,
1975;
Balkowski et al. 1974;
Tully and Fisher 1975,
1977;
Sandage and Tammann
1974)
at least for disk systems of sufficient inclination (i > 20°). For
face-on systems the line width is a measure of the velocity dispersion
Remark: Both
is not (Fig. 19d) at least for spirals
(
In spheroidal systems where most of the kinetic energy is in random
motions rather than rotation and MT
2 not E 6.5 as printed in IAU 58, p. 13.
Back.
3 The large excess of E0 galaxies in
catalogues based on POSS prints is an artifact. Back.
0.3
(c/a = 0.5) for ellipticals to ~ 0.5
(c/a = 0.3) for lenticulars to ~ 0.5 to 0.7 (c/a
0.3 to 0.2) for
spirals Sa to Sd, and drops back to ~ 0.5 at Sm-Im. More precisely,
an analysis of the observed frequency function of apparent
ellipticities of the isophotal diameters of over 2000 galaxies
(de Vaucouleurs and
Pence 1973;
see also
de Vaucouleurs 1974)
leads to the following conclusions:
e
0.1; the flattest bona fide
ellipticals have e = 0.55, spherical galaxies (e
0) are rare or
absent. (3)

e
0.1, and a minor group (~ 10%)
with a dominant
spheroidal component having the same ellipticity as the ellipticals
< e > 0.35 with
e
0.05.
0.4. These two components
probably correspond to two classes of spirals (and lenticulars) having
respectively small and large bulge/disk ratios. The relative abundance
of the latter group apparently increases along the Land S sequences
(see Figs. 5 & 6 in
de Vaucouleurs 1974).
0.6
and a minor one (40%) at < e >
0.35. However, some barred irregulars
lack an optically visible disk (e.g. NGC 4214, 4449, 6822) and
treating bars (prolate spheroids) as oblate spheroids must vitiate the
statistics.

 -0.8) with morphological
type t, and for spirals (t 2)
-0.8) with morphological
type t, and for spirals (t 2)
(12)
-0.83)
between VM and luminosity class L for late-type spirals (t
4).
(Section 1.1) than with either of its
components; this is not surprising
since is correlated with the
mass via the f = M / L ratio and M
 V2M. A preliminary statistic from 20 systems
(Table 7) gives
V2M. A preliminary statistic from 20 systems
(Table 7) gives

(13)
NGC t
log VM log 2 RM
 M
M
 M +
M
M +
M
0045
8 1.6 2.00 2.20 +0.30
2.30
0224
3 0.5 2.43 2.95 -0.24
2.19
0253
5 - 2.31 2.20 -0.09
2.22
0300
7 1.3 1.97 2.47 +0.16
2.13
0598
6 1.0 2.00 2.76 0.00
2.00
0925
7 1.1 (2.15) (1.78) (-0.19)
(1.94)
2403
6 1.1 2.11 2.37 +0.14
2.25
3031
2 0.4 2.40 2.08 -0.30
2.10
3109
9 1.7 1.73 2.51 +0.48
2.21
3115
-3 - 2.44 1.10 -0.76
[1.68]
3359
5 0.8 2.12 1.85 +0.05
2.17
3521
4 0.7 (2.41) (1.48) (-0.45)
(1.96)
4236
8 1.5 1.95 2.30 +0.11
2.06
4244
6 1.3 2.00 2.25 +0.22
2.22
4631
7 1.2 2.08 2.20 +0.17
2.25
5194
4 0.5 2.42 1.98 -0.04
2.38
5236
5 0.7 (2.25) (1.90) (-0.17)
(2.08)
5457
6 0.7 2.31 2.4: -0.05:
2.26
6946
6 0.7 2.32 2.0: -0.12:
2.20
1342
6 0.8 2.28 2.4: +0.05:
2.33
1 Best observed systems from compilations by
Brosche (1971),
Huchtmeier (1975),
Wakamatsu (1976).
M
= log VM,
M = log 2
RM / D0.
, but
the scatter is too large to make it a useful classification index.
 0.4). More and better
data will be needed to establish whether this is a small sample
accident or a general property.
0.4). More and better
data will be needed to establish whether this is a small sample
accident or a general property.
M = log VM,
M log 2RM /
D0 and morphological type t or luminosity index
.
z normal to the
plane and it should not be used to
calculate VM or MT.
M = log
VM and M log
2RM / D0 are correlated with
(Fig. 19b,
c), but within the accuracy of the data
0.4). More and better
data will be needed to establish whether this is a small sample
accident or a general property.
2V R,
relations of the form V
MT
corresponding to f =
MT / LT
 V may be
expected to hold. Such relations are in fact observed for elliptical
galaxies and the spheroidal components of lenticulars and Sa-Sb spirals
(Poveda 1961,
Einasto 1972,
Faber and Jackson
1976).
The latter authors find LT
4V and
f
1/2T, but
both LT, which is distance dependent, and
V are known for too
few objects and too uncertain to use as a basis for quantitative
classification at the present time.
V may be
expected to hold. Such relations are in fact observed for elliptical
galaxies and the spheroidal components of lenticulars and Sa-Sb spirals
(Poveda 1961,
Einasto 1972,
Faber and Jackson
1976).
The latter authors find LT
4V and
f
1/2T, but
both LT, which is distance dependent, and
V are known for too
few objects and too uncertain to use as a basis for quantitative
classification at the present time.