


6.1.2 Observed LFs of High-Luminosity Radio Sources
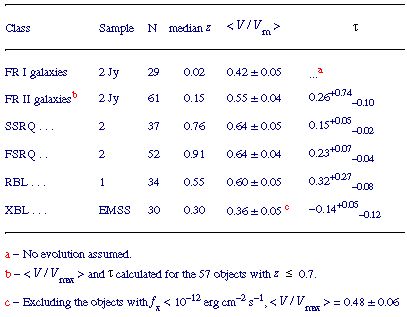
Given the 2 Jy sample as defined, we calculate the luminosity functions of
high-power radio sources as follows. First, we
fit an exponential pure luminosity evolution model to each
sample, by finding the evolutionary parameter which makes < V /
Vmax > = 0.5 and then testing the goodness of fit via a
KS test. The best-fit values of  for each sample are listed in Table 2, along
with median redshifts and < V / Vmax > values.
Each luminosity function was de-evolved using the appropriate
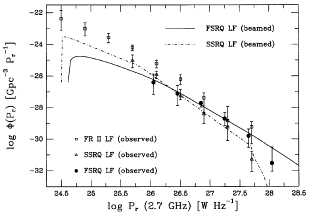
best-fit evolution. Figure 14 shows the
resulting local
luminosity functions at 2.7 GHz for FR IIs, SSRQ, and
FSRQ. (14)
for each sample are listed in Table 2, along
with median redshifts and < V / Vmax > values.
Each luminosity function was de-evolved using the appropriate
best-fit evolution. Figure 14 shows the
resulting local
luminosity functions at 2.7 GHz for FR IIs, SSRQ, and
FSRQ. (14)
The luminosity function of FSRQ LF (filled circles) is flattest and
extends to the highest luminosities.
The luminosity functions of SSRQ (open triangles;
Fig. 14) and
FR II galaxies (open squares) are similar in shape over the common range of
powers, but the SSRQ are lower in number density: the number ratio of the two
classes for P2.7  5 x 1025 W Hz-1 is 6.4. This is
larger than in
Padovani and Urry
(1992),
due to the different LF used for the FR II galaxies.
5 x 1025 W Hz-1 is 6.4. This is
larger than in
Padovani and Urry
(1992),
due to the different LF used for the FR II galaxies.
|
Figure 14. Local differential radio luminosity functions for
high-luminosity radio sources: flat spectrum radio quasars (filled
circles), steep spectrum radio quasars (open triangles), and
FR II galaxies (open squares).
The error bars represent the sum in quadrature of the 1  Poisson errors
(Gehrels 1986)
and the variations of the number density associated with a
1 change in the evolutionary
parameter (see
Padovani and Urry 1992
for details). The luminosity functions of FR IIs and SSRQ have
similar slopes and extend to the same luminosity at the bright end,
although the FR IIs extend a decade lower at the faint end. The FSRQ
luminosity function is distinctly flatter and extends to higher luminosities.
This agrees well with the predictions of a beaming model calculated
for FSRQ (solid line) and SSRQ (dot-dashed line);
see Sec. 6.1.3 (Table 3) for
details of the model parameters. Poisson errors
(Gehrels 1986)
and the variations of the number density associated with a
1 change in the evolutionary
parameter (see
Padovani and Urry 1992
for details). The luminosity functions of FR IIs and SSRQ have
similar slopes and extend to the same luminosity at the bright end,
although the FR IIs extend a decade lower at the faint end. The FSRQ
luminosity function is distinctly flatter and extends to higher luminosities.
This agrees well with the predictions of a beaming model calculated
for FSRQ (solid line) and SSRQ (dot-dashed line);
see Sec. 6.1.3 (Table 3) for
details of the model parameters.
|