


3.5 The bootstrap
In some data modelling procedures, confidence intervals for the parameters fall out of the procedure. But are these realistic? And what about the procedures in which they do not? Computer power can provide the answer, with the bootstrap method invented by Efron (1979; see also Diaconis & Efron 1983). It gives something for nothing, and Efron so named it from the image of lifting oneself up by one's own bootstraps.
The method is so blatant (described e.g. in Numerical Recipes as ``quick- and-dirty Monte Carlo'') that it took some time to gain respectability, but the foundations are now secure (see e.g. LePage & Billard 1992, Efron & Tibshirani 1993). Suppose the sample consists of N data-points, each consisting of one or more numbers (e.g. single measurements, or x, y pairs), and we wish to ascertain the error on a parameter estimated from these data points (e.g. mean, or slope of a best fit). We calculate the parameter using a modelling process such as one of those described above. We then bootstrap to find its uncertainty, as follows.
Label each data-point.
Draw at random a sample of N with replacement (simply done by computer with a random-number generator);
Recalculate the parameter.
Repeat this process as many times as possible.
Provided that the data points are independent (in distribution and in order), the distribution of these recalculated parameters maps the uncertainty in the estimate from the original sample.
For example,
Bhavsar (1990)
described how ideally suited the
bootstrap is to estimating the uncertainty in measuring the slope of
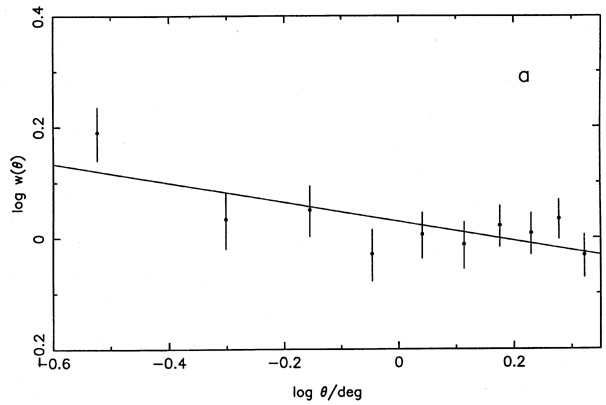
the angular 2-point correlation function for galaxies. The data points
are the (x, y) pairs of galaxy coordinates on the sky, and the
difficulty in estimating the accuracy of this slope is as notorious as
for estimating the slope of the counts of radio sources. The reason is
similar:  N error bars are
readily assigned, but they are not
independent. My example of such a 2-point correlation function
estimate is shown in Fig. 6, part of a search
for clustering in the
distribution of radio sources on the sky
(Wall, Rixon & Benn 1993).
N error bars are
readily assigned, but they are not
independent. My example of such a 2-point correlation function
estimate is shown in Fig. 6, part of a search
for clustering in the
distribution of radio sources on the sky
(Wall, Rixon & Benn 1993).
|

|
Fig. 6. A bootstrap application. (a) The 2-point correlation function for 2800 radio sources with extended radio structure, from the White-Becker catalogue of the NRAO 1400 MHz survey of the northern sky. A least-squares fit gives a slope of -0.17. (b) The uncertainty in this slope estimate as determined from bootstrap testing the sample with 219 trials. The rms scatter is ± 0.08, and the slope is less than zero (i.e. signal is present) at a significance level of about 0.03. |