

3.2 Cosmic microwave background
The discovery by the COBE satellite of temperature anisotropies in the cosmic microwave background [63] inaugurated a new era in the determination of cosmological parameters. To characterize the temperature fluctuations on the sky, we may decompose them into spherical harmonics,
and express the amount of anisotropy at multipole moment l via
the power spectrum,
Higher multipoles correspond to smaller angular separations
on the sky,
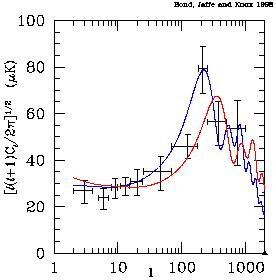
Figure 7. CMB data (binned) and two
theoretical curves:
the model with a peak at l ~ 200 is a flat matter-dominated
universe, while the one with a peak at l ~ 400 is an open
matter-dominated universe. From
[72].
Although the dependence of the Cl's on the parameters can be
intricate, nature has chosen not to test the patience of
cosmologists, as one of the easiest features to measure - the
location in l of the first ``Doppler peak'', an increase in
power due to acoustic oscillations - provides one of the most
direct handles on the cosmic energy density, one of the most
interesting parameters. The first
peak (the one at lowest l) corresponds to the angular scale
subtended by the Hubble radius HCMB-1 at
the time when the
CMB was formed (known variously as ``decoupling'' or ``recombination''
or ``last scattering'')
[64].
The angular scale at which we observe this peak is tied to the
geometry of the universe: in a negatively (positively)
curved universe, photon paths diverge (converge), leading to
a larger (smaller) apparent angular size as compared to a
flat universe. Since the scale HCMB-1 is set
mostly by microphysics, this geometrical effect is dominant,
and we can relate the spatial curvature as characterized
by
More details about the spectrum (height of the peak, features
of the secondary peaks) will depend on other cosmological
quantities, such as the Hubble constant and the baryon density
[68,
69,
70,
71].
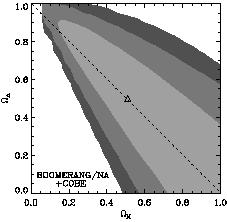
Figure 8. Constraints in the
Figure 7 shows a summary of data as of 1998,
with various
experimental results consolidated into bins, along with two
theoretical models. Since that time, the data have continued to
accumulate (see for example
[73,
74]),
and the
near future should see a wealth of new results of ever-increasing
precision. It is clear from the figure that there is good
evidence for a peak at approximately lpeak ~ 200,
as predicted in a spatially-flat universe.
This result can be made more quantitative by fitting the CMB
data to models with different values of


 = 180° / l.
Within any given family of models, Cl vs. l
will depend
on the parameters specifying the particular cosmology.
Although the case is far from closed, evidence has been mounting
in favor of a specific class of models - those based on
Gaussian, adiabatic, nearly scale-free perturbations in a universe
composed of baryons, radiation, and cold dark matter. (The
inflationary universe scenario
[21,
22,
23]
typically predicts these kinds
of perturbations.)

 to the observed peak in the
CMB spectrum via
[65,
66,
67]


 M
-
M
- 
 plane from the North American flight of the BOOMERANG microwave
background balloon experiment.
From [74].
 M and
M and

 [72,
75,
76,
77,
78]
or by combining the CMB data with
other sources, such as supernovae or large-scale structure
[79,
80,
49,
81,
82,
83,
84,
85].
Figure 8
shows the constraints from the CMB in the
 M
-
M
- 
 plane, using data from the
1997 test flight of the BOOMERANG experiment
[74].
(Although the data used to make this plot are essentially independent
of those shown in the previous figure, the constraints obtained
are nearly the same.) It is clear that the CMB data provide
constraints which are complementary to those obtained using
supernovae; the two approaches yield confidence contours which
are nearly orthogonal in the
 M
-
M
- 
 plane. The region of overlap is in the vicinity of
(
 M,
M,

 ) = (0.3, 0.7), which we will
see below is also consistent with other determinations.