


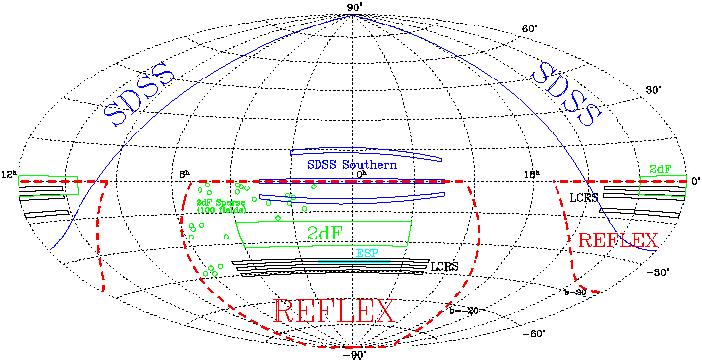
Figure 15 gives a pictorial view of the sky coverage by wide-angle redshift surveys of galaxies and clusters that have mapped or are in the course of mapping the ``local'' Universe to z ~ 0.2 (16) . All these surveys have been discussed in some detail in the previous sections.
|
Figure 15. Pictorial view in Aitoff projection of the areas covered by the major galaxy and cluster redshift surveys discussed in the text. |
While considerable effort will still be necessary to complete the coverage both in photometry and redshift of this volume of the Universe (17), massive redshift surveys are already being planned to study large-scale structure at redshifts of the order of unity.
Deep redshift surveys, as demonstrated by the results from the clustering of Lyman-break galaxies discussed in the previous section, give in principle the possibility to trace the growth of structure, which represents a formidable test for theories: a successful model must be able not only to reproduce the final picture, but also all the snapshots of the ``cosmic movie'' at different epochs.
However, when we start exploring a baseline in time comparable to
galaxy evolutionary times, we not only have the problem of
understanding how our galaxy tracers map the underlying mass density
field, but also to know the way they evolve, i.e. we need a full
comprehension of the bias function b(R, t).
A successful theory must therefore
provide two different ingredients: 1) a cosmological background, i.e. a
linear power spectrum, depending on H0,
 and to the kind
of dark-matter particles dominating the mass density, including a
possible curvature contribution by a cosmological constant
and to the kind
of dark-matter particles dominating the mass density, including a
possible curvature contribution by a cosmological constant
 ; 2) a recipe to convert the
mass and the growth history of ``objects'' (i.e. dark
matter halos), forming during the gravitational evolution from the
chosen initial conditions, into radiation with some spectral
distribution, to be ``observed'' and compared to the real data. This
is the arena of semi-analytical galaxy formation models (see the
review by Kauffmann, these proceedings). Here halos obtained through
analytical ``merging trees'' (e.g.
[129,
130]), or
from purely gravitational N-body simulations
[131] are
``lite-up'' through as realistic
as possible analytical recipes. This seems at present the best we
can do to properly attach some ``flesh'' on the evolving ``bones'' of
large-scale structure. It is self-evident that the
inherent complication of realistically treating the dissipative part
of this process (e.g. cooling, star formation, stellar evolution,
supernova feedback - just to mention a few of the branches into which
the problem of galaxy formation needs to be decomposed to become
tractable), represents the weakest aspect of this machinery, and makes
the use of galaxies as tracers of the evolution of large-scale
structure a rather tricky game.
; 2) a recipe to convert the
mass and the growth history of ``objects'' (i.e. dark
matter halos), forming during the gravitational evolution from the
chosen initial conditions, into radiation with some spectral
distribution, to be ``observed'' and compared to the real data. This
is the arena of semi-analytical galaxy formation models (see the
review by Kauffmann, these proceedings). Here halos obtained through
analytical ``merging trees'' (e.g.
[129,
130]), or
from purely gravitational N-body simulations
[131] are
``lite-up'' through as realistic
as possible analytical recipes. This seems at present the best we
can do to properly attach some ``flesh'' on the evolving ``bones'' of
large-scale structure. It is self-evident that the
inherent complication of realistically treating the dissipative part
of this process (e.g. cooling, star formation, stellar evolution,
supernova feedback - just to mention a few of the branches into which
the problem of galaxy formation needs to be decomposed to become
tractable), represents the weakest aspect of this machinery, and makes
the use of galaxies as tracers of the evolution of large-scale
structure a rather tricky game.
Could we perhaps find a way to select some kind of tracer that does not evolve (or at least such that its evolution is weak and simple to understand), out to some cosmologically significant redshift? Clearly, if we push this redshift limit to some indefinitely high value, this cannot be true for any class of objects, as sooner or later we shall hit the epoch of their major formation. However, we could hope to isolate specific redshift ranges over which the growth of structure is significant, while the intrinsic mean spectrophotometric properties of such tracers remain the same.
To select such objects, detailed colour information, i.e. multi-band photometry, is fundamental. This implies that future deep galaxy redshift surveys will necessary have to be based on photometric catalogues covering possibly from the U band in the ultraviolet to the K band in the infrared. This is the case for the VIRMOS deep survey, that I shall briefly describe in Section 6.2.
The power of colour selection to isolate classes of objects within specific redshift ranges has been extraordinarily demonstrated by the Lyman-break selection technique [57]. These strategies, which base their power on the existence of ``breaks'' in the spectrum of galaxies, tend clearly to select galaxies for which these features are particularly prominent. The technique of Steidel and collaborators selects preferentially galaxies at z ~ 3 or z ~ 4 (depending whether U-band or B-band drop-outs are selected), with strong star formation, that enhances the Lyman break at 912 Å. While Lyman-break galaxies represent a class of objects whose properties would have changed significantly by the present time, it is possible to use similar techniques to select ``steady'' objects as early-type galaxies, for which another spectral break, that at 4000 Å is particularly prominent, within a well-defined redshift interval.
For example, Iovino and collaborators [132] have been able, using Schmidt plates in three bands, bJ, R, and I, to construct a sample of several thousands early-type galaxies within the redshift range 0.3 < z < 0.55, and measure their clustering. They find a correlation length r0 ~ 6 h-1 Mpc, to be confronted to the value of more than 8 h-1 Mpc at the present epoch (see Figure 6). This is one of the cleanest measures of the evolution of large-scale structure presently available: through the selection of a slowly evolving class of objects we try to circumvent our ignorance about how galaxies in general form and evolve. In this way, the measured difference in the clustering strength should only reflect the growth of fluctuations, and therefore the cosmological model. We have seen already how the application of this technique to the unique multi-band photometric catalogue of SDSS will create in a similar way a volume-limited sample of 100,000 early-type galaxies with measured redshift.
6.2. Large Redshift Surveys to z ~ 1 and Beyond
The exploration to z < 1 was pioneered at the beginning of the nineties by deep pencil beam surveys as BEKS, and the Canada-France Redshift Survey [133]. A summary of clustering results from deep surveys, together with the most recent advances related to the Lyman-break selected galaxies can be found in [57]. Here I would like to spend a few words describing a large survey in an advanced stage of preparation, that promises to enlarge by two orders of magnitudes the number of available redshifts at z ~ 1: the VIRMOS Deep Survey.
This survey has its origin in the construction of two spectrographs for visible and IR light (VIMOS and NIRMOS), for the UT3 and UT4 telescopes of the ESO VLT, which is presently carried out by a consortium of French and Italian institutes led by O. Le Fèvre [134]. 120 nights of guaranteed time will be spent with these two instruments, starting in late 2000, to perform a redshift survey of 150,000 galaxies in the redshift range 0.3 < z < 5.
The broad goal of the VIRMOS deep survey is a comprehensive study of the formation and evolution of galaxies, with particular emphasis on the evolution of the luminosity function, star-formation rate, clustering and the fundamental plane. To reach these goals, the following observations are planned:
 26.
26.
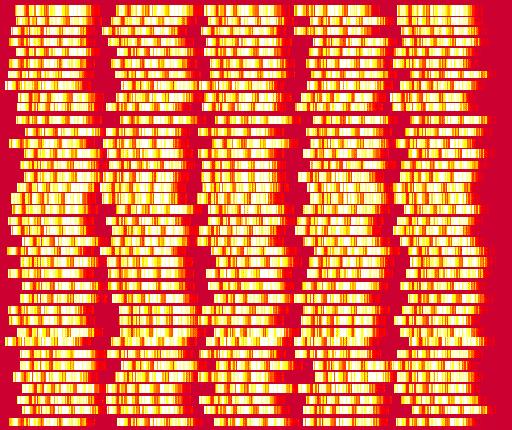
The total numbers listed above will be made possible by the enormous multiplexing gain of the spectrographs: VIMOS in particular, will have the ability to collect simultaneously, in low resolution mode, nearly 800 spectra over a total field of 14 × 14 arcmin2. This field of view is split into four quadrants, to reduce the size of the optical elements required. Figure 16 reproduces the simulated appearance of the image from one of the four CCD detectors, with nearly 200 spectra packed over the available area. The spectroscopic targets for the survey with VIMOS an NIRMOS are being selected from a UBVRIK imaging campaign that is currently in progress using the CFHT, ESO-NTT, ESO-2.2m and CTIO-4m telescopes.
|
Figure 16. A simulated CCD frame as it will be produced by one of the four quadrants of the VIMOS spectrograph, showing 1/4 of the nearly 800 spectra that can be observed at once in the maximum multiplexing configuration. |
6.3. X-ray Clusters as Tracers of High-z Structure
Given our still poor knowledge of galaxy formation and evolution, and on the contrary the relative simplicity of the physycs involved in the X-ray emission from clusters of galaxies, X-ray selected cluster have the potential to become one of the best tools for tracing large-scale structure at high redshifts [115]. The last few years have seen a number of studies on the evolution of the cluster abundance and of their X-ray luminosity function (e.g. [65]). These works have shown that the abundance of clusters with L < 1044 h-2 erg s-1 ~ L* does not seem to evolve significantly between the present epoch and z ~ 1. Although some uncertainties on how to relate this to the underlying evolution of the mass function still remain, these observations, together with the easiness in detecting X-ray clusters to high redshifts, qualifies them as excellent tracers for studying the evolution of large-scale structure.
The kind of flux limits that it is necessary to reach, to be able to detect at z ~ 1 objects with such luminosities, are comparable to the depth of ROSAT pointed observations, i.e. ~ 10-14 erg s-1 cm-2. However, to be able to map large-scale structure at high redshifts, we shall need a survey covering an area significantly larger than the ~ 100 deg2 typical of the serendipitous surveys constructed from the ROSAT PSPC archive, and in particular much less sparse than these. Such an X-ray survey has been recently proposed as the science drive for the construction of a wide-field X-ray satellite ([136]). Crucial for such a survey instrument is a novel design of the X-ray optics [137] which are able to obtain stable point-spread function of ~ 10 arcsec over a 1-degree diameter field, in contrast to the rapidly degrading resolution of classical Wolter-type telescopes [138]. A prototype of such innovative mirrors has been already constructed and successfully tested in the Merate labs of OAB. A more detailed discussion of the use of X-ray clusters as tracers of the evolution of structure, as a scientific case for future wide-angle deep X-ray surveys will be found in [115].
(16) This is an up-to-date version of a plot which already appeared in [6], and [7]. Back.
(17) For example, it seems natural to think that at some point a multicolour survey as the SDSS will necessarily have to be extended to the southern sky. Back.