


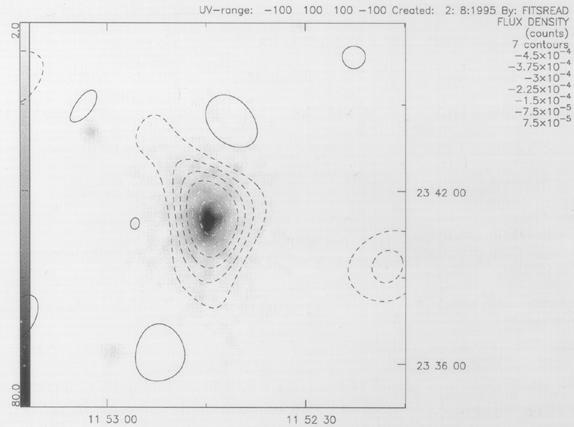
A summary of the detections from the Ryle is given in Table 1, which also indicates the status of the work to determine H0 given the SZ measurement in each cluster. As can be seen from this table, the two clusters so far for which it has been possible to make an estimate of H0 from the Ryle detections are A2218 and A1413. The latter is clearly elliptical in projected profile (see Fig. 4), and is allowed to have different core radii along each axis in the fitting process, as described above. We now give a description of the H0 results from these clusters, and their associated errors (These results and most of the discussion of errors have been taken from the thesis of Keith Grainge).
| Cluster | redshift |  I in µJy per beam I in µJy per beam
| H0 status |
| A2218 | 0.17 | -500 ± 70 | Done |
| A773 | 0.22 | -590 ± 120 | In progress |
| 0016+16 | 0.54 | -620 ± 150 | SZ complicated |
| (needs detailed modeling) | |||
| A665 | 0.18 | -680 ± 100 | Source removal problems |
| A1413 | 0.14 | -500 ± 70 | Done |
| A697 | 0.28 | -640 ± 110 | In progress |
| A1914 | 0.17 | -690 ± 200 | Ditto |
| A990 | 0.14 | -455 ± 90 | Needs ASCA data |
| A1995 | 0.32 | -510 ± 140 | Ditto |
|
Figure 4. Ryle Telescope map of A1413 (contours) overlaid on ROSAT PSPC image (greyscale). Contour levels are -450 to 75 µJy beam-1 in steps of 75 µJy beam-1 (From Grainge et al. (1996)). |
We start by giving the basic H0 values for each cluster, with one sigma random noise errors indicated, and then build up a picture of the other sources of error, and what each contributes.
At this point we should consider further the effect of cluster ellipticity. From the above discussion,
|
To avoid the bias that would be introduced by selecting clusters on the basis of X-ray surface brightness, the Ryle sample is chosen on the basis of total X-ray luminosity, based on the XBACS cluster sample of Ebeling et al. (1996). If a (geometric!) mean of the Ryle results for H0 is taken then by the above formula the errors due to incorrectly assuming the cluster is spherical when it is not, should average out. However, we still need to estimate this error for any particular cluster. Typical cluster ellipticities observed have ratios of 1.2:1 common, while 2:1 would be at the extreme end of the range of variation. Errors on H0 for the clusters are estimated from the maximum ellipticity seen in the projected 2-d images. This yields
| A2218 | A1413 | ||
| Ellipticity error estimate | ±10% | ±15%. |
A further source of error to consider is clumping of the intracluster gas. The idea here is that the intracluster medium may contain two phases, in a similar fashion to the interstellar medium. The clumped material would be cooler if pressure balance was maintained. Since X-ray luminosity is proportional to n2e, clumping will increase the X-ray flux, SX observed. Recalling equation (2.1), it is generally assumed that therefore clumping results in an overestimate of H0. This would therefore not be a prime worry in reconciling the H0's from SZ with optical determinations. However, this approach ignores another possibility, which is that the clumping might mean that the emission-weighted Te derived from the X-ray spectral measurements would come out too low. This would then tend to underestimate H0.
To get a handle on these effects, and their relative strength, requires first a way of deciding if clumping is a priori likely anyway, and secondly detailed numerical modeling of the two processes. On the first point, there exists good X-ray evidence that (if clumping exists) then it will be proportional to the strength of the cooling flow (Kim et al. 1991; Fabian et al. 1994). In A2218 there is no evidence for a cooling flow, while in A1413 there is a known cooling flow, and numerical modeling suggests here that clumping could then lead to an underestimate of H0 by about 10%. This must then be included in the upper range error for H0.
| A2218 | A1413 | |
| Model used: | spherical | elliptical |
| Basic result (random errors) | 38+13-8 km s-1 Mpc-1 | 47+12-10 km s-1 Mpc-1 |
| Radio calibration error ± 5% | ==> ± 10% error in H0 | |
| Source removal error
~ ±25 µJy | ==> ± 10% error in H0 | |
| Cluster radio halo emission
(A2218 has a steep spectrum halo) | Max. contribution at 15 GHz =
50 µJy ==> +20% in H0 | No radio halo in A1413 |
| X-ray gas temp. ±6% and ±3%
resp (Ginga results) | ±12% in H0 | ±6% in H0 |
The final effect to include is that of the kinetic SZ effect. Taking
rms cluster peculiar
velocities of ~ 200 km s-1, would lead to an approximately 2%
error in TSZ at our
frequencies, and thus a 4% error in H0. A more direct
limit on cluster peculiar velocities comes from the SuZie work of
Holzapfel et
al. 1997a,
which yields the constraints

|
The final results on the Ryle H0's so far are therefore (all numbers in units of km s-1 Mpc-1):
| A2218 | A1413 | |
| Linear addition | 38+42-18 | 47+41-17 |
| Quadrature | 38+17-12 | 47+18-12 |
| Combined | 42+12-9 | |
Such low values of H0 are of course very useful in
reconciling the observed ages of the
oldest stars with the age of the universe in an
 = 1 inflationary cosmology. Further
details and discussion may be found in Grainge et al., in preparation.
= 1 inflationary cosmology. Further
details and discussion may be found in Grainge et al., in preparation.