


3.2. Kinematics
Most of our knowledge of the velocity field of disk galaxies derives from measurements of Doppler shifts of emission lines in the optical or radio spectral regions. These lines stem from interstellar gas that has been excited to various degrees by radiation from hot young stars in star forming regions or, in some cases, from an ionizing non-stellar source at the galactic centre. They may also come from transitions between, mostly collisionally excited, hyperfine levels in atomic or molecular gas that can be observed at radio frequences.
The first attempt to derive a velocity field in NGC 1365 was made by
Burbidge and Burbidge
(1960)
and Burbidge et
al. (1962).
They measured
H and [N II] emission line
velocities along a number of slits
placed across the nucleus at various position angles and showed the
nuclear region to be in rapid rotation.
As a matter of fact, the velocity field within some 5" from the
nucleus simulates that of solid body rotation with a line of nodes
agreeing roughly with the line of nodes of the entire galaxy
(Lindblad 1978).
and [N II] emission line
velocities along a number of slits
placed across the nucleus at various position angles and showed the
nuclear region to be in rapid rotation.
As a matter of fact, the velocity field within some 5" from the
nucleus simulates that of solid body rotation with a line of nodes
agreeing roughly with the line of nodes of the entire galaxy
(Lindblad 1978).
As later results show, a sharp turnover of the rotation curve only 8" from the nucleus, combined with irregular distribution of bright hot spots about the same distance from the centre and lack of resolution of the photographic emulsion conspired to make conclusions about deviations from circular velocities in this region very difficult at the time.
The presence also of higher excitation gas in the nuclear region as
revealed by emission lines of [O III] and He II was pointed out by
M.M. Phillips et
al. (1983).
They discovered that the [O III] lines often were split and that the
stronger line gave a velocity field quite different from that given by
H . We will postpone
the discussion of these high excitation
lines and the `extraordinary' velocity field given by them until our
discussion of the nuclear region in
Section 4.3. For the
time being we stay with the disk velocity field as given mainly
by low excitation lines, i.e. the hydrogen Balmer lines and lines of
forbidden [N II], [S II] and [O II].
. We will postpone
the discussion of these high excitation
lines and the `extraordinary' velocity field given by them until our
discussion of the nuclear region in
Section 4.3. For the
time being we stay with the disk velocity field as given mainly
by low excitation lines, i.e. the hydrogen Balmer lines and lines of
forbidden [N II], [S II] and [O II].
A velocity field of the galaxy was derived by Jörsäter (1984) from measurements of optical emission lines obtained at ESO and at Cerro Tololo Interamerican Observatory (CTIO) along spectrograph slits placed all over the galaxy (Jörsäter et al. 1984b). He pointed out the strong influence of the bar on the velocity field with steep velocity gradients across the dust lanes along the bar. Also evident was the twist of the isovelocity curves at about 6" from the nucleus. Kopecký and Palous (1991) used these early observations to show that the gaseous streamlines are elongated along the bar, and that outside the bar the apsidal lines of these orbits turn in the retrograde direction with increasing radius (cf. Section 3.3).
Using a quite different technique
Teuben et al. (1986)
observed the velocity field by scanning through the
H line with the TAURUS
imaging Fabry-Perot interferometer. They confirmed the twist of the
nuclear isovelocity curves and showed, by modeling numerically the gas flow
in a barred potential, that this could be interpreted as
a twist of closed orbits across an inner Lindblad resonance (see
Section 3.3).
A compilation of radial velocity measurements by Jörsäter et al. with more recent observations at ESO was made by P.O. Lindblad et al. (1996a). This covered in particular the nuclear region and the bar, where H I velocities are missing.
Ondrechen and van der Hulst (1989) derived a velocity field from their 21-cm H I observations with the VLA. Including these observations in their own VLA data Jörsäter and van Moorsel (1995) derived the H I velocity field from 31 channel maps, spaced at frequency intervals corresponding to 20.84 km s-1. By an analysis of this field they derived the orientation of the galaxy in space as well as the rotation curve and mapped the non-circular velocity components.
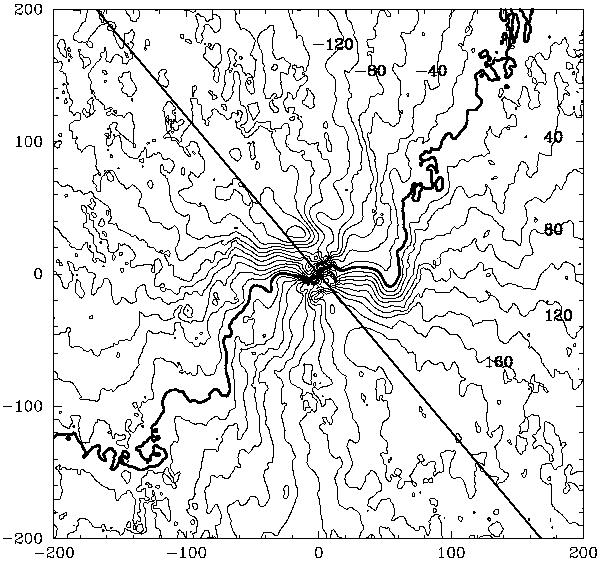
Finally, the optical velocities of P.O. Lindblad et al. (1996a) of the disk velocity field were combined with the H I velocities of Jörsäter and van Moorsel into a common velocity field, using Fourier techniques to interpolate between data points. The resulting field is shown in Fig. 10, and in Fig. 11 at higher resolution for the nuclear region.
|
Figure 10. Radial velocity field of the
disk interstellar gas component
of NGC 1365. The zero point of velocity is +1630 km s-1 and
the interval
between contours is 20 km s |

|
Figure 11. Nuclear velocity field enlarged from Fig. 10. From P.O. Lindblad et al. (1996a) |
Strong deviations from circular motion are clearly evident in these maps. The viewing angle of the disk and, as it turns out, also the orientation of the bar are particularly favourable for detecting effects of non-circular motion in the radial velocities. The iso-velocity contours are twisted in the bar region to run parallel to the bar, with strong velocity gradients across the leading side of the bar. Also, twists of contours and relatively strong velocity gradients, indicating non-circular motions, are seen to follow the main spiral arms. The algorithm for combining the velocities necessarily smoothes the data along the slits. Thus, the steepness of the velocity gradients can only be appreciated by looking at the original measurements along the slits (P.O. Lindblad et al. 1996a). It has been demonstrated by Lindblad and Jörsäter (1987) that this shock-like behaviour is localized in the dust lanes on the leading side of the bar and along the main spiral arms, as well as in the nuclear region. The stellar absorption lines across the bar seen in the same spectra, however, show a very smooth behaviour (Jörsäter et al. 1984b Fig. 30; Jörsäter 1984, Art. 6 Fig. 13), clearly demonstrating the difference between stellar and gas dynamics.