


Direct inspection of the input data reveals some inherent problems in data handling. One is that this type of analysis is made under the assumption that disks are exponential. This "hypothesis" is reasonable as a zeroth order description, but there is an immoderate use of it in the literature. In Fig. 4 we see several photometric profiles of two galaxies (Begeman 1987). Rather than being an exception, the case of NGC 5033 is fairly typical. An extrapolation is needed in the bulge region (about 1 arcmin), there is a ring (about 1 arcmin) and a truncation at large radii (about 1 arcmin) and the stellar disk is less than 6 arcmin in radius.

|
Figure 4. Left: Upper panel: The luminosity profile of NGC 5033 observed by Kent (1986). Lower panel: The observed rotation curve of NGC 5033 (dots) and the rotation curves of the individual mass components (lines). Right: Upper panel: The luminosity profile of NGC 5371 observed by Wevers, van der Kruit and Allen (1986) and its decomposition into a bulge and disk (lines). Lower panel: The observed rotation curves of NGC 5371 (dots) and the rotation curves of the individual mass components (lines). From Begeman (1987) PhD thesis. |
The truncation of the disk (van der Kruit, 1979; van der Kruit and Searle, 1981a, b, 1982a, b; Barteldrees and Dettmar, 1994) is very noticeable, for instance, in the galaxy NGC 5033. In Fig. 4 we plot the photometric surface brightness (in mag arcsec-2) of this galaxy, showing a spectacular truncation, and the decomposition of the rotation curve following Begeman (1987). Is this disk really exponential?
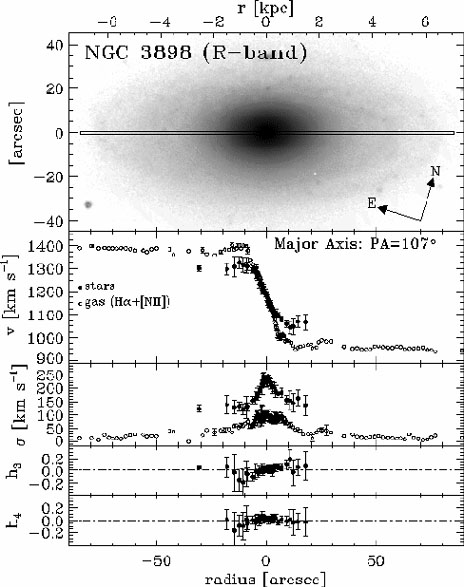
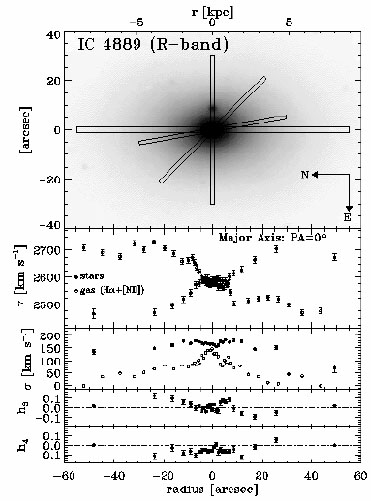
Another problem may arise from the fact that the rotation curve is usually measured at 21 cm but the stellar disk in the optical. The stellar disk and the gas in the disk usually corotate, but due to frequent mergers and the accretion of clouds, captures, etc, this is not always the case. Unfortunately, non-corotation is more frequent than is generally assumed and very often the rotation curve of stars and of the gas differ greatly. Figures 5 and 6 are two examples taken from the Ph. D. thesis of Vega-Beltran (1997). In NGC 3898 the ionized gas and the stars not only counterrotate, but the shapes of the two rotation curves are quite different. The spiral galaxy IC 4889 is another surprising example: gas and stars do not counterrotate but the gas exhibits a typical flat curve while the stars decline in a Keplerian-like fall-off. These two examples are not an exception: important deviations from corotation are found in about 14 out of 22 galaxies in the Vega-Beltran sample, where gas and star rotation curves were measured independently.
|
Figure 5. Comparison of stellar and gaseous rotation curves by Vega-Beltrán (1999). Upper window: R-band image. V-window: rotation velocities. The other windows represent the velocity dispersion and the third and fourth orders Gauss-Hermite of the line-of-sight velocity distribution of the stars. From Vega-Beltrán (1999) PhD thesis. |
|
Figure 6. Same as for figure 9. From Vega-Beltrán (1999) PhD thesis. |
There is another problem raised by Sofue and collaborators
(Sofue, 1999;
Sofue et al. 1999).
These authors made a detailed measurement of the
innermost rotation curve based on millimeter CO observations, because
the frequent HI hole in many galaxies impedes a proper observation using
21 cm. Their rotation curves have a steeper central increase, followed
by a broad maximum in the disk and the characteristic flat rotation
due to the massive halo. As the interest of rotation curves lies
traditionally on the periphery, the central region has been
neglected. From the observational point of view, this
region is particularly difficult to study, specially in edge-on
galaxies; a novel technique, the so called "envelope-tracing"
method, has been used, in contrast with other current methods. Its
logarithmic rotation curve of the Milky Way is reproduced in
figure 7 and compared with the linear one of
Clemens (1985) and
Honma and Sofue (1997).
The inner curve is of Keplerian type due to a central
black hole. Observe that the curve should begin at the origin,
![]() (0) = 0, but this very central steep increase has not
yet been
observed. Other galaxies have been observed to have a central fast
rotation as in the Milky Way. These indicate the existence of dark
matter in the centre, probably that of a black hole, which is also
important in Cosmology, but the processes involved are different from those
affecting the problems considered in this
paper. Sofue et al. present rotation curves of 50 spirals, with a steep
central rise, warning that previous curves could be incorrect
in the centres, with the outermost regions remaining unaltered.
(0) = 0, but this very central steep increase has not
yet been
observed. Other galaxies have been observed to have a central fast
rotation as in the Milky Way. These indicate the existence of dark
matter in the centre, probably that of a black hole, which is also
important in Cosmology, but the processes involved are different from those
affecting the problems considered in this
paper. Sofue et al. present rotation curves of 50 spirals, with a steep
central rise, warning that previous curves could be incorrect
in the centres, with the outermost regions remaining unaltered.
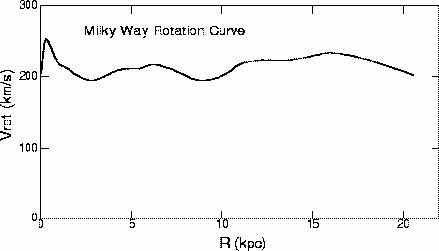
Figure 7. The Milky Way rotation curve in (a) a logarithmic scale by Sofue et al. (1999) as compared with the linear scale rotation curve (b). Courtesy of American Astronomical Society. |
It is necessary to study how these results modify the standard methods of interpreting rotation data. For example, if the inner part of the rotation curve is steeper (Swaters, Madore and Trewhella, 2000), then M/L is understimated and, when using the maximum technique the luminous matter contribution is also understimated.