


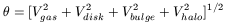
Figure 1, from the PhD Thesis of Begeman (1987), illustrates the photometric profiles used to obtain the bulge and disk contributions to the total rotation velocity, the observational rotation curve and the circular velocity of the halo. This is calculated from
| (2) |
where the V's are the circular velocities of the different components. With the "maximum disk" hypothesis we previously estimate Vdisk2 (in reality, also Vbulge2), which determines M/L. It is usual to assume that the disk is exponential; then the disk circular velocity is calculated with the formula deduced by Casertano (1983) and that of the bulge with the formula given by Kent (1986). If the halo is spherically symmetric its circular velocity is simply Vhalo2 = GM(R)/R.
|
Figure 1. Upper panel: The luminosity profile of NGC 2403 observed by Wevers, van der Kruit and Allen (1986). Lower panel: The observed rotation curve of NGC 2403 (dots) and the rotation curves of the individual mass components (lines). From Begeman (1987) PhD thesis. |
Note that the bulge, stellar disk and gas disk are insufficient to
give the observed ![]() (R), and therefore either dark matter is needed
or forces other than gravity are involved. Note also that, even if the
maximum disk method gives reasonable results and real disks are
probably near maximum disks, we assume
Vhalo = 0 in the central
region, which implies
(R), and therefore either dark matter is needed
or forces other than gravity are involved. Note also that, even if the
maximum disk method gives reasonable results and real disks are
probably near maximum disks, we assume
Vhalo = 0 in the central
region, which implies
![]() = 0 in the central region, which is,
from the point of
view of galaxy formation, highly improbable. This fact, however, does
not in practice introduce a serious problem.
= 0 in the central region, which is,
from the point of
view of galaxy formation, highly improbable. This fact, however, does
not in practice introduce a serious problem.
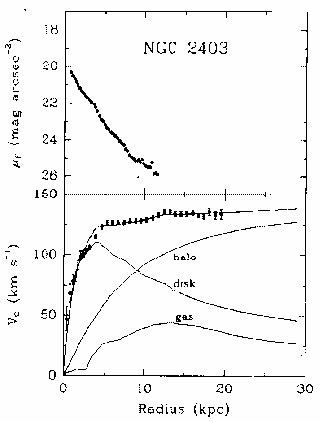
On the other hand, we reproduce the rotation curve of the Sd galaxy
NGC 1560 from the Broeils thesis.
Figure 2 shows the obtention of
the rotation curve from a velocity-position map. It is apparent that
the curve is always an increasing function with no sign of becoming flat,
which is typical of small galaxies. Fig 3 gives
the contribution of the
different components, following three methods, the "maximum disk",
the "best fit" and the "minimum disk". This latter method is also
called the "maximum halo", with a fixed M/L of only 0.1 (measured in
solar units,
M![]() /L
/L![]() = 1 for the
stellar disk, so that the disk gas makes the main contribution to
the observable mass. This could be a reasonable assumption, as dwarf
galaxies may
be dominated by non-luminous material even in the innermost
region. The "best fit" method again assumes a spherical isothermal halo.
= 1 for the
stellar disk, so that the disk gas makes the main contribution to
the observable mass. This could be a reasonable assumption, as dwarf
galaxies may
be dominated by non-luminous material even in the innermost
region. The "best fit" method again assumes a spherical isothermal halo.
|
Figure 2. A position-velocity map along the major axis at a position angle of 21°. The filled circles show the adopted rotation curve of NGC 1560. The cross in the lower right corner indicates the angular and velocity resolutions. From Broeils (1992). Courtesy of Astronomy and Astrophysics. |

|
Figure 3. The observed rotation curve and disk-halo models. The top panel shows a halo added to the maximum disk; the middle panel shows the "maximum halo", with almost no mass in the stellar disk ( M/LB = 0.1). The bottom panel shows the "best fit" disk-halo model. The dotted and dashed lines indicate the gas and stellar disks. The dot-dashed line shows the rotational velocities of the halo; the full line is the contribution of all the components. From Broeils (1992). Courtesy of Astronomy and Astrophysics. |