To appear in "Astrophysical Ages and Time Scales", ASP
Conference Series, Vol. TBD, 2001, eds. T. von Hippel, N. Manset,
C. Simpson;
astro-ph/0105470
COSMIC FLOWS: A STATUS REPORT
S. Courteau
University of British
Columbia,
Physics &
Astronomy, Vancouver, BC., Canada
A. Dekel
Racah Institute of
Physics, The Hebrew
University, Jerusalem 91904,
Israel
Abstract. We give a brief review of recent developments in the
study of the large-scale velocity field of galaxies since the international
workshop on Cosmic Flows held in July 1999 in Victoria, B.C.
Peculiar velocities (PVs) yield a tight and unique constraint
on cosmological characteristics,
independent of  and
biasing, such as the cosmological matter density parameter
(
and
biasing, such as the cosmological matter density parameter
( m) and the
convergence of bulk flows on large scales.
Significant progress towards incorporating non-linear dynamics
and improvements
of velocity field reconstruction techniques have led to a rigorous control
of errors and much refined cosmic flow analyses. Current investigations
favor low-amplitude (
m) and the
convergence of bulk flows on large scales.
Significant progress towards incorporating non-linear dynamics
and improvements
of velocity field reconstruction techniques have led to a rigorous control
of errors and much refined cosmic flow analyses. Current investigations
favor low-amplitude ( 250 km s-1) bulk flows on the largest scales
( 100 h-1
Mpc) probed reliably by existing redshift-distance
surveys, consistent with favored
CDM cosmogonies.
Tidal field
analyses also suggest that the Shapley Concentration (SC), located
behind the Great Attractor (GA), might play an important dynamical role,
even at the Local Group. Low-amplitude density fluctuations on very
large scales generate the overall large-scale streaming motions while
massive attractors like the GA, and Perseus-Pisces
account for smaller scale motions which
are superposed on the large-scale flow.
Likelihood analyses of galaxy PVs,
in the framework of flat CDM cosmology, now provide tight constraints of
m = 0.35 ±l 0.05.
A four-fold size size increase of our data base is expected in
~ 4-5 years with the completion of next generation FP/TF surveys and
automated supernovae searches within 20,000 km s-1.
250 km s-1) bulk flows on the largest scales
( 100 h-1
Mpc) probed reliably by existing redshift-distance
surveys, consistent with favored
CDM cosmogonies.
Tidal field
analyses also suggest that the Shapley Concentration (SC), located
behind the Great Attractor (GA), might play an important dynamical role,
even at the Local Group. Low-amplitude density fluctuations on very
large scales generate the overall large-scale streaming motions while
massive attractors like the GA, and Perseus-Pisces
account for smaller scale motions which
are superposed on the large-scale flow.
Likelihood analyses of galaxy PVs,
in the framework of flat CDM cosmology, now provide tight constraints of
m = 0.35 ±l 0.05.
A four-fold size size increase of our data base is expected in
~ 4-5 years with the completion of next generation FP/TF surveys and
automated supernovae searches within 20,000 km s-1.
Table of Contents
 INTRODUCTION
- DATA SETS AND BULK FLOWS
- The Large-Scale Tidal Field
- POWER SPECTRA AND THE MEASUREMENT OF
M
- THE FUTURE
- REFERENCES
1. INTRODUCTION
Ever since the discovery of the microwave background dipole by
Smoot, Gorenstein &
Muller (1977)
and the pioneering measurements of galaxy motions by
Rubin et al. (1976),
the study of cosmic flows, or
deviations from a smooth Hubble flow due to large-scale gravitational
perturbations, has been recognized as one of the most powerful constraints
to cosmological scenarios
(Peebles 1980,
Dekel 1994,
Strauss & Willick
1995).
Indeed, under the assumption that cosmic structure originated from
small-amplitude density fluctuations that were amplified by gravitational
instability, the peculiar velocity v and mass density contrast
 are together linked
in the linear regime by a deceptively simple expression (from
mass conservation in linear perturbation theory):
are together linked
in the linear regime by a deceptively simple expression (from
mass conservation in linear perturbation theory):
| (1)
|
The mean square bulk velocity on a scale R is easily calculated in
Fourier space as:
| (2)
|
where P(k) is the mass fluctuation power spectrum and
 2(kR) is
the Fourier transform of a top-hat window of radius R.
Measurements of galaxy PVs can thus directly constrain
m, the shape and
amplitude of the power spectrum, and test assumptions about the
statistical properties of the initial fluctuations and gravitational
instability as the engine of perturbation growth.
2(kR) is
the Fourier transform of a top-hat window of radius R.
Measurements of galaxy PVs can thus directly constrain
m, the shape and
amplitude of the power spectrum, and test assumptions about the
statistical properties of the initial fluctuations and gravitational
instability as the engine of perturbation growth.
The last major workshop on Cosmic Flows in July 1999 in Victoria, BC
(Courteau, Strauss, &
Willick 2000;
hereafter CFW2000) came at a time
when important new data sets and critical modeling of the
"biasing" relation between the galaxy and mass distribution
were just being released.
Fundamental questions debated at the conference, and central to all
cosmological investigations based on cosmic flows,
included
(1) : (1) What is the
amplitude of bulk flows on the largest scales probed?
(2) Can velocity analysis provide accurate estimates of
m?,
and (3) What is the value of
m?
The last two years have seen significant progress providing nearly
definitive answers to each of the 3 questions above, as we discuss
in the remainder of this review.
Detailed information about cosmic flows can be found in the Cosmic
Flows 1999 workshop proceedings (CFW2000), including the conference
review by
Dekel (2000).
Also in
Willick (1999) and
Dekel (1999),
as well as
Willick (2000).
1 Discussions about the measurements of the
small-scale velocity dispersion
and the coldness of the velocity field also figured prominently in the
workshop agenda but we do not offer any update below, for lack of space.
The interested reader should read CFW2000.
Back.
2. DATA SETS AND BULK FLOWS
The radial peculiar velocity of a galaxy is derived by subtracting the
Hubble velocity H0 d from the total velocity
(redshift) cz
in the desired frame of reference (e.g., CMB or Local Group).
The distance d is inferred from a
distance indicator (DI) whose accuracy dictates the range of applicability
of the technique. The relative distance error of common
DIs ranges from 20% (Tully-Fisher [TF], Fundamental Plane [FP], Brightest
Cluster Galaxy [BCG]) down to 5-8% (Surface Brightness Fluctuations [SBF],
SNIa, Kinetic Sunyaev-Zel'dovich [kSZ]). The bulk velocity
VB of an
ensemble of galaxies within a sphere (or a shell) of radius R is computed
by a least square fit of a bulk velocity model predictions
VB .
 to the observed radial peculiar velocities, where
is a unit vector
in the direction of the object. Current results are summarized in
Table 1
and represented graphically in Figure 1.
to the observed radial peculiar velocities, where
is a unit vector
in the direction of the object. Current results are summarized in
Table 1
and represented graphically in Figure 1.
Table 1. Recent Bulk Flow Measurements
a
|
| Survey | Reff (km s-1)
| VB (km s-1) | Dist. Ind.
|
|
| Lauer-Postman (BCG) | 12500 | 700 | BCG
|
| Willick (LP10K) | 11000 | 700 | TF
|
| Hudson et al. (SMAC) | 8000 | 600 | FP
|
| Dekel et al. (POTENT/M3) | 6000 | 350
| TF, Dn - 
|
|
| Tonry et al. (SBF) | 3000 | 290 | SBF
|
| Riess et al. (SNIa) | 6000 | 300 | SN Ia
|
| Courteau et al. (SHELLFLOW) | 6000 | 70 | TF
|
| Dale & Giovanelli (SFI) | 6500 | 200 | TF
|
| Colless et al. (EFAR) | 10000 | 170 | FP
|
| Dale & Giovanelli (SCI/SCII) | 14000 | 170 | TF
|
|
| a All references in CFW2000. With the
exception of
Lauer-Postman (1994),
all results are post-1999.
|
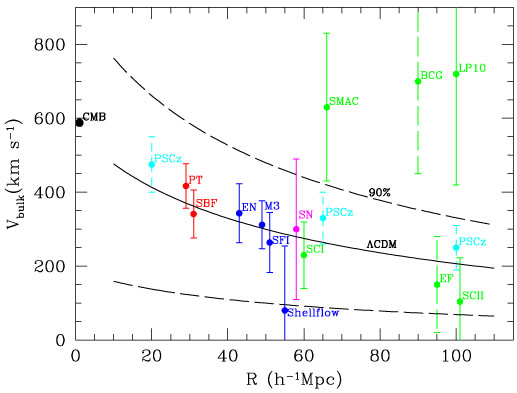
The data sets can de divided into two groups which lie
either exactly within or somewhat above the predictions from most
()CDM families.
Fig. 1 shows the theoretical prediction
of a CDM model for the
simplest statistic: the bulk-flow
amplitude in a top-hat sphere. The solid line is the rms value,
obtained by Eq. 2. The dashed lines
represent 90% cosmic scatter in the Maxwellian distribution of V,
when only one random sphere is sampled. With the exception of BCG,
the directions of the non-zero flow vectors are similar (they all
lie within 30° of (l, b) = (280°,0°)) and the
velocity amplitudes can be roughly compared even though the survey
geometries and inherent sample biases can differ quite appreciably.
A rigorous comparison of flow analyses must however account for
different window functions
(Kaiser 1988,
Watkins & Feldman 1995,
Hudson et al. 2000).
Still, the obvious interpretation of these
data is that of a gradual decline of the flow amplitude, or
"convergence" of the flow field to the rest-frame of the CMB
at ~ 100 h-1 Mpc, consistent with the theoretical assumption
of large-scale homogeneity.
Cosmic variance however prevents any convergence to complete rest.
Some of the reported error bars are based on a careful error analysis
using mock catalogs, while others are crude estimates. In most cases
they represent random errors only and underestimate the systematic biases.
Large error bars for surveys such as BCG, LP10, SMAC, SNIa, and Shellflow,
with fewer than a thousand "test particles," are largely due to sampling
errors which also increase with increasing volumes.
While present bulk flow estimates are in comforting agreement with current
cosmologies, important efforts are currently
underway to reduce the systematic and random errors inherent in most
compilations of galaxy PVs, especially at large
distance. The former is addressed by collecting homogeneous data
across the entire sky, in the spirit of Lauer-Postman and Shellflow
(Courteau et al. 2000).
The latter simply requires that large numbers of galaxies and cluster
of galaxies be observed to reduce Poisson noise and systematic biases.
The nominal sample size to achieve a minimum signal/noise for each
spherical volume chosen must be estimated from mock catalogs based on
an expected number density profile (as a function of distance or redshift
from us) and sky coverage.
New surveys including many thousand "test" particles and reaching
out to 15,000 km s-1 should quantify the convergence of the
peculiar velocity field on very large scales. These surveys include, for
example, NFP (2)
for the FP measurements of ~ 4000 early-type galaxies in
100 X-ray selected clusters,
6dF (3)
for the FP measurements of ~ 15,000 Southern hemisphere early-type
galaxies, the SNfactory
(4). The detection
range should actually extend out to 24,000 km s-1.} for the
serendipitous detection and subsequent follow-up of a few hundred SNe per
year (Aldering 2001, private communication), and the
Warpfire (5)
extension of
Lauer & Postman (1994)'s
BCG analysis. These studies should be completed by 2005, if not sooner.
2.1. The Large-Scale Tidal Field
The cosmological peculiar velocity field at any point
can be decomposed into the sum of a "divergent" field due to density
fluctuations inside the surveyed volume, and a tidal (shear) field,
consisting of a bulk velocity and higher moments, due to the
matter distribution outside the surveyed volume.
This procedure was carried out by
Hoffman et al. (2001),
using reconstructions by POTENT
(Dekel et al. 1999)
or Wiener Filter
(Zaroubi, Hoffman & Dekel
1999),
with respect to a sphere of radius 60 h-1 Mpc about
the Local group. Their results are illustrated in
Fig. 2.
The divergent component is dominated by the flows into the Great Attractor
(left) and Perseus-Pisces (right), and away from the void in between.
The tidal field shows, for example, that about 50% of the
velocity of the Local Group in the CMB frame is due to
external density fluctuations. Their analysis suggests the non-negligible
dynamical role of super-structures at distances of 100-200
h-1 Mpc,
specifically the Shapley Concentration and two great voids. These should
be taken into account when considering the convergence of
bulk velocity from different surveys on different scales and of the
dipole motion of the Local Group.
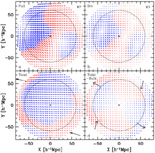
|
Figure 2. Wiener filter reconstruction by
Hoffman et al. (2001)
of the Mark III velocity field in
the Supergalactic plane, with respect to the sphere of
60h-1 Mpc about the Local Group (center).
The velocities are measured in h-1 Mpc (1
h-1 Mpc = 100km s-1).
(a) The full velocity field.
(b) The divergent component due to the mass fluctuations within
the sphere.
(c) The tidal component due to the mass distribution outside the sphere.
(d) The residual after subtracting the bulk velocity from the tidal
component, including quadrupole and higher moments.
The black long arrows in the bottom panels show the projected directions
of the bulk velocity and two of the shear eigenvectors respectively.
For more information, refer to
Hoffman et al. (2001).
|
2
astro.uwaterloo.ca/~mjhudson/nfp/
Back.
3 msowww.anu.edu.au/colless/6dF/
Back.
4 snfactory.lbl.gov
Back.
5 www.noao.edu/noao/staff/lauer/warpfire/
Back.
3. POWER SPECTRA AND THE MEASUREMENT OF
M
The peculiar velocities allow direct estimates of
m independent
of galaxy biasing and .
Early analyses have consistently yielded a lower bound of
m > 0.3 (e.g.,
Dekel & Rees 1994),
but not a tight upper bound.
Cosmological density estimates from
the confrontation of PVs and the distribution of galaxies in redshift
surveys have traditionally yielded values in the range 0.3 <
m < 1 (95%
confidence). This
wide span has often been attributed to nontrivial features of the biasing
scheme or details of the reconstruction/likelihood method such as the choice
of smoothing length. Two common approaches to measuring
m are known
as the density-density (d-d) and velocity-velocity (v-v)
comparisons. Density-density comparisons
based on POTENT-like reconstructions (e.g.,
Sigad et al. 1998)
have produced typically large values of
m, while v-v
comparisons yield smaller estimates (e.g.,
Willick et al. 1997
[VELMOD],
Willick 2000,
Branchini et al. 2001).
These differences have recently been shown to be
insensitive to the complexity of the
biasing scheme, whether it be non-linear, stochastic, or even non-local
(Berlind et al. 2001;
see also
Feldman et al. 2001).
Thus, one must look
for differences inherent to d-d/v-v techniques for an explanation of their
apparent disagreement.
Likelihood analyses of the individual PVs (e.g.
Zaroubi et al. 1997,
Freudling et al. 1999,
Zehavi & Dekel 1999)
can be used to estimate the power spectrum of density
fluctuations under the assumption that these are drawn from a Gaussian
random field. In linear theory, the shape of the power spectrum P(k)
does not change with time and thus provides a powerful tool to estimate
basic cosmological parameters. Moreover, power spectrum analyses of
PVs are free of the problems that plague similar determinations from
redshift surveys such as redshift distortions, triple-valued zones,
and galaxy biasing, and suffer from weaker non-linear clustering effects.
Likelihood methods simply require as prior a parametric functional form
for P(k).
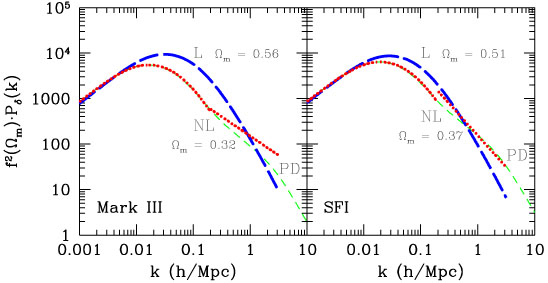
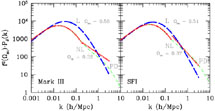
The likelihood analysis of
Silberman et al. (2001)
incorporates a correction
to the power spectrum for non-linear clustering effects, which has been
carefully calibrated using new mock catalogs based on high-resolution
simulations. The effect of
this correction, shown in Fig. 3, is to account
for larger power on small
scales and suppress the overall amplitude of P(k)
on larger scales where clustering is still linear. An unbiased fit of
P(k) in the linear regime can thus be achieved, leading to unbiased
constraints on the relevant cosmological parameters.
The P(k) prior in their analysis assumed a flat
CDM cosmological
model (h = 0.65, n = 1, COBE normalized), with only
m as a free
parameter. Fig. 3 gives final fits based on the
Mark III
(Willick et al. 1997)
and SFI
(Haynes et al. 1999)
catalogs of galaxy PVs. The Mark III catalog is more densely sampled at
small distances than SFI and also includes elliptical galaxies which are
absent in SFI; the correction for non-linear effects is thus stronger
for Mark III. Fitted values for the Mark III data drop from
m = 0.56 ±
0.04 in the earlier linear analysis to 0.32 ± 0.06 in the improved
analysis, and for SFI from 0.51 ± 0.05 to 0.37 ± 0.09.
These revised tight constraints from PVs represent a significant
improvement in this analysis.
|
Figure 3.
The recovered power spectra by the non-linear likelihood analysis of
Silberman et al. (2001)
from the data of M3 (left) and SFI (right).
The P(k) yielded by the purely linear analysis is
marked "L", while the nonlinear analysis, with a break at k =
0.2 h-1 Mpc, is marked "NL". The corresponding values of
m are marked.
Also shown for comparison is an extrapolation of the
linear part of the recovered P(k) into the nonlinear regime by the
Peacock-Dodds (1996)
approximation.
The P(k) is in units of (h-1 Mpc)3.
|
These results are in broad agreement with a recent
v-v likelihood analysis of SFI PVs against the PSCz IRAS redshift
survey by
Branchini et al. (2001).
Their procedure entails some
assumptions about the biasing of IRAS galaxies for which PSC redshifts
are measured. If linear biasing were invoked with a biasing parameter
near unity, Branchini et al. would find even smaller values of the density
parameter with 0.15  m
0.30. This exercise and a direct
comparison with the PV-only likelihood analysis of, say, Silberman et al.
is however futile without a proper prescription of galaxy biasing.
The direct analysis of PVs by themselves has the advantage of being free
of the complications introduced by galaxy biasing.
m
0.30. This exercise and a direct
comparison with the PV-only likelihood analysis of, say, Silberman et al.
is however futile without a proper prescription of galaxy biasing.
The direct analysis of PVs by themselves has the advantage of being free
of the complications introduced by galaxy biasing.
A  2 test applied by
Silberman et al. to modes of a Principal Component Analysis (PCA)
shows that the nonlinear procedure improves the goodness of fit
and reduces a spatial gradient that was of concern in the purely linear
analysis. The PCA allows to address spatial features of the data and to
evaluate and fine-tune the theoretical and error models.
It demonstrates in particular that the
CDM models used are
appropriate for the cosmological parameter estimation performed.
They also addressed the potential for optimal data compression using PCA,
which is becoming important as the data sets are growing big.
2 test applied by
Silberman et al. to modes of a Principal Component Analysis (PCA)
shows that the nonlinear procedure improves the goodness of fit
and reduces a spatial gradient that was of concern in the purely linear
analysis. The PCA allows to address spatial features of the data and to
evaluate and fine-tune the theoretical and error models.
It demonstrates in particular that the
CDM models used are
appropriate for the cosmological parameter estimation performed.
They also addressed the potential for optimal data compression using PCA,
which is becoming important as the data sets are growing big.
Intriguingly, when Silberman et al. allow deviations from
CDM,
they find an indication for a wiggle in the power spectrum: an excess
near k ~ 0.05 h-1 Mpc and a deficiency at
k ~ 0.1 h-1 Mpc
- a "cold flow". This may be related to a similar wiggle seen in
the power spectrum from redshift surveys
(Percival et al. 2001
[2dF]) and the second peak in the CMB anisotropy (e.g.
Halverson et al 2001
[DASI]).
4. THE FUTURE
Significant improvements in cosmic flow studies over the
last couple of years include, for example:
(1) unbiased recovery of cosmological parameters,
such as m and
8
m0.6,
via quasi-nonlinear likelihood analyses of galaxy PVs;
(2) modeling of non-linear clustering effects in power spectrum analyses
from PVs, and implementing tools, based on PCA, for evaluating goodness
of fit; and (3) better modeling of biased galaxy formation, in order
to single out biasing in the comparison of PVs with redshift surveys
and to generate proper mock catalogs for calibrating PV analysis methods.
Future developments rely heavily on growth of the available data
bases and on refinements of existing catalogs. The VELMOD technique
has enabled improved recalibrations of the Mark III
(Willick et al. 1997)
and SFI
(Branchini et al. 2001)
catalogs using external information from IRAS redshift surveys.
We are planning an improved
recalibration of Mark III using as backbone the homogeneous
all-sky Shellflow sample, and merging all
existing catalogs of PVs of field galaxies into a new Mark IV catalog.
A number of on-going and newly envisioned surveys (6dF, NFP, SNfactory,
Warpfire) are expected to increase the size of existing data bases by
a factor 4 within 2005. New wide-field surveys such as SLOAN, 2MASS,
and DENIS will also provide most valuable complementary data to help
control distance calibration errors.
A noticeable impact to precision flow studies should come from
supernovae searches whose potential to build up very large catalogs of
peculiar velocities (at the rate of a few hundred detections per year)
and small relative error is unparalleled by no other distance indicator.
(With  d / d(SNIa) ~
8%, 1 SNIa is worth ~ 6
TF or FP measurements!) If a significant fraction of the new SNIe can
be caught at peak light and monitored to measure a light curve (yielding
precise distance estimates), current TF/FP data sets will be superseded
in less than 5 years. Other ambitious surveys, such as those listed above,
will complement accurate SN distances with very large data bases thus
enabling remarkably tight flow solutions in the near future. There are
good reasons to plan a new workshop on Cosmic Flows in 2005!
d / d(SNIa) ~
8%, 1 SNIa is worth ~ 6
TF or FP measurements!) If a significant fraction of the new SNIe can
be caught at peak light and monitored to measure a light curve (yielding
precise distance estimates), current TF/FP data sets will be superseded
in less than 5 years. Other ambitious surveys, such as those listed above,
will complement accurate SN distances with very large data bases thus
enabling remarkably tight flow solutions in the near future. There are
good reasons to plan a new workshop on Cosmic Flows in 2005!
Acknowledgments
S.C. would like to thank Ted von Hippel, Chris Simpson, and the scientific
organizing committee for their invitation, and for putting together a
superb meeting which was so rich in content and which provided the rare
opportunity to interact closely with leading (and lively!) scientists
from all branches of astrophysics. The editors are also thanked for
their patience while this manuscript was being written.
We remain tremendously saddened by the departure of our friend and
colleague Jeff Willick who did so much for the advancement of cosmic flow
studies and who touched our lives very deeply.
REFERENCES
Berlind, A.A, Narayanan, V.K., & Weinberg, D.H.
2001, ApJ, 549, 688
Branchini, E., Freudling, W. Da Costa, L.N., Frenk,
C.S., Giovanelli, R., Haynes, M.P., Salzer, J.J., Wegner, G. Zehavi, I.
2001, MNRAS, in press
[astro-ph/0104430]
Courteau, S., Strauss, M.A., & Willick, J.A.,
eds. 2000
Cosmic Flows 1999: Towards an Understanding of
Large-Scale Structure, (ASP Conference Series)
Courteau, S., Willick, J.A., Strauss, M.A.,
Schlegel, D., & Postman, M.
2000, ApJ, 544, 636 [Shellflow]
Dekel, A.
1994, ARA&A, 32, 371
Dekel, A., Eldar, A., Kolatt, T., Yahil, A.,
Willick, J.A., Faber, S.M., Courteau, S., & Burstein, D.
1999, ApJ, 522, 1 [POTENT]
Dekel, A. 1999, in
Formation of Structure in the Universe,
eds. A. Dekel & J.P. Ostriker (Cambridge University Press), 250
Dekel, A. 2000, in
Cosmic Flows 1999: Towards an Understanding of
Large-Scale Structure, eds. S. Courteau, S., M.A. Strauss,
& J.A. Willick (ASP Conference Series), 420
Dekel, A., & Rees, M.J.
1994, ApJL, 422, L1
Feldman, H.A., Frieman, J.A., Fry, J.N.,
Scoccimaro, R.
2001 Phys. Rev. Letters, 86, 1434
[astro-ph/0010205]
Freudling, W., Zehavi, I., da Costa, L.N., Dekel,
A., Eldar, A.,
Giovanelli, R., Haynes, M.P., Salzer, J.J., Wagner, G., & Zaroubi, S.
1999, Apj, 523, 1 [Linear likelihood]
Haverson, N.W. et al. 2001 [DASI coll.] submitted
to ApJ
[astroph/0104489]
Haynes, M., Giovanelli, R., Salzer, J., Wegner, G.,
Freudling W., da Costa L., Herter T., Vogt N. AJ,
1999a, AJ, 117, 1668 [SFI]
Hoffman, Y., Eldar, A., Zaroubi, S., Dekel, A. 2001,
submitted to ApJ
[astro-ph/0102190]
Hudson, M. J. et al. 2000, in
Cosmic Flows 1999: Towards an
Understanding of Large-Scale Structure, eds. S. Courteau, S.,
M.A. Strauss, & J.A. Willick (ASP Conference Series), 159
Kaiser, N.
1988, MNRAS, 231, 149
Peacock, J.A. & Dodds, S.J.,
1996, MNRAS, 280, L19
Percival, W. J. et al. 2001 [2dF coll.] submitted to
MNRAS
[astroph/0105252]
Peebles, P.J.E. 1980,
The Large-Scale Structure of the Universe,
Princeton University Press
Rubin, V.C., Thonnard, N., Ford, W.K. & Roberts, M.S.
1976, AJ, 81, 719.
Sigad, Y., Eldar, A., Dekel, A., Strauss, M.A., &
Yahil, A.
1998, ApJ, 495, 516 [d-d]
Silberman L., Dekel A., Eldar A., Zehavi I. 2001,
ApJ, Aug. 10, in press
[astro-ph/0101361]
Smoot, G.F., Gorenstein, M.V., & Muller, R.A.
1977, Phys. Rev. Letters, 39, 898
(see also Corey, B.E. and Wilkinson, D.T,
1976, BAAS, 8, 351)
Strauss, M.A., & Willick, J.A.
1995, Physics Report, 261, 271
Watkins, R. & Feldman, H.A.
1995, ApJ, 453, L73
Willick, J.A. 1999, in
Formation of Structure in the Universe,
eds. A. Dekel & J.P. Ostriker (Cambridge University Press), 213
Willick, J.A. 2000, in the (electronic)
Proceedings of the XXXVth
Rencontres de Moriond: Energy Densities in the Universe
[astro-ph/0003232]
Willick J.A., Courteau S., Faber S., Burstein D.,
Dekel A. Strauss M.
ApJS, 1997, 109, 333 [Mark III]
Willick, J.A., Strauss, M., Dekel, A., Kolatt, T.
1997, ApJ, 486, 629 [VELMOD]
Zaroubi, S., Zehavi, I., Dekel, A., Hoffman, Y., &
Kolatt, T.
1997, ApJ, 486, 21 [Linear likelihood]
Zaroubi, S., Hoffman, Y., & Dekel, A.
1999, ApJ, 520, 413 [Wiener]
Zehavi, I., & Dekel, A.
1999, Nature, 401, 252
 = 0.7.
Care must be exercised when interpreting such plots since directions
are not plotted and projected amplitudes (VX,
VY, VZ) may
differ substantially (e.g.,
= 0.7.
Care must be exercised when interpreting such plots since directions
are not plotted and projected amplitudes (VX,
VY, VZ) may
differ substantially (e.g.,