


Further analysis of nebular emission lines can be categorized as falling in two areas: (1) determination of additional properties intrinsic to the nebular gas, such as elemental abundances, geometry, or total mass; or (2) derivation of properties of the agents or mechanisms responsible for ionizing and heating the gas, such as central star temperatures or shock velocities. To address the type of question, one must first decide what mechanism is responsible for the line emission; this determines the particular parameters to be evaluated. Knowledge of the excitation mechanism is often crucial to deriving meaningful results on quantitative properties of the gas as well.
3.1. Photoionization: Characterizing the UV radiation field
For photoionized nebulae, estimates of the surface temperatures of the
central stars have
long been made using observations of optical/uv emission lines from ions
with different
ionization windows. (By "window" I mean the range between the ionization
potential of the next lower ionization state
 (Xn-1), which is
the minimum energy needed to create Xn, and
(Xn), the energy
it takes to ionize and thus destroy Xn.) In principle,
the stellar temperatures can be calibrated empirically, from nebulae
with central stars
of known surface temperatures, but in practice this is rarely
done. Instead, nebular
ionization models are usually used at least to extend or interpolate
such calibrations,
and are often used as stand-alone calibrators. For example, mid-infrared
spectra of
obscured H II regions sample two strong ionic lines from species with
very different lower
bounds in : [Ne II] 12.8 µm
(21.6-40.9 eV) and [S IV] 10.5 µm (34.8-40.7 eV). In H II
regions ionized by normal thermal stellar spectra, the observed ratio of
these two lines
gives a first-order indication of the temperature of whether the central
star (e.g.,
Rank et al. 1978).
(Xn-1), which is
the minimum energy needed to create Xn, and
(Xn), the energy
it takes to ionize and thus destroy Xn.) In principle,
the stellar temperatures can be calibrated empirically, from nebulae
with central stars
of known surface temperatures, but in practice this is rarely
done. Instead, nebular
ionization models are usually used at least to extend or interpolate
such calibrations,
and are often used as stand-alone calibrators. For example, mid-infrared
spectra of
obscured H II regions sample two strong ionic lines from species with
very different lower
bounds in : [Ne II] 12.8 µm
(21.6-40.9 eV) and [S IV] 10.5 µm (34.8-40.7 eV). In H II
regions ionized by normal thermal stellar spectra, the observed ratio of
these two lines
gives a first-order indication of the temperature of whether the central
star (e.g.,
Rank et al. 1978).
When airborne or space infrared observations are available, a larger variety of ions may be sampled, and the application of detailed models is more fruitful. Sequences of model nebulae can be constructed specifically to fit observations of the infrared lines for a particular nebula (e.g., Simpson & Rubin 1984). While this may seem unnecessarily involved, nebular models developed for optical/uv observations have shown that the ionization balance in a nebula is significantly affected by nebular properties. One of the most critical is the local ratio of photons to atoms, or "ionization parameter;" changes in this parameter can mimic or mask changes in the stellar temperature (e.g., Evans & Dopita 1985). Ionization ratios formed from infrared lines are affected by the ionization parameter, the density structure and inhomogeneities, and internal non-gray opacity due to dust (Herter, Helfer, & Pipher 1983) or atoms (e.g., Rubin 1985). Geometry is another potentially important factor. Relaxing the assumption of spherical symmetry, for example in "blister" H II regions located on the edge of a dense cloud, changes the predicted ionization structure (Rubin et al. 1991). Thus, there is not always a unique correspondence between a particular observed line ratio and stellar temperature; determination of the latter will always require additional assumptions or constraints on the nebular structure.
A similar moral appears in the story of the He I 2.06 µm/H I(Br
 ) 2.16 µm line ratio,
which is relatively easy to observe in moderately obscured H II regions,
and is therefore
attractive as a possible indicator of ionizing star properties. It is
well known that the
ionic abundance ratio He+ / H+ varies with the
surface temperature of the ionizing star (e.g.,
Osterbrock 1989,
Fig. 2.5). However, this does not translate in a simple way
into the variation of this particular line ratio, because the energy
level structure of He I makes it prone to strong radiative-transfer
effects (see
Osterbrock 1989,
Fig. 4.4). Indeed,
the strength of the 2.06 µm line is sensitive to nebular geometry,
density, and velocity structure as well as to optical depth
(Shields 1993).
Other infrared He I lines do not
suffer from as many problems, but are intrinsically weaker and hence
more difficult to observe.
) 2.16 µm line ratio,
which is relatively easy to observe in moderately obscured H II regions,
and is therefore
attractive as a possible indicator of ionizing star properties. It is
well known that the
ionic abundance ratio He+ / H+ varies with the
surface temperature of the ionizing star (e.g.,
Osterbrock 1989,
Fig. 2.5). However, this does not translate in a simple way
into the variation of this particular line ratio, because the energy
level structure of He I makes it prone to strong radiative-transfer
effects (see
Osterbrock 1989,
Fig. 4.4). Indeed,
the strength of the 2.06 µm line is sensitive to nebular geometry,
density, and velocity structure as well as to optical depth
(Shields 1993).
Other infrared He I lines do not
suffer from as many problems, but are intrinsically weaker and hence
more difficult to observe.
Geometry and density effects can only do so much; the presence of highly ionized species in a photoionized nebula requires a relatively hot source for the radiation field. Highly ionized species are often seen in the optical/uv spectra of planetary nebulae with particularly hot central stars; such nebulae are good places to look for infrared emission from ions of very high ionization potential, sometimes called "coronal lines." Examples include [Ne VI] 7.65 µm (Pottasch et al. 1985), [Si VI] 1.96 µm, and [Si VII] 2.48 µm (Ashley & Hyland 1988).
High ionization species are also found in the ejecta of recent classical nova events. Indeed, infrared coronal lines were first identified in a nova (Grasdalen & Joyce 1976). Since then it has been found that many, if not all, novae show high-ionization infrared lines such as [Si VI], [Si VII], [Al XIII], [Ne VI], etc., starting about 10 to 300 days after visual maximum (see reviews by Gehrz 1988; Dinerstein & Benjamin 1993). The record-setting infrared line is [Si IX] 3.92, requiring 401 eV to produce (Greenhouse et al. 1990). The origin of the coronal ions has been controversial. Greenhouse et al. argue that they arise from gas in collisional ionization equilibrium at coronal temperatures. However, the observed near-infrared line-to-continuum ratios in several recent novae (Benjamin & Dinerstein 1990) support the view that the gas is thermally cool, and the coronal ions are produced through photoionization by the hard radiation field of the hot white dwarf (Williams 1991).
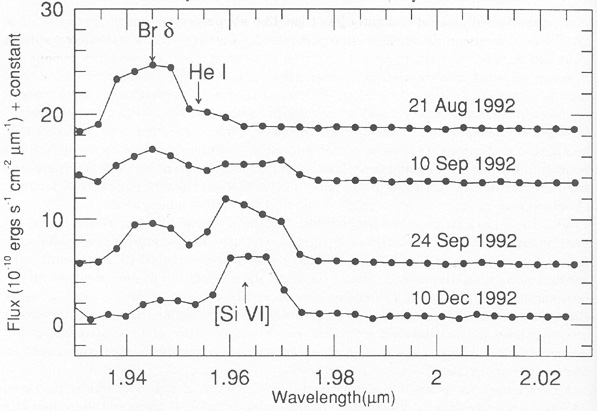
Novae also provide a fascinating opportunity to watch a nebular spectrum evolve, in response to the changing surface temperature of the white dwarf and declining density of the ejecta. During the first year or two after visual maximum, both of these effects drive the ionization balance towards higher ionization states. Figure 6 shows a particularly dramatic example of spectral evolution: Nova Cyg 1992 in the K-band during its transition to the "coronal" phase. If conditions in the ejecta can be properly modeled, the changing spectrum can be used to infer the spectral evolution of the white dwarf. The composition of the ejecta, which are enriched in metals due to the thermonuclear runaway and in some cases may also include material originating from the interior of the white dwarf, is also of interest (Section IV).
|
Figure 6. Evolution of the spectrum of N
Cyg 1992 near 2.0 µm, during the transition to the
"coronal phase." Note the declining strength of H I Br
|
The presence of lines from species with a wide range in ionization potential is often taken as an indicator of ionization by a power-law continuum, for example from an active galactic nucleus (AGN). Several groups have predicted intensity ratios for infrared emission lines, for various models of AGN's, starburst galaxies, and other related objects (Voit 1992; Spinoglio & Malkan 1992). The idea is to construct diagnostic diagrams, by plotting pairs of line ratios against each other, in which these different types of regions can be easily separated and distinguished. The technique is similar to indicators based. on optical and far red lines developed by Baldwin et al. (1981) and Osterbrock, Tran, & Veilleux (1992) respectively. It has also been suggested that the intensities of some infrared coronal lines can be enhanced by laser effects in AGNs (Greenhouse et al. 1993).
The collisionally excited emission lines in ionized nebulae are
populated by interactions
with free electrons that are produced by the photoionization of atoms,
primarily hydrogen.
Photons with energies slightly less than 13.6 eV penetrate somewhat
farther, and
dominate the energetics of the region just beyond the edge of the
Strömgren sphere.
The last decade has seen a dramatic growth of interest in such
transition regions
between ionized nebulae and adjacent molecular clouds, where the gas is
warm but mostly
neutral. In these regions, the electrons are photoelectrons from grains,
or from gaseous
Species with ionization potentials lower than that of H, of which the
most abundant is
neutral atomic carbon. Models of these so-called "photodissociation
regions" or PDRs
(Tielens & Hollenbach
1985,
hereafter TH) predict that their temperatures are of order
 100-1000K, and that they
cool primarily through infrared and submillimeter spectral
lines. There are also significant H2 populations in excited
vibration-rotation levels in these regions.
100-1000K, and that they
cool primarily through infrared and submillimeter spectral
lines. There are also significant H2 populations in excited
vibration-rotation levels in these regions.
The literature contains two types of theoretical studies of PDR's: those
that focus
on the details of the near-infrared H2 quadrupole emission
spectrum, and those that
emphasize the energetics, chemistry, and longer-wavelength lines. The
first type of model
treats the populations of each excited H2
vibrational-rotational level individually, in
order to predict accurate intensities of observable emission lines
(Black & van Dishoeck
1987;
Steinberg & Dalgarno
1989).
The two main mechanisms for populating these
levels are collisions (as in a thermalized, shock-heated gas), and
fluorescence or
"uv-pumping." The latter operates by the absorption of uv photons (with
912 Å <  < 1100 Å)
which excite the molecules to higher electronic states, followed by a
radiative
cascade through the levels that give rise to the infrared lines. This
process was discussed 20 years ago (i.e.,
Black & Dalgarno
1976),
but not actually observed in the interstellar medium until 10 years later
(Hayashi et al. 1985;
Sellgren 1986).
Both the absolute
efficiency (line brightness per unit mass) and the relative line
intensities of fluorescent
H2 emission are dramatically different from those of a
thermalized, collisionally-excited
spectrum. In particular, only a fluorescent spectrum will show
significant emission in lines from high vibrational levels v
< 1100 Å)
which excite the molecules to higher electronic states, followed by a
radiative
cascade through the levels that give rise to the infrared lines. This
process was discussed 20 years ago (i.e.,
Black & Dalgarno
1976),
but not actually observed in the interstellar medium until 10 years later
(Hayashi et al. 1985;
Sellgren 1986).
Both the absolute
efficiency (line brightness per unit mass) and the relative line
intensities of fluorescent
H2 emission are dramatically different from those of a
thermalized, collisionally-excited
spectrum. In particular, only a fluorescent spectrum will show
significant emission in lines from high vibrational levels v
 3. Two examples of "pure" or
"radiative" fluorescent regions are the reflection nebula NGC 2023
(Gatley et al. 1987)
and the planetary nebula Hubble 12
(Dinerstein et
al. 1988;
Ramsay et al. 1993).
However, if the illuminated
material is sufficiently dense, the spectrum will be modified by
collisional effects, which
tend to thermalize the lowest-lying energy levels (v
3. Two examples of "pure" or
"radiative" fluorescent regions are the reflection nebula NGC 2023
(Gatley et al. 1987)
and the planetary nebula Hubble 12
(Dinerstein et
al. 1988;
Ramsay et al. 1993).
However, if the illuminated
material is sufficiently dense, the spectrum will be modified by
collisional effects, which
tend to thermalize the lowest-lying energy levels (v
 2) but not the higher vibrational
states. This is called a "collisional fluorescent" spectrum by
Steinberg & Dalgarno
(1989).
Another complicating factor is that gas illuminated by X-rays (a harder
radiation field
than that from ordinary hot stars) may also produce line ratios that are
intermediate
between the "pure" collisional and fluorescent cases (see article by
A. Dalgarno in this volume).
2) but not the higher vibrational
states. This is called a "collisional fluorescent" spectrum by
Steinberg & Dalgarno
(1989).
Another complicating factor is that gas illuminated by X-rays (a harder
radiation field
than that from ordinary hot stars) may also produce line ratios that are
intermediate
between the "pure" collisional and fluorescent cases (see article by
A. Dalgarno in this volume).
Several techniques have been used to distinguish fluorescent excitation of the H2 lines from emission produced entirely by collisions in shock-heated gas. One method that has been popular because of its simplicity and ease of measurement is to simply take the ratio of the v = 2-1 S(1) line at 2.247 µm to the v 1-0 S(1) line at 2.121 µm. These lines are sufficiently close in wavelength that they can be observed simultaneously with some instruments. Under typical collisional excitation conditions, this ratio is about 1/10; for fluorescence, it is about 1/2. However, this diagnostic is fallible; in particular, at densities approaching 104 cm-3 the v = 2 level may be depopulated by collisions, even if the original "pump" was uv radiation. A more sophisticated approach that requires additional data is to plot the data in a level-population vs. excitation energy diagram (e.g., Hasegawa et al. 1987). In such a diagram, collisionally populated levels will fall along a straight line defined by a single excitation temperature, or a smooth curve for a mixture of thermalized components with a range in temperature (a more realistic case for shocked gas). For a fluorescently excited gas, the vibration or rotation temperatures calculated from different pairs or sets of lines will have different slopes. The difference is illustrated in Fig. 7. A more efficient approach for simply detecting fluorescent emission (as opposed to studying its spectrum) is to observe lines arising from very high v levels, that are absent from a thermal spectrum (e.g., Luhman et al. 1994). Most of the strongest high-v lines, such as the v = 6-4 lines, fall in the J and H bands.

|
Figure 7. Population/excitation-energy diagrams for fluorescent H2 emission (left), and for shock-excited emission (right). Note the disparate values of Tvib and Trot for fluorescence, and the smooth slope of the thermalized gas. (From Hasegawa et al. 1987). |
The second class of PDR models trace the chemistry, heating, and cooling of
uv-irradiated molecular clouds, from the ionization front to deep into
the cloud. The path
length is specified either by N(H) or by AV; the
latter is closely related to the increasing
extinction seen by the uv photons. Temperatures in these regions range
from as high
as 1000K to as low as 50K, depending on the physical conditions, and the
strongest
emission lines are the far-infrared fine-structure lines of [O I] and [C
II]. These are
the main cooling lines for atomic gas over a very wide range of physical
conditions,
approximately 20K < T < 2000K and 2 < log n < 6 (see
Fig. 10 of TH). As discussed
above, the intensity ratios among these lines are diagnostics of
temperature and density
(e.g., Fig. 3). The two key
parameters of PDR models are the intensity of the uv
radiation field, expressed in multiples of a "standard" interstellar
intensity, denoted or
G = IUV / IUV(IS), and the
gas density in. The model yields the run of temperature for
given values of G and n. PDR models have been computed for
conditions ranging from dense, clumpy media
(Burton, Hollenbach, &
Tielens 1990)
to low-density extended gas in galaxies
(Hollenbach,
Takahashi, & Tielens 1991).
The predictions of how the line
intensity ratios map into parameters G and n have been
applied to situations as diverse as galactic nuclei
(Wolfire, Tielens, &
Hollenbach 1990;
Carnal et al. 1994)
and planetary nebulae
(Dinerstein et
al. 1995b).
The ultimate energy source for the collisionally excited emission lines in ionized nebulae and photodissociation regions is the radiation field, although collisions are the proximate cause of the line emission. An alternate heating mechanism is the mechanical action of interstellar shocks (supersonic compressions). Conditions in the "post-shock" region, the material that has already passed through the shock, depend on the shock velocity vs and the "pre-shock density" n0 (the initial density of the gas before it encounters the shock). These are the two primary parameters that are usually extracted from attempts to fit observations of shock-produced emission lines. The ionization, chemical, and thermal structures of the shock and post-shock zone are also affected by the magnetic field strength. Shocks are classified as "J-type" or "C-type" depending on whether there is a discontinuity or "jump" (J) in the gas properties at the interface, or a gradual or "continuous" (C) transition between the pine- and post-conditions (Draine 1980; McKee, Cheinnoff, & Hollenbach 1984). Recent reviews of the theory of interstellar shocks have been presented by Shull & Draine (1987) and Draine & McKee (1993).
Relatively slow shocks (vs
50 km s-1) moving into
molecular clouds cool primarily
through infrared and submillimeter lines of neutral and molecular
species, such as
[O I] 63, 145 µm, [C I] 370, 610 µm, and, at
vs 10 km
s-1, pure-rotation transitions of H2
(Draine, Roberge, &
Dalgarno 1983).
The relative strengths of the different lines
vary with vs, n0, and the shock type
and structure. Given a set of models, the shock
parameters can be constrained by plotting the loci of observed line
ratios in (vs, n0)
phase space (e.g., Fig. 6 of
McKee, Chernoff, &
Hollenbach 1984).
Faster shocks dissociate
the H2 molecules, produce a high-temperature zone that
illuminates the pine-shock
gas with uv radiation (the radiative "precursor"), and ionize some species
(Hollenbach & McKee
1989).
In such cases the H2 molecules may re-form on
the grain surfaces after the
shock passes, and be released into the gas phase. When a number of
different lines are observed, the level populations can be compared with
the predictions of shock models in
order to estimate the magnetic field strength and probe the detailed
shock physics (e.g.,
Brand et al. 1988).
Supernova remnants (SNRs) are an obvious site of fast interstellar
shocks. An interesting,
still unsolved, puzzle is the extreme strength of the near-infrared [Fe
II] lines in
SNRs. This phenomenon was first noticed in IC 443, where the 1.64
µm [Fe II] line vastly
outshines H I Br
(Graham, Wright, &
Longmore 1987).
Indeed, the value of this ratio
in SNRs exceeds its value in H II regions by a factor of about 500! The
dilemma is: can
the strength of the [Fe II] lines be explained entirely by the
ionization structure of the
post-shock region, or it is necessary to invoke grain destruction by the
shock, liberating
Fe atoms and thereby enhancing the gas-phase Fe abundance? A further
complication
is that strong [Fe II] emission may also be produced by photoionization
by a power-law continuum, as in the Crab Nebula
(Graham, Wright, &
Longmore 1990),
and possibly
AGN (see Section V). Observations of multiple
[Fe II] lines can constrain the physical
conditions (Section II), and in combination
with H2 lines, may make it possible to
distinguish among the different proposed mechanisms for enhancing the
[Fe II] emission
(Graham et al. 1991;
Oliva, Moorwood, &
Danziger 1991).
 1.94 µm and dramatically
increasing
strength of [Si VI] 1.96 µm on a timescale of a few weeks. (From
1.94 µm and dramatically
increasing
strength of [Si VI] 1.96 µm on a timescale of a few weeks. (From