


Once one has information about the local physical conditions and understands the mechanism populating the particular emission lines observed in an object (e.g., collisions, radiative pumping, or - not discussed above - direct recombination or recombination cascades), it becomes possible to infer chemical abundances. Essentially, the amount of material required to produce the observed lines is given by the ratio of the line luminosity to the emissivity per ion (where these quantities are integrated over the angular size and along the line of sight). By taking ratios of pairs of lines, one avoids the need to know the source distance. In many cases, ratios enable one to at least partially cancel out the line emissivity dependences on n and T, yielding a relatively accurate value of the abundance ratio. This can be done directly (which is sometimes called an "empirical" determination), or by comparison with ionization structure models. The most elaborate procedure is to compile an extensive set of observed line fluxes, construct a specific model tailored to the particular source, and "tune" the model until the predictions match the observations in detail. Below I discuss some of the areas in which studies of infrared lines have contributed novel information. These include optically obscured sources, ions that have with no observable lines in the optical spectral region, and regions with temperatures so low that they emit only infrared and longer wavelength lines.
4.1. Optically "invisible" gas
As discussed in the Introduction, one of the drivers for observing the
infrared spectral
region is to study objects that are obscured by dust, whether internal
to the object
or in the foreground. One major domain of obscured regions is the entire
inner disk
of the Milky Way, including the Galactic Center region and virtually all
H II regions at
Rgal  5
kpc. Although some information can be determined from radio line
spectroscopy
(including values for Te, which is inversely
correlated with the abundance of the main
coolants), infrared spectroscopy is the most direct way to investigate
properties of the
ionizing stars and to assess global trends such as abundance
gradients. Mid-infrared
observations (8
5
kpc. Although some information can be determined from radio line
spectroscopy
(including values for Te, which is inversely
correlated with the abundance of the main
coolants), infrared spectroscopy is the most direct way to investigate
properties of the
ionizing stars and to assess global trends such as abundance
gradients. Mid-infrared
observations (8
 25 µm) are useful for
studying 5, Ar, and Ne, since more than
one ion of each element is represented in this spectral region (e.g.,
Herter, Helfer, &
Pipher 1983).
Some of these lines, however, are inaccessible from the ground and require
airborne platforms such as the KAO (Kuiper Airborne Observatory) or
satellites (e.g., IRAS;
Simpson & Rubin
1990).
It can be useful to observe some of these infrared lines
even in optically unobscured sources such as planetary nebulae,
where they enable one to measure additional ions of particular elements
(Dinerstein 1980;
Pottasch et
al. 1986).
At longer wavelengths there is the useful line trio of [O III] 52, 88
µm, and [N III]
57 µm. We have already discussed some uses of the first pair
(Section II). Addition of
the 57 µm line provides a measurement of N++ /
O++ which is relatively independent of
local conditions, because the critical densities of all three lines are
similar
(Moorwood et
al. 1980;
Dinerstein 1986).
Observations of these lines in H II regions ranging from the
Galactic Center to outside the solar circle indicate elevated values of
N/O in the inner
Galaxy, although the behavior is not necessarily a simple linear
gradient
(Lester et al. 1987).
25 µm) are useful for
studying 5, Ar, and Ne, since more than
one ion of each element is represented in this spectral region (e.g.,
Herter, Helfer, &
Pipher 1983).
Some of these lines, however, are inaccessible from the ground and require
airborne platforms such as the KAO (Kuiper Airborne Observatory) or
satellites (e.g., IRAS;
Simpson & Rubin
1990).
It can be useful to observe some of these infrared lines
even in optically unobscured sources such as planetary nebulae,
where they enable one to measure additional ions of particular elements
(Dinerstein 1980;
Pottasch et
al. 1986).
At longer wavelengths there is the useful line trio of [O III] 52, 88
µm, and [N III]
57 µm. We have already discussed some uses of the first pair
(Section II). Addition of
the 57 µm line provides a measurement of N++ /
O++ which is relatively independent of
local conditions, because the critical densities of all three lines are
similar
(Moorwood et
al. 1980;
Dinerstein 1986).
Observations of these lines in H II regions ranging from the
Galactic Center to outside the solar circle indicate elevated values of
N/O in the inner
Galaxy, although the behavior is not necessarily a simple linear
gradient
(Lester et al. 1987).
Another type of "invisible" region is gas that is too cool to excite strong line emission in optical/uv transitions, for example gas with extremely high abundances of coolants such as O, N, and S. Such material can be found in gas processed by explosive nucleosynthesis, in supernova remnants and the ejecta of classical novae. When the densities become low enough that the ground state fine-structure lines are not collisionally suppressed, the gas cools extremely efficiently through these lines and the temperature plummets from of order 10,000 K to below 1000 K, causing the optical/uv lines to disappear. Such an "infrared catastrophe" has been predicted to occur in evolving nova ejecta, shifting the main radiative cooling from the optical/uv into the far-infrared lines (Itoh 1981a; Ferland et al. 1984). However, such infrared lines have not yet been directly seen. IRAS saw broad-band infrared emission from several old novae (Dinerstein 1986b), but it has not yet been possible to demonstrate whether these fluxes are due to lines or to thermal emission from dust because of their faintness. Likewise, pure-metal inclusions in old supernova remnants should emit strongly in infrared lines from their constituent elements (Itoh 1981b, c; Dopita, Binette, & Tuohy 1984). Although there is some tantalizing evidence for lines from Gas A (Dinerstein et al. 1987), the presence of a strong thermal continuum from heated dust makes the lines harder to detect (Dwek et al. 1987).
Significant overabundances of particular species can produce strong infrared emission lines in novae and supernovae even while the ejecta are relatively hot. For example, the extremely strong 12.8 µm [Ne II] line seen in QU Vul led to the designation of a new class of novae, the "neon novae" (Gehrz, Grasdalen, & Hackwell 1985). Overabundances of Ne, Si, Mg, and other nearby elements are taken as evidence that this class of novae represents thermonuclear explosions on the surfaces of massive, O-Ne-Mg white dwarfs rather than C-O white dwarfs. An advantage of infrared lines is that they can be seen even if dust condenses in the ejecta, creating internal extinction that can hamper observations of ultraviolet emission lines. The first direct demonstration that Type Ia supernovae produce large amounts of iron was the observation of the 1.64 µm [Fe II] emission line in SN 1983n in M83 (Graham et al. 1986). Some further discussion of abundances in supernovae follows in Section 3.3.
One nagging issue in the use of infrared lines to measure abundance ratios has been the discrepancy between the derived values and values determined from other methods. (I have previously called this the "zero point" issue.) An acute example has been the difference between N/O ratios determined from the far-infrared [O III], [N III] lines and values determined for the same objects from optical lines of [O II] and [N II]. As of several years ago, the infrared determinations of N/O for optically visible H II regions like Orion and M17 were yielding values two to three times higher than the optically determined values (Simpson et al. 1986; Lester et al. 1987).
Various possibilities were proposed as being responsible for this uncomfortable situation. First, does the problem lie in translating from line intensities to ionic abundances? The infrared lines are relatively insensitive to temperature, and their density dependence is well compensated for by deriving the density from the far-infrared [O III] lines; furthermore, the density "bias" introduced by clumping is minimal for this particular line set (Rubin 1989). On the other hand, the optical lines are temperature-sensitive, and furthermore the [O II] lines may be enhanced by dielectric recombination, causing the [N II] / [O II] line ratio to yield too low a value (Rubin 1986). Another possibility lies in the translation from the ionic ratio N++ / O++ to the elemental ratio, N/O. Rubin et al. (1988) advocated application of a correction factor for the relative volumes of N++ and O++, which begin to decouple at stellar temperatures cooler than about 37,000 K. However, their correction factors are based on the fractional volume of these ionization zones integrated over the entire nebula, and therefore substantially overestimate the effect for H II regions that are much larger than the instrument beam used to make the observations, which has been the case for most of the far-infrared observations to date. Furthermore, most of the luminous H II regions studied in the galactic gradient surveys are probably ionized by stars hotter than 37,000 K, except for those close to the Galactic Center.
Finally, the discrepancy might be attributed to the use of incorrect atomic constants, especially collision strengths. Accurate atomic parameters for the far-infrared [O III] have been available for a decade (e.g., Aggarwal 1983), but the value of the [57 µm] collision strength, which is crucial for the ionic ratio, has been uncertain. During the late 1980's, an older value (Nussbaumer & Storey 1979) was replaced by a higher, unpublished value (Butler & Storey 1986). However, the latter has now been superceded by a still larger value, about twice the original one (Blum & Pradhan 1992). This new value lowers the Orion N++ / O++ ratio to 0.27, which is not far from the recent optical redetermination from N+ / O+ of 0.23 (Baldwin et al. 1991). Furthermore, when the new collision strength is applied to planetary nebulae with hot central stars, there is no longer any evidence for a systematic difference between N/O determined from the infrared and the optical lines (Dinerstein et al. 1995a, b).
4.3. Altered & evolving abundances
Infrared lines can provide evidence for the destruction of dust grains and the subsequent liberation of atoms, enhancing the gas-phase abundances of refractory elements relative to their usual depleted values in the interstellar medium. Such an effect may be responsible for the observed strength of near-infrared [Fe II] lines in supernova remnants, as discussed in Section 3.3. A similar effect is seen in the 35 µm [Si II] line in the Galactic Center region (Herter et al. 1989) and in shocked material in Orion (Haas, Hollenbach, & Erickson 1991).
A more exotic situation occurs in supernovae, where actual elemental abundances can change with time due to radioactive decay. In particular, the decay chain of 56Ni -> 56Co -> 56Fe can be tracked through infrared lines. The first indication that this sequence might be observable was the identification of a feature at 10.5 µm in SN 1987A as being due to [Co II] rather than [S IV] (Rank et al. 1988). At shorter wavelengths, spectral monitoring of SN 1987A revealed a dramatic effect: the decay of a [Co II] line and simultaneous growth of an adjacent [Fe II] feature at 1.54 µm (see Fig. 8, from Varani et al. 1990). Nickel was also seen in SN 1987A via [Ni II] lines at 6.63 µm (Wooden et al. 1993) and elsewhere. The spectral region 15-30 µm contains lines of all three elements, Ni, Co, and Fe, and many of these were seen in SN 1987A (Moseley et al. 1989). If the physics of the expanding supernova envelope is sufficiently well understood, or the local conditions can be strongly constrained by diagnostic line ratios, these line strengths can be used to deduce the manufactured masses of these elements. A less dramatic but still important probe of supernova physics is the use of the strong near-infrared He I lines at 1.08, 2.06 µm, which may be the most sensitive indicators of trace amounts of He in a supernova, as, for example, in SN 1993J in M81 (Swartz et al. 1993).
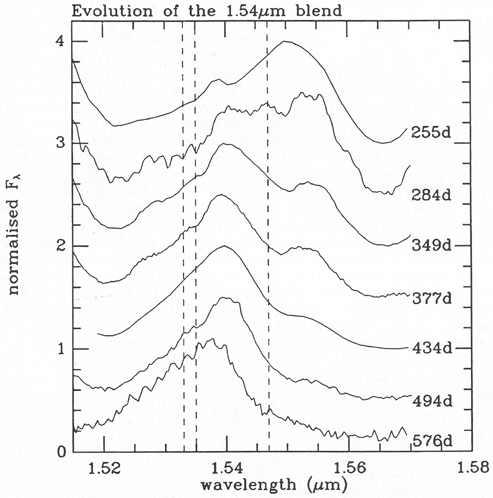
|
Figure 8. Evolution of the spectrum of SN 1987A. The vertical dashed lines indicate, from left to right, the wavelengths of [Fe II] 1.533 µm, [Fe I] 1.535 µm, and [Co II] 1.547 µm. Note the dramatic shift of the line peak as the cobalt decays into iron. (From Varani et al. 1990) |