


ISO has been the most important IR astronomical mission of the 1990s. Launched by ESA, it consisted of a 60 cm telescope operative in a highly eccentric 70000 Km orbit. It included two instruments of cosmological interest (in addition to two spectrographs): a mid-IR 32×32 camera (ISOCAM, 4 to 18 µm), and a far-IR imaging photometer (ISOPHOT, with small 3×3 and 2×2 detector arrays from 60 to 200 µm). The whole payload was cooled to 2 K by a He3 cooling system so performant to allow ISO to operate for 30 months (Nov 1995 to Apr 1998), instead of the nominal 18 months. An excellent review of the extragalactic results from ISO can be found in Genzel & Cesarsky (2000).
9.1. Motivations for deep ISO surveys
While designed as an observatory-type mission, the vastly improved sensitivity offered by ISO with respect to the previous IRAS surveys motivated to spend a relevant fraction of the observing time to perform a set of deep sky explorations at mid- and far-IR wavelengths. The basic argument for this was to parallel optical searches of the deep sky with complementary observations at wavelengths where, in particular, the effect of dust is far less effective in extinguishing optical light. This could have been particularly relevant for investigations of the distant universe, given the large uncertainties implied by the (pobably large) extinction corrections in optical spectra of high redshift galaxies (e.g. Meurer et al. 1997).
Observations in the mid- and far-IR also sample the portion of the e.m. spectrum dominated by dust re-processed light, and are then ideally complementary to optical surveys to evaluate the global energy output by stellar populations and active nuclei.
Organized in parallel with the discovery of the CIRB, a major intent of the deep ISO surveys was to start to physically characterize the distant sources of the background and to single out the fraction contributed by nuclear non-thermal activity in AGNs.
Finally, exploring the sky to unprecedented sensitivity limits should have provided an obvious potential for discoveries of new unexpected phenomena from our local environment up to the most distant universe.
9.2. Overview of the main ISO surveys
Deep surveys with ISO have been performed in two wide mid-IR
(LW2: 5-8.5µm and LW3: 12-18µm)
and two far-IR (![]() = 90 and 170 µm) bands.
The diffraction-limited spatial resolutions were
= 90 and 170 µm) bands.
The diffraction-limited spatial resolutions were ![]() 5 arcsec at 10 µm and
5 arcsec at 10 µm and
![]() 50 arcsec at 100 µm. Mostly because of
the better imaging quality, ISO sensitivity limits in the mid-IR are 1000
times better than at the long wavelengths (0.1 mJy versus 100 mJy).
At some level the confusion problem will remain a fundamental limitation
also for future space missions (SIRTF, FIRST, ASTRO-F).
A kind of compensation to these different performances as a function
of
50 arcsec at 100 µm. Mostly because of
the better imaging quality, ISO sensitivity limits in the mid-IR are 1000
times better than at the long wavelengths (0.1 mJy versus 100 mJy).
At some level the confusion problem will remain a fundamental limitation
also for future space missions (SIRTF, FIRST, ASTRO-F).
A kind of compensation to these different performances as a function
of ![]() derives from the typical FIR
spectra of galaxies and AGNs, which are almost typically one order of
magnitude
more luminous at 100 µm than at 10 µm.
We detail in the following the most relevant programs of ISO surveys.
derives from the typical FIR
spectra of galaxies and AGNs, which are almost typically one order of
magnitude
more luminous at 100 µm than at 10 µm.
We detail in the following the most relevant programs of ISO surveys.
9.2.1. The ISOCAM Guaranteed Time (GT) Extragalactic Surveys
Five extragalactic surveys with the LW2 and LW3 filters have been performed in the ISOCAM GT (GITES, P.I. C. Cesarsky), including large-area shallow surveys and small-area deep integrations. A total area of 1.5 square degrees in the Lockman Hole and the "Marano" southern field have been surveyed, where more than one thousand sources have been detected (Elbaz et al. 1999). These two areas were selected for their low zodiacal and cirrus emissions and because of the existence of data at other wavelengths (optical, radio, X).
9.2.2. The European Large Area ISO Survey (ELAIS)
ELAIS is the most important program in the ISO Open Time (377 hours, P.I. M. Rowan-Robinson, see Oliver et al. 2000a). A total of 12 square degrees have been surveyed at 15 µm with ISOCAM and at 90 µm with ISOPHOT, 6 and 1 sq. degrees have been covered with the two instruments at 6.7 and 170 µm. To reduce the effects of cosmic variance, ELAIS was split into 4 fields of comparable size, 3 in the north, one in the south, plus six smaller areas. While data analysis is still in progress, a source list of over 1000 (mostly 15 µm) sources is being published, including starburst galaxies and AGNs (type-1 and type-2), typically at z < 0.5, with several quasars (including various BAL QSOs) found up to the highest z.
9.2.3. The ISOCAM observations of the two Hubble Deep Fields
Very successful programs by the Hubble Space Telescope have been the two
ultradeep exposures in black fields areas, one in the North and the
other in the South, called the Hubble Deep Fields (HDF).
These surveys promoted a substantial effort of multi-wavelength studies
aimed at characterizing the SEDs of distant and high-z galaxies. These
areas, including the Flanking Fields for a total of ![]() 50 sq. arcmin,
have been observed by ISOCAM (P.I. M. Rowan-Robinson) at 6.7 and 15
µm,
achieving completness to a limiting flux of 100 µJy
at 15 µm.
50 sq. arcmin,
have been observed by ISOCAM (P.I. M. Rowan-Robinson) at 6.7 and 15
µm,
achieving completness to a limiting flux of 100 µJy
at 15 µm.
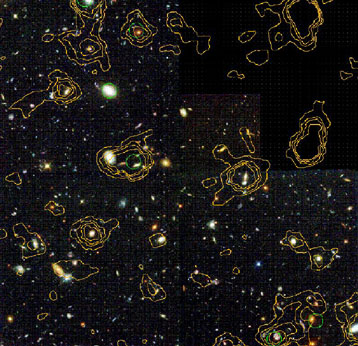
These have been among the most sensitive surveys of ISO and have allowed to discover luminous starburst galaxies over a wide redshift interval up to z = 1.5 (Rowan-Robinson et al. 1997; Aussel et al, 1999). In the inner 10 sq. arcmin, the exceptional images of HST provided a detail morphological information for ISO galaxies at any redshifts (see Figure 4). Furthermore, these two fields benefit by an almost complete redshift information (Cohen et al. 1999), allowing a very detailed characterization of the faint distant IR sources.
9.2.4. ISOCAM survey of two CFRS fields
Two fields from the Canada-France Redshift Survey (CFRS) have been observed with ISOCAM to intermediate depths: the '14+52' field (observed at 6.7 and 15 µm) and the '03+00' field (with only 15µm data, but twice as deep). The CFRS is, with the HDFs, one of the best studied fields with multi-wavelength data. Studies of the galaxies detected in both fields have provided the first tentative interpretation of the nature of the galaxies detected in ISOCAM surveys (Flores et al. 1999).
9.2.5. The ISOPHOT FIRBACK survey program
FIRBACK is a set of deep cosmological surveys in the far-IR,
specifically aimed at detecting at 170 µm the sources
of the far-IR background (P.I. J.L. Puget, see
Puget et al. 1999).
Part of this survey was carried out in the Marano area, and
part in collaboration with the ELAIS team in ELAIS N1 and N2, for a
total of 4 sq. degrees.
This survey is limited by extragalactic source confusion in the large
ISOPHOT beam (90 arcsec) to
S170 ![]() 100 mJy. Some constraints
on the counts below the confusion limit obtained from a fluctuation
analysis of one Marano/FIRBACK field are discussed by
Lagache & Puget (2000)
(Sect. 9.4).
The roughly 300 sources detected are presently
targets of follow-up observations, especially using deep radio exposures
of the same area to help reducing the large ISO errorbox and to
identify the optical counterparts. Also an effort is being made
to follow-up these sources with sub-mm telescopes (IRAM, SCUBA): this
can provide significant constraints on the redshift of sources which
would be otherwise very difficult to measure in the optical
(Sect 12.2).
100 mJy. Some constraints
on the counts below the confusion limit obtained from a fluctuation
analysis of one Marano/FIRBACK field are discussed by
Lagache & Puget (2000)
(Sect. 9.4).
The roughly 300 sources detected are presently
targets of follow-up observations, especially using deep radio exposures
of the same area to help reducing the large ISO errorbox and to
identify the optical counterparts. Also an effort is being made
to follow-up these sources with sub-mm telescopes (IRAM, SCUBA): this
can provide significant constraints on the redshift of sources which
would be otherwise very difficult to measure in the optical
(Sect 12.2).
9.2.6. The Lensing Cluster Surveys
Three lensing galaxy clusters, Abell 2390, Abell 370 and Abell 2218, have received very long integrations by ISOCAM (Altieri et al 1999). The lensing has been exploited to achieve even better sensitivities with respect to ultra-deep blank-field surveys (e.g. the HDFs), and allowed detection of sources between 30 and 100 µJy at 15 µm. However this was obviously at the expense of distorting the areal projection and ultimately making uncertain the source count estimate.
9.2.7. The Japanese Guaranteed Time surveys
An ultra-deep survey of the Lockman Hole in the 7µm ISOCAM band was performed by Taniguchi et al. (1997; the survey field is different from that of the GITES Lockman survey). Another field, SSA13, was covered to a similar depth (P.I. Y. Taniguchi). The Lockman region was also surveyed with ISOPHOT by the same team: constraints on the source counts at 90 and 175 µ were derived by Matsuhara et al. (2000) based on a fluctuation analysis.
ISOCAM data need particular care to remove the effects of glitches induced by the frequent impacts of cosmic rays on the detectors (the 960 pixels registered on average 4.5 events/sec). This badly conspired with the need to keep them cryogenically cooled to reduce the instrumental noise, which implied a slow electron reaction time and longterm memory effects. For the deep surveys this implied a problem to disentangle faint sources from trace signals by cosmic ray impacts.
To correct for that, tools have been developed by various groups for the two main instruments (CAM and PHOT), essentially based on identifying patterns in the time history of the response of single pixels, which are specific to either astrophysical sources (a jump above the average background flux when a source falls on the pixel) or cosmic ray glitches (transient spikes followed by a slow recovery to the nominal background). The most performant algorithm for CAM data reduction is PRETI (Stark et al. 1999), a tool exploiting multi-resolution wavelet transforms (in the 2D observable plane of the position on the detector vs. time sequence). An independent method limited to brighter flux sources, developed by Désert et al. (1999), has been found to provide consistent results with PRETI, in the flux range in common. Other methods have been used by Oliver et al. (2000a) and Lari et al. (2000). These various detection schemes and photometry algorithms have been tested by means of very sophisticated Monte Carlo simulations, including all possible artifacts introduced by the analyses.
With simulations it is has been possible to control as a function
of the flux threshold: the detection reliability, the completeness, the
Eddington bias and photometric accuracy (![]() 10% where enough redundancy was available, as for
CAM HDFs and Ultradeep surveys).
Also the astrometric accuracy is good (of order of 1-2 arcsec for deep
highly-redundant
images), allowing straightforward identification of the sources
(Aussel et al. 1999,
see Fig. 4).
The quality of the results for the CAM surveys is proven by the very
good consistency of the counts from independent surveys (see
Fig. [5] below).
10% where enough redundancy was available, as for
CAM HDFs and Ultradeep surveys).
Also the astrometric accuracy is good (of order of 1-2 arcsec for deep
highly-redundant
images), allowing straightforward identification of the sources
(Aussel et al. 1999,
see Fig. 4).
The quality of the results for the CAM surveys is proven by the very
good consistency of the counts from independent surveys (see
Fig. [5] below).
|
Figure 4. ISOCAM LW3 map ( |
Longer wavelength ISOPHOT observations also suffered from similar problems.
The 175µm counts from PHOT C200 surveys are reliable
above the confusion limit
S170 ![]() 100 mJy, and required only relatively standard
procedures of baseline corrections and "de-glitching".
More severe are the noise problems for the C100 90µm
channel, which would
otherwise benefit by a better spatial resolution than C200.
The C100 PHOT survey dataset is still presently under analysis.
100 mJy, and required only relatively standard
procedures of baseline corrections and "de-glitching".
More severe are the noise problems for the C100 90µm
channel, which would
otherwise benefit by a better spatial resolution than C200.
The C100 PHOT survey dataset is still presently under analysis.
9.4. Mid-IR and far-IR source counts from ISO surveys
IR-selected galaxies have typically red colors, because of the dust responsible for the excess IR emission. The most distant are also quite faint in the optical. For this reason the redshift information is available only for very limited subsamples (e.g. in the HDF North and CFRS areas). In this situation, the source number counts, compared with predictions based on the local luminosity function, provide important constraints on the evolution properties.
Particularly relevant information comes from the mid-IR samples selected from the CAM GITES and HDF surveys in the LW3 (12-18 µm) filter, because they include the faintest, most distant and most numerous ISO-detected sources. They are also easier to identify because of the small ISO error box for redundant sampling at these wavelengths.
Surveys of different sizes and depths are necessary to cover a wide dynamic
range in flux with enough source statistics, which justified performing
a variety of independent surveys at different flux limits.
The differential counts based on these data, shown in
Fig. 5,
reveal an impressive agreement between so many independent samples.
Including ELAIS and IRAS survey data, the range in fluxes would reach
four orders of magnitude.
The combined 15 µm differential counts display
various remarkable features
(Elbaz et al. 1999):
a roughly euclidean slope from the brightest IRAS observed fluxes down to
S15 ![]() 5 mJy, a sudden upturn at
S15 < 3 mJy, with the counts increasing as
dN
5 mJy, a sudden upturn at
S15 < 3 mJy, with the counts increasing as
dN ![]() S-3.1dS to
S15
S-3.1dS to
S15 ![]() 0.4mJy, and evidence for a
flattening below S15
0.4mJy, and evidence for a
flattening below S15 ![]() 0.3mJy (where the slope becomes quickly
sub-Euclidean, N
0.3mJy (where the slope becomes quickly
sub-Euclidean, N ![]() S-2).
S-2).

|
Figure 5. Differential counts at
|
The areal density of ISOCAM 15µm sources
at the limit of ![]() 50-80 µJy is
50-80 µJy is ![]() 5 arcmin-2.
This is nominally the ISO confusion limit at 15 µm,
if we consider that the
diffraction-limited size of a point-source is
5 arcmin-2.
This is nominally the ISO confusion limit at 15 µm,
if we consider that the
diffraction-limited size of a point-source is ![]() 50 arcsec2:
from eq. (8.26) and for
50 arcsec2:
from eq. (8.26) and for ![]() = - 2, confusion sets in at a source areal density
of 0.1/resolution element, or 7/arcmin2 in our case.
The IR sky is so populated at these wavelengths that ISO was confusion
limited longwards of
= - 2, confusion sets in at a source areal density
of 0.1/resolution element, or 7/arcmin2 in our case.
The IR sky is so populated at these wavelengths that ISO was confusion
limited longwards of ![]() = 15 µm. This will also be the
case for NASA's SIRTF
(due to launch in mid 2002), in spite of the moderately larger primary
collector (85cm).
= 15 µm. This will also be the
case for NASA's SIRTF
(due to launch in mid 2002), in spite of the moderately larger primary
collector (85cm).
Obviously, far-IR selected samples are even more seriously affected by
confusion.
The datapoints on the 175µm integral counts reported
in Fig. 6
come from the FIRBACK survey. Similarly deep observations at 90, 150 and
175 µm are reported by
Iuvela, Mattila & Lemke
(2000).
Given the moderate depth of these direct counts,
background fluctuation analyses were used to constrain their
continuation below the survey detection limit. The analysis of small-scale
fluctuations in one FIRBACK field by
Lagache & Puget (2000)
produced
![]()
![]() 0.07 MJy/sr with a beam of size
0.07 MJy/sr with a beam of size
![]()
![]() 6 10-4 sr.
From eq. [8.25], this may be used to constrain the continuation of the
counts in Fig. 6 fainter than 100 mJy.
6 10-4 sr.
From eq. [8.25], this may be used to constrain the continuation of the
counts in Fig. 6 fainter than 100 mJy.

|
Figure 6. Integral counts based on the
ISOPHOT FIRBACK survey (Sect.10.2.5) at
|
The 15µm counts in Fig. 5
display a remarkable convergence below
S15 ![]() 0.2 mJy, proven by at least three independent
surveys. The
asymptotic slope flatter than -1 in integral count units implies a
modest contribution
to the integrated CIRB flux by sources fainter than this limit, unless a
sharp upturn of the counts would happen at much fainter fluxes
with very steep number count distributions, a rather unplausible situation.
A meaningful estimate of the CIRB flux can then be obtained from direct
integration of the observed mid-IR counts (the two datapoints at 15 and 7
µm in Fig. 3).
If we further consider how close these are to the upper limits set by
the observed TeV cosmic opacity
(Fig. 3), the ISOCAM surveys appear to
have
resolved a significant (50-70%) fraction of the CIRB in the mid-IR.
On the other hand, the depth of the ISO far-IR surveys (FIRBACK) is not
enough to resolve more than ten percent of the CIRB at its peak wavelenth.
0.2 mJy, proven by at least three independent
surveys. The
asymptotic slope flatter than -1 in integral count units implies a
modest contribution
to the integrated CIRB flux by sources fainter than this limit, unless a
sharp upturn of the counts would happen at much fainter fluxes
with very steep number count distributions, a rather unplausible situation.
A meaningful estimate of the CIRB flux can then be obtained from direct
integration of the observed mid-IR counts (the two datapoints at 15 and 7
µm in Fig. 3).
If we further consider how close these are to the upper limits set by
the observed TeV cosmic opacity
(Fig. 3), the ISOCAM surveys appear to
have
resolved a significant (50-70%) fraction of the CIRB in the mid-IR.
On the other hand, the depth of the ISO far-IR surveys (FIRBACK) is not
enough to resolve more than ten percent of the CIRB at its peak wavelenth.