


Cosmological background radiations are a fundamental channel of information about cosmic high-redshift sources, particularly if, for technological limitations, observations of faint sources in a given waveband are not possible. This was clearly the case for the IR/sub-mm domain. The present Section is dedicated to a review on a recently discovered new cosmic component, the cosmological background at IR and sub-millimetric wavelengths (CIRB), an important achievement made possible by the NASA's Cosmic Background Explorer (COBE) mission.
To appreciate the relevance of this discovery (anticipated by a detailed
modellistic prediction by
Franceschini et al. 1994),
consider that extragalactic backgrounds at other wavelengths contain
only modest (undiscernible) contributions by distant galaxies.
The Radio background is clearly dominated by radio-loud AGNs;
the Cosmic Microwave Background includes photons generated at
z ![]() 1500;
the X-ray and
1500;
the X-ray and ![]() -ray backgrounds are dominated by distant quasars and AGNs.
Also, diffuse light in the optical-UV (and partly the near-IR) will be
hardly depurated
of the foreground contaminations (in particular, Galactic starlight
reflected by high latitude "cirrus" dust, and Zodiacal-reflected Sun-light).
-ray backgrounds are dominated by distant quasars and AGNs.
Also, diffuse light in the optical-UV (and partly the near-IR) will be
hardly depurated
of the foreground contaminations (in particular, Galactic starlight
reflected by high latitude "cirrus" dust, and Zodiacal-reflected Sun-light).
On the other hand, the recently completed third experiment (DIRBE) of the COBE mission has brought to the first detection ever (with surprisingly small uncertainties) of the integrated emission of distant galaxies in the form of an isotropic signal in the far-IR and sub-mm (Puget et al. 1996, Guiderdoni et al. 1997, Hauser et al. 1998, Fixsen et al. 1998).
8.1. Observational status about the CIRB
In spite of the presence of very bright foregrounds (Zodiacal and Interplanetary dust emission, Galactic Starlight, high-latitude "cirrus" emission), relatively clean spectral windows exist in the IR suitable for extragalactic research: the near-IR cosmological window (2-4 µm) and the sub-mm window (100-500 µm). At these wavelengths the Zodiacal, Starlight, and emission by high galactic latitude dust produce two minima in the total foreground intensity, which is much lower here than it is in the optical-UV.
These spectral windows occur where we would expect to observe the redshifted
photons from the two most prominent galaxy emission features:
the stellar photospheric peak at
![]()
![]() 1 µm and the one at
1 µm and the one at
![]()
![]() 100 µm due to dust re-radiation.
The best chances to detect the integrated emission of distant and
primeval galaxies are here.
100 µm due to dust re-radiation.
The best chances to detect the integrated emission of distant and
primeval galaxies are here.
For a curious coincidence, the (expected) integrated emission of distant galaxies turns out to be comparable by orders of magnitude to the Galaxy emission at the Pole and to the Zodiacal light in the near-IR window. This implies that a delicate subtraction of the foreground emissions is required to access the extragalactic domain.
Three main observational routes have been followed to measure the CIRB:
In sky directions outside obvious Galactic sources, like star-forming and
low-galactic latitude regions,
the total far-IR background is due to the contribution of various dust
components in the ISM: galactic dust associated with neutral and ionized
hydrogen,
the interplanetary dust emission, all adding to the isotropic diffuse
flux, the CIRB. The way to subtract these various foregrounds when
estimating the CIRB intensity is to exploit the different
spatial dependencies of the various components, using the correlations with
appropriate dust tracers like the HI 21 cm or H![]() lines.
lines.
To subtract the most important foreground in the far-IR, the galactic dust
emission, the simplest procedure is to determine the parameters of the
correlation between the background intensity I![]() and the dust tracers expressed in terms
of equivalent hydrogen column density NH,
and then to evaluate the CIRB as the intercept of the total flux at
NH = 0.
and the dust tracers expressed in terms
of equivalent hydrogen column density NH,
and then to evaluate the CIRB as the intercept of the total flux at
NH = 0.
Another method is to perform an all-sky best-fit analysis of a relation like
I![]() =
C1NH(HI) +
C2NH(II) + CIRB,
NH being the column densities
of the dust components associated with the neutral and ionized H,
CIRB being the extragalactic background intensity at the working
wavelength (e.g,
Lagache et al. 1999).
The best-fitting determines the constant C1and
C2 and allows
to estimate a value for the parameter CIRB.
=
C1NH(HI) +
C2NH(II) + CIRB,
NH being the column densities
of the dust components associated with the neutral and ionized H,
CIRB being the extragalactic background intensity at the working
wavelength (e.g,
Lagache et al. 1999).
The best-fitting determines the constant C1and
C2 and allows
to estimate a value for the parameter CIRB.
Puget et al. (1996)
first recognized in the
all-sky FIRAS/COBE maps an isotropic signal (independent of Galactic
coordinates) with an intensity that can be represented by the law
![]() B
B![]()
![]() 3.4 × 10⁻⁹(
3.4 × 10⁻⁹(![]() /400µm)-3
W m-2 sr-1 in the 400-1000
µm interval.
/400µm)-3
W m-2 sr-1 in the 400-1000
µm interval.
This tentative detection has been later confirmed with independent
analyses by various other groups (e.g. by
Fixsen et al. 1998,
who find significant isotropic signal from 200 and 1000
µm), as well as
by analyses of data from the DIRBE experiment on COBE in two broad-band
channels at
![]() = 140 and 240µ
(Hauser et al. 1998).
Finkbeiner, Davies &
Schlegel (2000),
after a very delicate subtraction of the far dominant Galactic and IPD
foregrounds,
found an isotropic signal at 60 and 100 µm with
intensity at the level of
= 140 and 240µ
(Hauser et al. 1998).
Finkbeiner, Davies &
Schlegel (2000),
after a very delicate subtraction of the far dominant Galactic and IPD
foregrounds,
found an isotropic signal at 60 and 100 µm with
intensity at the level of
![]() 30 10-9 W m-2
sr-1. This latter result is presently under
discussion, but appears to conflict with independent estimates (see
Sect. 8.2).
30 10-9 W m-2
sr-1. This latter result is presently under
discussion, but appears to conflict with independent estimates (see
Sect. 8.2).
Recent analyses by Dwek & Arendt (1998) and Gorjian, Wright & Chary (2000) have tentatively found also a signal in the near-IR cosmological window at 3.5 µm and in the J, H and K DIRBE bands, however with large uncertainties because of the problematic evaluation of the Zodiacal (scattered) light. Because of this, CIRB estimates particularly in J, H and K are to be taken more reliably as upper limits.
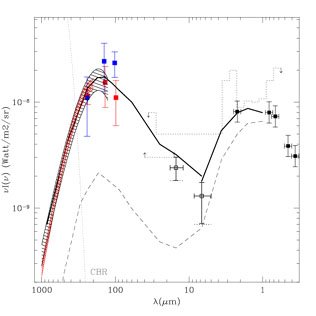
To avoid overcrowding, we report in Figure 3 only the most recent results from DIRBE (Lagache et al. 1999; Finkbeiner, et al. 2000) and FIRAS (Fixsen et al. 1998).
|
Figure 3. The Cosmic Infrared Background (CIRB) as measured by independent groups in the all-sky COBE maps (e.g. Hauser et al. 1998), compared with the optical extragalactic background estimated from ultradeep optical integrations by the HST in the HDF (Madau & Pozzetti 2000). Three datapoints in the far-IR are from a re-analysis of the DIRBE data by Lagache et al. (1999), the shaded area from Fixsen et al. (1998) and Lagache et al. The two mid-IR points are the resolved fraction of the CIRB by the deep ISO surveys GITES, while dashed lines are limits set by TeV cosmic opacity (Sect. 8.2). The dotted line marks the expectation based on the assumption that the IR emissivity of galaxies does not change with cosmic time. The thick line is the predicted CIRB intensity by the model discussed in Sect. 11. |
No isotropic signals are significantly detected at
4µ < ![]() < 60µ, any cosmological flux being far
dominated here by the
Zodiacal light, the Interplanetary dust (IPD) emission and by Galactic
dust emission
(only missions to the outer Solar System would have chances to reduce the
dominant IPD flux to achieve detection of the CIRB here).
The constraints we report at these wavelengths come from indirect estimates
based on the cosmic high-energy opacity (Sect. 8.2
below).
< 60µ, any cosmological flux being far
dominated here by the
Zodiacal light, the Interplanetary dust (IPD) emission and by Galactic
dust emission
(only missions to the outer Solar System would have chances to reduce the
dominant IPD flux to achieve detection of the CIRB here).
The constraints we report at these wavelengths come from indirect estimates
based on the cosmic high-energy opacity (Sect. 8.2
below).
Altogether, after four years of very active debate among various teams
working
on the COBE data, first about the existence and later on the intensity
and spectral
shape of CIRB, there is now ample consensus even on details of CIRB's
spectral intensity, at least from 140 to 300 µm where
it is most reliably measured and where two completely independent
datasets (FIRAS and DIRBE, with independent
absolute calibrations) are available.
The CIRB flux has in particular stabilized at values
![]() I
I![]()
![]() 24±5
and
24±5
and
![]() I
I![]()
![]() 15±5 10-9
Watt/m2/sr at
15±5 10-9
Watt/m2/sr at
![]() = 140 and
240 µm.
Modest differences in the absolute calibration of
FIRAS and DIRBE around 100 µ have been reported
(Hauser et al. 1998),
but these do not seem to affect the overall result.
= 140 and
240 µm.
Modest differences in the absolute calibration of
FIRAS and DIRBE around 100 µ have been reported
(Hauser et al. 1998),
but these do not seem to affect the overall result.
This was a fundamental achievement for observational cosmology,
providing the
global energy density radiated by cosmic sources at any redshifts.
Two concomitant facts, the very strong K-correction for galaxies in the
far-IR/sub-mm
implied by the very steep and featureless dust spectra, and their relative
robustness due to the modest dependence of dust equilibrium temperature
T on
the field intensity (eq. 3.6]) have suggested to use the CIRB spectrum
to infer the evolution of the galaxy long-wavelength emissivity as a
function of redshift
(Gispert, Lagache & Puget
2000).
Indeed, while the peak intensity at
![]() = 100 to 200 µm constrains the
galaxy emissivity at z = 0 to z = 1, the quality of the
FIRAS intensity maps and the low foreground contamination at
= 100 to 200 µm constrains the
galaxy emissivity at z = 0 to z = 1, the quality of the
FIRAS intensity maps and the low foreground contamination at
![]() > 200 µm allow to
set important constraints on the universal emissivity at z > 1.
> 200 µm allow to
set important constraints on the universal emissivity at z > 1.
Between 100 and 1000 µm the integrated CIRB intensity
turns out to be ![]() 30±5 10-9
Watt/m2/sr. In addition to this
measured part of the CIRB, one has to consider the
presently un-measurable fraction resident in the frequency decade
between 100 and 10 µm.
This flux is larger than the integrated "optical background"
(
30±5 10-9
Watt/m2/sr. In addition to this
measured part of the CIRB, one has to consider the
presently un-measurable fraction resident in the frequency decade
between 100 and 10 µm.
This flux is larger than the integrated "optical background"
(![]() 17 nWatt/m2/sr, see
Fig. 3),
obtained by counting all galaxies detected between 0.3 and 3
µm by HST down to the
faintest detectable sources. This procedure to estimate the
"optical background" relies on the fact that optical counts show a clear
convergence at magnitudes
mAB
17 nWatt/m2/sr, see
Fig. 3),
obtained by counting all galaxies detected between 0.3 and 3
µm by HST down to the
faintest detectable sources. This procedure to estimate the
"optical background" relies on the fact that optical counts show a clear
convergence at magnitudes
mAB ![]() 22
(Madau & Pozzetti
2000),
such that the expected
contribution by sources fainter than HST limiting fluxes appears negligible
(a significant upwards revision of this optical background suggested by
Bernstein et al. [1998]
to account for low surface brigtness emission by galaxies is not confirmed).
22
(Madau & Pozzetti
2000),
such that the expected
contribution by sources fainter than HST limiting fluxes appears negligible
(a significant upwards revision of this optical background suggested by
Bernstein et al. [1998]
to account for low surface brigtness emission by galaxies is not confirmed).
Already the directly measured part of the CIRB sets a relevant constraint on the evolution of cosmic sources, when compared with the fact mentioned in Sect. 4.2.5 that for local galaxies only 30% of the bolometric flux is absorbed by dust and re-emitted in the far-IR. The CIRB's intensity matching or even exceeding the optical background tells unequivocally that galaxies in the past should have been much more "active" in the far-IR than in the optical, and very luminous in an absolute sense. A substantial fraction of the whole energy emitted by high-redshift galaxies should have been reprocessed by dust at long wavelengths.
8.2. Constraints from observations of the cosmic high-energy opacity
As originally suggested by F. Stecker soon after the discovery of
high-energy
photon emissions from distant blazars, high-energy spectral observations
may provide
a suitable alternative to the direct detection of the CIRB at
wavelengths where it is currently impossible.
The idea is to infer the CIRB intensity from combined GeV and TeV
observations of a set of Blazars by exploiting the
![]()
![]()
![]() interaction of their emitted high
energy photons with those of the CIRB.
interaction of their emitted high
energy photons with those of the CIRB.
The absorption cross-section of ![]() -rays of energy E
-rays of energy E![]() [TeV]
has a maximum for IR photons with energies obeing the condition
(Stecker, de Jager &
Salomon 1992):
[TeV]
has a maximum for IR photons with energies obeing the condition
(Stecker, de Jager &
Salomon 1992):
|
which implies
| (8.15) |
The optical depth for a high-energy photon E0
travelling through a cosmic medium
filled of low-energy photons with density ![]() (z) from ze to the present time is
(z) from ze to the present time is
| (8.16) |
Coppi & Aharonian (1999) report the following analytical approximation, good to better than 40%, to eq. (8.16):

| (8.17) |
Interesting applications of this concept have been possible when data from the Compton Gamma Ray Observatory and from hard X-ray space telescopes have been combined with observations at TeV energies by the Whipple and other Cherenkov observatories on the Earth.
Stanev & Franceschini (1998) have obtained model-independent upper limits on the CIRB with no a-priori guess about the CIRB spectrum, using HEGRA data for the Blazar MKN 501 (z = 0.034) during an outburst in 1997, on the assumption that the high-energy source spectrum is the flattest allowed by the data. These limits (see Fig. 3) get quite close to the CIRB background already resolved by the ISO mid-IR deep surveys (see Sect. 9).
More recently,
Krawczynski et al. (1999)
have combined the observations of MKN501
during the 1997 outburst with X-ray data from RossiXTE and BeppoSAX,
providing a simultaneous
high-quality description of the whole high-energy spectrum. These data
are very well fitted
by a Synchrotron Self Compton (SSC) model in which the spectrum at
![]() = 1027Hz is produced
by Inverse Compton of the hard X-ray spectrum at
= 1027Hz is produced
by Inverse Compton of the hard X-ray spectrum at
![]() = 1018Hz: the combination
of the two provides solid constraints on the shape of the "primary"
(i.e. before cosmic attenuation) spectrum at TeV energies. This is used
to derive
= 1018Hz: the combination
of the two provides solid constraints on the shape of the "primary"
(i.e. before cosmic attenuation) spectrum at TeV energies. This is used
to derive ![]() as a function of energy and, after eqs. 8.16 and 8.17, a constraint on
the spectral intensity of the CIRB.
The result is compatible with the limits by
Stanev & Franceschini
(1998)
and allows to get a tentative estimate of the CIRB intensity in the
interval from
as a function of energy and, after eqs. 8.16 and 8.17, a constraint on
the spectral intensity of the CIRB.
The result is compatible with the limits by
Stanev & Franceschini
(1998)
and allows to get a tentative estimate of the CIRB intensity in the
interval from ![]() = 10
to 40 µm (see Fig. [3]),
which is formally dependent, however, on the SSC model
adopted for the intrinsic source spectrum.
= 10
to 40 µm (see Fig. [3]),
which is formally dependent, however, on the SSC model
adopted for the intrinsic source spectrum.
Less model dependent is the constraint set by the observations of purely
power-law Blazar spectra around
E![]()
![]() 1 TeV, which translates into the upper limit
of about 10 nanoWatt/m2/sr at
1 TeV, which translates into the upper limit
of about 10 nanoWatt/m2/sr at
![]()
![]() 1 µm shown in
Fig. 3.
Substantially exceeding that, as suggested by some authors (Bernstein et
al., Gorjian et al.), would imply either very "ad hoc"
1 µm shown in
Fig. 3.
Substantially exceeding that, as suggested by some authors (Bernstein et
al., Gorjian et al.), would imply either very "ad hoc" ![]() -ray source spectra or new physics
(Harwit, Proteroe &
Bierman 1999).
-ray source spectra or new physics
(Harwit, Proteroe &
Bierman 1999).
8.3. Contribution of cosmic sources to the CIRB: the formalism
A simple formalism relates background intensity and cell-to-cell anisotropies to the statistical properties (luminosity functions and number counts) of the contributing sources.
8.3.1. Source contribution to the background intensity
The differential number counts (sources/unit flux interval/unit solid angle) at a given flux S write:
| (8.18) |
where
![]() [L(S, z), z] is the
epoch-dependent luminosity function and
dV/dz is the differential volume element.
Flux S and rest-frame luminosity L are related by
[L(S, z), z] is the
epoch-dependent luminosity function and
dV/dz is the differential volume element.
Flux S and rest-frame luminosity L are related by
| (8.19) |
where dL is the luminosity distance and
K(L, z) = (1 + z)![]() the K-correction.
The contribution of unresolved sources (sources fainter than the
detection limit Sd) to the background intensity is
given by:
the K-correction.
The contribution of unresolved sources (sources fainter than the
detection limit Sd) to the background intensity is
given by:
| (8.20) |
having defined the volume emissivity jeff(z) as
| (8.21) |
where Lmin and
Lmax are the minimum and the maximum source
luminosities. From eq. (8.20) we can note that, when the counts converge
like dN/dS ![]() S-2 or flatter, the contribution by
faint sources to the
background intensity becomes almost insensitive to the source minimum flux
[I
S-2 or flatter, the contribution by
faint sources to the
background intensity becomes almost insensitive to the source minimum flux
[I ![]() ln(Smin) or less]. This
property has been used by
Madau & Pozzetti (2000)
to estimate the optical background intensity (see
Fig. 3) from ultra-deep HST
counts of galaxies, by exploiting the convergence of the optical counts
fainter than mAB
ln(Smin) or less]. This
property has been used by
Madau & Pozzetti (2000)
to estimate the optical background intensity (see
Fig. 3) from ultra-deep HST
counts of galaxies, by exploiting the convergence of the optical counts
fainter than mAB ![]() 22. A similar property of faint IR sources is used in
Sect. 9.4 to estimate the
contribution of IR galaxies to the CIRB.
22. A similar property of faint IR sources is used in
Sect. 9.4 to estimate the
contribution of IR galaxies to the CIRB.
8.3.2. Small scale intensity fluctuations
In addition to the average integrated flux by all sources in a sky area,
the background radiation contains also spatial information (the
cell-to-cell fluctuations) which can be used to further constrain the
source flux distribution and spatial correlation properties (e.g.
De Zotti et al. 1996).
The usually most important contribution to the cell-to-cell intensity
fluctuations comes from the stochastic nature of the spatial
distribution of sources among elementary cells with an effective solid
angle
![]() (Poisson fluctuations). They can be
expressed as
(Poisson fluctuations). They can be
expressed as
| (8.22) |
What is really measured, however, is not
the flux S but the detector's response
x = f (![]() ,
,![]() )S,
f (
)S,
f (![]() ,
,![]() ) being the angular power pattern of the detector.
Let R(x) =
) being the angular power pattern of the detector.
Let R(x) =
![]() dN
dN![]() x /
f (
x /
f (![]() ,
,![]() )
)![]() /
dS . d
/
dS . d![]() /f (
/f (![]() ,
,![]() )
be the mean number of source responses of intensity x.
For a Poisson distribution of the number of sources producing a response
x, its variance equals the mean R(x)dx.
Adding the variances of all responses up to the cutoff value
xc (brighter
sources are considered to be individually detected) gives
the contribution of unresolved sources to fluctuations:
)
be the mean number of source responses of intensity x.
For a Poisson distribution of the number of sources producing a response
x, its variance equals the mean R(x)dx.
Adding the variances of all responses up to the cutoff value
xc (brighter
sources are considered to be individually detected) gives
the contribution of unresolved sources to fluctuations:
| (8.23) |
The cutoff xc is chosen to be some factor q times
(![]() I)2;
usually q = 3-5. The rms background fluctuations (
I)2;
usually q = 3-5. The rms background fluctuations (![]() I) imply a sky noise
I) imply a sky noise
![]() =
= ![]() (
(![]() I)2
I)2![]() for observations with spatial resolution
for observations with spatial resolution
![]() .
.
The integrated signal D recorded by the detector
is the sum of the responses x due to all sources in the angular
resolution element. Its probability distribution function
P(D) is informative on the amplitude and slope of counts
of unresolved sources.
Scheuer (1957)
has shown that its Fourier transform, p(![]() ), is a simple
function of the FT r(
), is a simple
function of the FT r(![]() ) of R(x):
p(
) of R(x):
p(![]() ) = exp[r(
) = exp[r(![]() ) - r(0)].
It follows:
) - r(0)].
It follows:
| (8.24) |
This synthetic P(D) has to be convolved with the noise
distribution to be compared with the
observations. Assumed that the number count distribution below the
detection limit can be represented as a power-law,
N( > S) = K(S /
Sk)-![]() , then eq. [8.24] can be integrated to get
(Condon 1974):
, then eq. [8.24] can be integrated to get
(Condon 1974):
| (8.25) |
which allows to estimate the slope of the counts (![]() ) below the detection
limit from a given measured value of the cell-to-cell fluctuations
) below the detection
limit from a given measured value of the cell-to-cell fluctuations
![]() .
This constraint on N(S) applies down to a flux limit
corresponding to
.
This constraint on N(S) applies down to a flux limit
corresponding to
![]() 1 source/beam. Assumed that Sk
represents the confusion limit (Sk = q ×
1 source/beam. Assumed that Sk
represents the confusion limit (Sk = q × ![]() ) of a survey having an areal resolution
) of a survey having an areal resolution
![]() ,
then eq. 8.25 further simplifies to a relation
between the number of sources K resolved by the survey (and
brighter than Sk) and the parameters q and
,
then eq. 8.25 further simplifies to a relation
between the number of sources K resolved by the survey (and
brighter than Sk) and the parameters q and ![]() :
:
| (8.26) |
this implies the confusion limit to occur at the flux corresponding to
an areal density of
(![]() q2/[2 -
q2/[2 - ![]() ])-1 sources per unit beam area
])-1 sources per unit beam area
![]() . For euclidean
counts and q = 3, this corresponds to 1 source/27
beams. Confusion limits based on this
criterion for various IR observatories are indicated in
Figs. 6 and
7 below.
. For euclidean
counts and q = 3, this corresponds to 1 source/27
beams. Confusion limits based on this
criterion for various IR observatories are indicated in
Figs. 6 and
7 below.