Copyright © 1997 by Annual Reviews. All rights reserved
| Annu. Rev. Astron. Astrophys. 1997. 35:
267-307 Copyright © 1997 by Annual Reviews. All rights reserved |


2.1. Surface Brightness Selection and Galaxy Visibility
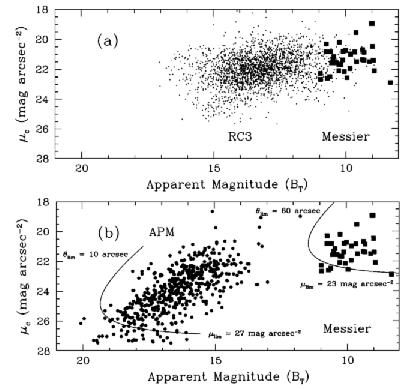
For selecting and cataloging galaxies, the simplest assumption is that galaxies form a univariate distribution in apparent brightness. Figure 1a shows the distribution in apparent brightness and effective suface brightness in B of the galaxies from the Messier catalog and a much larger number of galaxies from the Third Reference Catalog of Bright Galaxies (de Vaucouleurs et al 1991; hereafter RC3). Messier produced a catalog of the most prominent nebulae in the sky, as a guide to stationary objects that comet-hunters should avoid. The intervening two centuries have yielded photographic all-sky galaxy samples that reach apparent brightness that is hundreds of times fainter but not substantially fainter in average surface brightness. Despite the inhomogeneous nature of these samples, these data support the idea of a characteristic surface brightness for galaxies.
| |
Figure 1. (a) Effective surface brightness in the B band plotted against apparent magnitude for Messier galaxies (filled squares) and RC3 galaxies (small dots). (b) Effective surface brightness plotted aginst apparent magnitude for Messier galaxies (filled squares) and LSB galaxies with redshifts from the APM survey (filled circles). The curves show the approximate selection functions for each sample. (From de Vaucouleurs et al 1991, and Impey et al 1996.) | |
SPECIFYING A GALAXY CATALOG
Any galaxy catalog is specified by three parameters: the surface
brightness of the limiting isophote (µlim), the
isophotal magnitude limit (mlim), and the isophotal
size limit in arcseconds at the limiting isophote
( lim). Assuming
symmetric galaxies with no internal absorption,
the fraction of the galaxy flux detected above the limiting isophote is
lim). Assuming
symmetric galaxies with no internal absorption,
the fraction of the galaxy flux detected above the limiting isophote is

| (1) |
for spiral disks and

| (2) |
for ellipticals and bulges. The formalism was first presented by Disney & Phillipps (1983). These relations have maxima which occur at µlim - µ0 = 5.37 for spiral disks, and µlim - µ0 = 10.93 for ellipticals, where µ0 is the central surface brightness.
The observed distribution of galaxy central surface brightness has long
been known to be peaked. In the earliest work on the subject, the
maximum value for spirals was at
µ0 = 21.6 ± 0.4 mag arcsec-2 in
B
(Freeman 1970),
and the maximum value for ellipticals was at
µ0 = 14.8 ± 0.9 mag arcsec-2 in
B
(Fish 1964).
Subsequently, the distributions have been found to be somewhat broader,
with a dispersion of
 (µ0)
= 2 mag arcsec-2 for spirals
(Boroson 1981,
van der Kruit 1987,
Bosma & Freeman 1993,
Courteau 1996),
and a dispersion of
(µ0)
= 1.5 mag arcsec-2 for ellipticals
(Kormendy 1977).
The peaks may reflect an intrinsic property of the
galaxy population, a selection effect, or both.
(µ0)
= 2 mag arcsec-2 for spirals
(Boroson 1981,
van der Kruit 1987,
Bosma & Freeman 1993,
Courteau 1996),
and a dispersion of
(µ0)
= 1.5 mag arcsec-2 for ellipticals
(Kormendy 1977).
The peaks may reflect an intrinsic property of the
galaxy population, a selection effect, or both.
At this point, we make the simplifying assumption that LSB galaxies are suitably described by exponential radial profiles. Late type galaxies are composite stellar systems, where the ratio of disk to bulge flux is D/B = 0.28(s / re)2{(I0)disk / (Ie)bulge}, where the disk exponential scale length s and the bulge effective radius re are measured in arcseconds. The assumption of exponential profiles is only valid for disk dominated systems, which is appropriate for most deep galaxy surveys. The HST Medium Deep Survey finds ~ 80% of the I band selected sample to be well fit by exponentials (Im et al 1995b). Among low luminosity galaxies, dwarf ellipticals and dwarf irregulars have long been known to have exponential profiles (Binggeli, Sandage & Tarenghi 1984, Gallagher & Hunter 1984). More recently, low luminosity LSB galaxies in clusters have been shown to be well fit by exponential profiles (e.g. Caldwell & Bothun 1987, Impey, Bothun & Malin 1988, Davies, Phillipps & Disney 1990, Bothun, Impey & Malin 1991).
In Figure 1b, the Messier galaxies are compared with the low surface brightness galaxies from a recent survey carried out using Automated Plate Measuring (APM) machine scans of UK Schmidt sky survey plates. This survey is used here to illustrate the issues of surface brightness selection effects, because it is the largest set of field LSB galaxies for which redshifts have been published (Impey et al 1996). The superimposed curves represent the spiral selection function described by equation (1). As surveys probe to smaller fractions of the night sky brightness, the accessible parameter space for detecting galaxies expands. Objects are missed at faint µ0 owing to the poor contrast with the sky brightness. Objects are missed at faint mtot because they become smaller than the limiting angular size at the limiting isophote. Objects are missed (in principle) at bright µ0 and faint mtot because they become difficult to resolve from stars.
Practical limitations also exist in the detection of galaxies. For the APM survey, Sprayberry, Impey & Irwin (1996) found 50% completeness for µ0 = 24 B mag arcsec-2 and s = 10 arcsec, or µ0 = 23 B mag arcsec-2 and s = 3 arcsec. Photographic amplification of UK Schmidt plates reaches a limiting isophote a factor of two deeper (Malin 1978; Impey, Bothun & Malin 1988). With the new Kodak Technical Pan 4415 emulsion, these limits will become µ0 = 25.5 mag arcsec-2 for s = 10 arcsec in the red, or µ0 = 25 mag arcsec-2 for s = 3 arcsec again in the R band (Schwartzenberg, Phillipps & Parker 1995b). Digital coaddition of scanned films should yield an additional improvement factor of two to three. The detection of faint, extended objects with CCDs is limited by the photon flux and the quality of the flat field. Small scale variations in background can be caused by the detector (i.e. fringing at long wavelengths) or the sky (i.e. faint sources in the sky flat). In practice, it is difficult to achieve flat fields to better than 0.1-0.2% of the sky brightness (Tyson 1988a). In addition, Capaccioli & de Vaucouleurs (1983) have argued that systematic errors preclude reliable surface photometry much fainter than 28 mag arcsec-2 . A typical limit for CCD surveys is µ0 = 27 mag arcsec-2 and s = 10 arcsec, or µ0 = 26.5 mag arcsec-2 and s = 3 arcsec (Schwartzenberg et al 1995a), although galaxy classification is extremely difficult at that level. Phillipps & Disney (1985) have argued that the limit for detecting LSB objects by indirect methods, such as star and galaxy counts, can be as low as 29-30 mag arcsec-2 . The lowest backgrounds for the detection of LSB objects are in the vacuum ultraviolet and the near infrared, as seen from space (Wright 1985, O'Connell 1987, O'Neil et al 1996).
GALAXY VISIBILITY The visibility of galaxies is governed by the point at which they are lost from the sample by either falling below the angular size or the flux limit of the survey. Using the expression for the radial intensity profile, the limiting angular diameter at the isophotal limit can be calculated (see Allen & Shu 1979)

| (3) |
and the case of a flux limit is

| (4) |
We now assume that the number of galaxies observed is proportional to
the volume sampled. This implies a survey large enough to include a fair
sample of galaxies in the local universe. It also implies that galaxies
which cover the full range of structural parameters can be observed at
some point in the volume
(i.e. no correction factor can be applied for galaxy types which are not
detected). In this case n(µ0)
 lim-3
for the angular size limit, and n(µ0)
Slim-3/2 for the flux limit. The inevitable
consequence of this visibility argument is that the detectability of
galaxies is a strong function of surface brightness. The corollary is
that the limiting distance to which a galaxy can be observed is a strong
function of surface brightness, since
dlim
lim-1
for an angular size limit, and
dlim
Slim-1/2 for a flux limit.
Davies (1990)
has modelled the visibility of inclined two-component bulge/disk
galaxies. Although the selection function no longer has a simple
analytical form, the basic features of the more simple treatment are
confirmed.
lim-3
for the angular size limit, and n(µ0)
Slim-3/2 for the flux limit. The inevitable
consequence of this visibility argument is that the detectability of
galaxies is a strong function of surface brightness. The corollary is
that the limiting distance to which a galaxy can be observed is a strong
function of surface brightness, since
dlim
lim-1
for an angular size limit, and
dlim
Slim-1/2 for a flux limit.
Davies (1990)
has modelled the visibility of inclined two-component bulge/disk
galaxies. Although the selection function no longer has a simple
analytical form, the basic features of the more simple treatment are
confirmed.
For a catalog with an angular size cutoff, the selection criteria are the
isophotal size,
lim, and the
limiting isophote at which that angular size is measured,
µlim. The volume sampled is
| (5) |
where s and µ0 are the structural parameters that completely define an exponential profile. For a catalog with a flux limit, the selection criteria are the magnitude limit, mlim, and the limiting isophote at which the flux is measured. Since catalogs limited by total flux do not exist, we must also specify Slim / Stot, the fraction of the total flux that is measured down to the limiting isophote. Then the visibility volume is

| (6) |
where µ0* is a fiducial luminosity analogous to L*, conveniently taken to be the Freeman value. The last two equations reflect the formalism of McGaugh et al (1995); Disney & Phillipps (1983) had previously defined visibility functions in terms of luminosity and surface brightness. Since galaxies are not selected by total magnitude, and the proportion of the galaxy flux detected depends on the surface brightness, it is simpler to deal with the visibility functions defined in terms of structural parameters. As expected, the range of surface brightness for nearby galaxies is substantially larger than for more distant galaxies (Impey et al 1996). This is exactly as expected under the influence of surface brightness selection, where galaxies of intermediate surface brightness can be seen to the largest distances (see also Phillipps, Davies & Disney 1990). Regardless of whether the catalog is limited by angular size or isophotal flux, the visibility increases monotonically with larger scale length and brighter surface brightness. The volume sampling functions are very steep; the volume over which low surface brightness galaxies can be observed is small, so the correction to the space density is correspondingly large.
THE INTRINSIC SURFACE BRIGHTNESS DISTRIBUTION
The intrinsic surface brightness distribution can only be recovered if a
survey has selection parameters µlim,
mlim, and
lim
which have been rigorously applied to the catalog.
McGaugh (1996)
has applied these methods to several samples, notably the
diameter-limited Fornax catalog of
Davies (1990),
and has shown that the presumption of a preferred surface
brightness at the Freeman value is clearly invalid. The distribution
function
cuts off sharply at high surface brightness, but it has a long tail that is
populated down the faintest detectable galaxies. The lack of high surface
brightness disk galaxies is real and not a selection effect. Below
µ0  21.5 mag arcsec-2 , the numbers fall to about one fourth to
one fifth of the peak at
µ0
23.5 mag arcsec-2 , but there is no sign of a sharp
turndown. No cutoff in the surface brightness distribution has been
found down to the limit of deep CCD surveys,
µ0 ~ 26 mag arcsec-2
(Schwartzenberg et al
1995a,
Dalcanton 1995).
21.5 mag arcsec-2 , the numbers fall to about one fourth to
one fifth of the peak at
µ0
23.5 mag arcsec-2 , but there is no sign of a sharp
turndown. No cutoff in the surface brightness distribution has been
found down to the limit of deep CCD surveys,
µ0 ~ 26 mag arcsec-2
(Schwartzenberg et al
1995a,
Dalcanton 1995).
The studies just referred to do not have redshifts, so they must make the
implicit assumption of a separable bivariate luminosity function,
 (s, µ),
ie. that scale length and central surface brightness are not correlated. The
surveys of
de Jong (1995)
and Impey et al (1996)
do not have to make this
assumption since redshifts allow absolute scale lengths to be calculated.
For the APM sample, the detection probability as a function of
µ0 and s
was estimated, and the observed distribution
n(µ0) was corrected for this
incompleteness. For the raw data,
< V / Vmax > = 0.18 ± 0.06. After
weighting by the inverse probability of detection,
< V / Vmax > = 0.44 ± 0.06, which
is consistent with completeness brighter than µ0
= 25 B mag arcsec-2 , above which the corrections
become very large and uncertain. The result is
a distribution with a broad peak at
21.5 mag
arcsec-2 , which falls by a factor of 4-5 by
µ0
23.5 mag arcsec-2 , but then continues with with no sign of a
cutoff
(Sprayberry et al 1996).
The result is inconsistent with the traditional
description of a Gaussian distribution of surface brightness. The number
of disk galaxies falls slowly as a function of
µ0, but with no limit apart from that
imposed by observational selection.
(s, µ),
ie. that scale length and central surface brightness are not correlated. The
surveys of
de Jong (1995)
and Impey et al (1996)
do not have to make this
assumption since redshifts allow absolute scale lengths to be calculated.
For the APM sample, the detection probability as a function of
µ0 and s
was estimated, and the observed distribution
n(µ0) was corrected for this
incompleteness. For the raw data,
< V / Vmax > = 0.18 ± 0.06. After
weighting by the inverse probability of detection,
< V / Vmax > = 0.44 ± 0.06, which
is consistent with completeness brighter than µ0
= 25 B mag arcsec-2 , above which the corrections
become very large and uncertain. The result is
a distribution with a broad peak at
21.5 mag
arcsec-2 , which falls by a factor of 4-5 by
µ0
23.5 mag arcsec-2 , but then continues with with no sign of a
cutoff
(Sprayberry et al 1996).
The result is inconsistent with the traditional
description of a Gaussian distribution of surface brightness. The number
of disk galaxies falls slowly as a function of
µ0, but with no limit apart from that
imposed by observational selection.
2.2. The Local Galaxy Luminosity Function
The luminosity function of galaxies is fundamental to observational cosmology. As emphasized by Binggeli, Sandage & Tammann (1988), there is no universal luminosity function; the space density of galaxies is a function of Hubble type and the density of the environment. Accurate knowledge of the luminosity function is required to test cosmological world models and to understand galaxy evolution. Presumably, the shape of the luminosity function also contains "frozen in" clues to the process of galaxy formation. For example, if Freeman's law for spiral disks is correct there is only one parameter relevant to galaxy selection, as only variations in size act to modulate variations in luminosity. This would require all the physical processes of galaxy formation and evolution to conspire to result in one specific value of central surface brightness for all galaxies.
THE GALAXY LUMINOSITY FUNCTION The parametrization of the number of galaxies per unit volume according to Schechter (1976) is
| (7) |
where  * characterizes the space
density of galaxies, L*
is the luminosity above which galaxies are rare, and
* characterizes the space
density of galaxies, L*
is the luminosity above which galaxies are rare, and
 is the asymptotic
slope of the faint end of the luminosity function.
is the asymptotic
slope of the faint end of the luminosity function.
Field luminosity functions in the local universe were first reviewed by
Felten (1977), and
Binggeli, Sandage &
Tammann (1988).
More recently, large photographic surveys have
been used to define the local luminosity function with better statistics.
Efstathiou, Ellis &
Peterson (1988)
found * = 0.016, M* =
-19.7, and = - 1.07.
Loveday et al (1992)
found * = 0.014, M* = -19.5,
and = - 0.97 for the
Stromlo-APM survey.
Marzke, Huchra & Geller
(1994a)
found * = 0.010, M* =
-18.8, and = - 1.07 for the
Center for Astrophysics survey, and
da Costa et al (1994)
found * =
0.015, M* = -19.5, and
= - 1.20 for its southern
equivalent,
the Southern Sky Redshift Survey. The first extensive field galaxy
survey to be selected from CCD images is the Las Campanas Redshift Survey;
Lin et al (1996)
present the parameters * =
0.019, M* = -20.3, and
= - 0.70. For the
photographic surveys, M* is measured in absolute B
magnitudes; the Las Campanas survey used Gunn-r band
selection. All surveys
quote L* in the equivalent in solar units, and the normalization
*
in units of h3100 Mpc-3
mag-1. Note that these recent determinations
differ by more than a factor of two in both normalization,
*, and
characteristic luminosity, M*. See also the discussion by Ellis
in this volume.
THE FAINT END SLOPE IN CLUSTERS AND THE FIELD The faint end slope of the galaxy luminosity function is most easily studied in nearby clusters, where cluster membership can be decided with reasonable reliability in the absence of redshifts, using morphology and two dimensional spatial distribution as a guide.
Sandage, Binggeli &
Tammann (1985)
revealed the existence of large numbers of
faint galaxies in the Virgo cluster.
Ferguson & Sandage
(1988)
followed that work up with a similar survey of the Fornax cluster,
deriving a faint end slope of
- 1.3 for both
clusters. Correcting for surface brightness selection effects,
Impey, Bothun & Malin
(1988)
deduced
- 1.6 for the Virgo cluster,
and
Bothun, Impey & Malin
(1991)
found
- 1.5 for the
Fornax cluster.
Tyson & Scalo (1988)
postulated a large population of gas-rich dwarfs that could
substantially steepen the luminosity function. In both clusters, the
population that steepens the luminosity function has low luminosity
(MB > - 16),
moderate scale length (3-10 kpc), and low surface brightness
(µe > 25 B mag
arcsec-2). These studies were all based on photographic
material. CCD surveys have advanced our census of intrinsically faint
galaxy populations. The dwarf luminosity function in Abell 963 has an
overall slope of
- 1.8
(Driver et al 1994a),
Bernstein et al (1995)
observed a faint end slope of
- 1.4 in the core of the
Coma cluster, and
Trentham (1997)
found slopes of
-1.8 < < - 1.6 for
three spiral-rich, poor clusters. The latter two results
reach down to the luminosity of the Local Group dwarf spheroidals. With
smaller samples and a less secure background correction,
de Propris et al (1995)
find even steeper slopes for four rich Abell clusters,
- 2.2.
A magnitude limited redshift survey must sample several thousand galaxies to include a few dozen fainter than M* + 5. Our knowledge of the field galaxy luminosity function fainter than MB = - 16 is poor for two reasons. Shallow, wide-field surveys have small effective volumes for the detection of low luminosity systems. Also, regardless of the exact relationship between luminosity and surface brightness, magnitude limited redshift surveys must be increasingly censored by surface brightness selection effects at MB > - 16.
Driver & Phillipps
(1996)
find the Stromlo-APM survey to be entirely consistent with a faint end
slope of = - 1.5. A
reanalysis of the CfA redshift survey by
Marzke et al 1994b)
suggests that the faint end slope is as high as -1.85
for low luminosity spirals and irregulars.
Marzke & da Costa
(1997)
deduce a Schechter function with
= - 1.5 for the blue
galaxies (B - R < 1.3) in
the Southern-Sky Redshift Survey, and the deepest part of the sample
yields a slope as steep as
= - 1.7. The ESO Slice
Survey has also been compared directly to the Stromlo-APM survey by
Zucca (1997),
who finds a higher normalization than
Loveday et al (1992),
and a faint end with
= - 1.6 due entirely to
LSB and compact star-forming galaxies. An extension of the Las Campanas
Redshift Survey to correct for excluded LSB galaxies also results in a
steeper faint end slope (JJ Dalcanton and SA Schectman, in preparation).
Bershady et al (1997)
have carried out a local (z < 0.1) UBVRI survey down to
µB = 24.5B
mag arcsec-2 over 1 deg2, and find blue field
galaxies to have a steep slope of
= - 1.6. The Texas Deep Sky
Survey is a UBVRI survey covering 50 deg2 that
will reach µB = 23.5B mag
arcsec-2 . These multicolor CCD surveys are deep enough
to detect LSB galaxies that are missing from most photographic catalogs.
The data in both clusters and the field appear to be best described by a
composite luminosity function. Giant galaxies, especially those of early
type with high surface
brightness, have either a conventional Schechter function with
= - 1 to -1.1
or a Gaussian luminosity function. Dwarf galaxies, especially those of
late type with low surface brightness, have steep Schechter slopes of
= - 1.5 to -2 which
begin to dominate at
-15 < MB < - 17. A single Schecter function is a
poor description of almost any survey that spans more than six
magnitudes in luminosity. The steep faint end slope has so far been
most clearly seen in poor, spiral-rich
clusters or in samples of blue field galaxies. We note that in the case
where = - 1.5,
Ltot
1.8* L* and the number of
galaxies per luminosity interval is
dN = *
exp(-L/L*) dL / L*.
The steep luminosity function at the faint end for gas-rich dwarfs was
first proposed by
Tyson & Scalo (1988),
and has been argued for on different grounds by
Schade & Ferguson
(1994).
RECOVERING THE TRUE GALAXY POPULATION Correct calculation of a luminosity function requires a measurement of the bivariate distribution of luminosity and surface brightness. The luminosity should be calulated from a total rather than an isophotal magnitude. Most constructions of the luminosity function implicitly assume a delta function surface brightness distribution, and no published luminosity function has made corrections for surface brightness selection effects. Figure 2 shows how significant the addition of diffuse galaxies can be. The RC3 galaxies form a broad distribution around a characteristic value of µe = 22 mag arcsec-2 in B; optical and/or 21 cm redshifts have been measured for all the LSB galaxies plotted in Figure 2. With a fainter limiting isophote, the APM survey recovered previously uncataloged galaxies down to µe = 26 mag arcsec-2 . The correlation between total luminosity and surface brightness has a very large scatter. Over the range 23 < µe < 25, galaxies are being discovered over the entire range -14 > MB > - 21. The far left solid curve of Figure 2 represents the selection function at 50% completeness.

|
Figure 2. Effective surface brightness
plotted against blue luminosity
for RC3 galaxies (small dots) and LSB galaxies from the APM survey
(large dots). The correlation between luminosity and surface brightness
for the LSB galaxies is weak. (From
de Vaucouleurs et al 1991,
and Impey et al 1996.)
The three solid curves show the APM selection function, assuming
µlim = 26 B mag arcsec-2 and
|
The derivation of a luminosity function is complicated by the correlation between surface brightness and luminosity. Rather than calculate n(L, µ), it is possible to calculate n(I0, s), since I0 and s uniquely define luminosity and they are observed to be uncorrelated for low surface brightness galaxies fit by exponentials. In this case
| (8) |
where the distributions of structural parameters, after correction
for selection effects, are n(I0)
I0-p and n(s)
s-q.
Assuming that this double integral is bounded by the observed upper
limits on central surface brightness and scale length
n(L) [1 -
(L / Lmax)1 - p][1 - (L /
Lmax)(1 - 2q)/2], which reduces to
n(L)
L-1.5, if
p 1 and
q 2, as
observed. As noted by
Phillipps & Driver
(1995),
n(L) dL
 I0-1(I0 /
L)(I0L)-1/2
dI0dL, which reduces to
n(L)
L-3/2(Imax1/2 -
Imin1/2), and so the fraction of galaxies
above Imin is
1 - (Imin / Imax)1/2,
independent of luminosity.
I0-1(I0 /
L)(I0L)-1/2
dI0dL, which reduces to
n(L)
L-3/2(Imax1/2 -
Imin1/2), and so the fraction of galaxies
above Imin is
1 - (Imin / Imax)1/2,
independent of luminosity.
Sprayberry et al (1997)
have compared the APM survey of LSB galaxies directly to
the CfA redshift survey. By measuring the surface brightness properties
of the CfA galaxies, a volume limited sample of LSB galaxies with
redshifts can be defined that has no overlap with the CfA survey (ie.
µ0 > 22 mag arcsec-2). The
predominantly late-type low surface brightness galaxies in the range
22 < µ0 < 25 B mag
arcsec-2 are at least
as numerous as the late-type CfA galaxies presented by
Marzke et al (1994b).
The amount of extra luminosity density is 25-30%. Because the number
distribution is
nearly flat down to the lowest surface brightness reached by the APM
survey, these are lower bounds to the missing LSB population. Using the
maximum liklihood estimator of
Sandage, Tammann, &
Yahil (1979),
a Schechter function for the giants, and a
power law function for the dwarfs, the luminous galaxies are fit by a
standard slope of
= - 0.9, and the dwarfs
have a steeper (but more uncertain) slope of
= - 2.2. It is not known
how this analyis would be affected by the addition
of galaxies at even fainter suface brightness levels of
µ ~ 27 mag arcsec-2 , such as
have been discovered in CCD surveys
(Dalcanton 1995).
To summarize, the local galaxy luminosity function cannot be derived without
correcting for surface brightness selection effects. These effects are
more severe for late type and gas-rich galaxies than for early type and
gas-poor galaxies, because
the latter have generally higher surface brightness and a tighter
correlation between luminosity and surface brightness
(Binggeli, Sandage, &
Tarenghi 1984).
Isophotal magnitudes generally measure a smaller fraction of the total
galaxy flux as the
surface brightness decreases. Procedures that assume that each
luminosity interval has a similar distribution of surface brightness, or
that Slim / Stot
is not a function of surface brightness, may be in error. For galaxy
types where the
correlation between luminosity and surface brightness has large scatter,
the corrections are substantial. The volume corrections are largest for
the faintest galaxies, where
the numbers in local surveys are fewest, and where the incompleteness
corrections are largest. When these corrections are made to shallow
wide-angle surveys, or when
considering deep pencil-beam surveys which tend to have fainter
isophotal limits, the
slope of the tail of the luminosity function is at least as steep as
= - 1.4.
By far the most ubiquitous type of galaxy in the universe is the low
surface brightness dwarf. These galaxies are almost completely missing
from published local luminosity functions.