Reprinted with kind permission from , 4139 El
Camino Way, Palo Alto, California, USA
MASSIVE STAR POPULATIONS IN NEARBY GALAXIES
André Maeder
Geneva Observatory, CH-1290 Sauverny, Switzerland
Peter S. Conti
Joint Institute for Laboratory Astrophysics, University of Colorado,
Boulder, Colorado 80309-0440
Key Words: Wolf-Rayet stars, starbursts, supergiants, initial
mass function, CNO abundances
Table of Contents
 INTRODUCTION
- DISTRIBUTION OF INDIVIDUAL OB STARS
- Overview
- Direct Star Counts/Census
- STELLAR MODELS AND OBSERVATIONS
- Recent Progress in the Input Physics
- Metallicity Effects in Massive Stars
- Main Sequence Evolution
- The Eddington Limit and LBV Stars
- Blue and Red Supergiants
- W-R STARS: OBSERVATIONS AND PREDICTIONS
- Overview
- Subtypes and Chemical Abundances
- Physical Properties
- Initial Masses, Lifetimes, Formation
- W-R Statistics
- MASSIVE STARS IN STARBURSTS
- Integrated Spectra of Galaxies
- Global Properties
- CONCLUSIONS
- REFERENCES
1. INTRODUCTION
Massive stars are among the main drivers of the evolution of galaxies.
These O type stars, along with their highly evolved descendants, the
even more energetic Wolf-Rayet objects, are major contributors to the
UV radiation and power the far-infrared luminosities through the
heating of dust. Their stellar winds are important sources of
mechanical power. As progenitors of supernovae, massive stars are
agents of nucleosynthesis and may be intimately involved in the
initiation of new star formation processes. Hence, massive star
evolution is a key study in the exploration of the nearby and distant
Universe.
The laws of physics are, so far as we know, the same throughout the
Universe. Why should we study massive stars in other galaxies, which
is certainly more difficult than studying these objects nearby? We do
so because the initial compositions of those stars, in particular
their modes of star formation and environments, may well differ from
place to place. This leads to different evolutionary histories with a
number of observable consequences. For example, it has been known for
quite some time that the number ratio of blue to red supergiants shows
a gradient in the Milky Way and seems to be different from the ratios
found in the Magellanic Clouds. Also, the relative frequency of
Wolf-Rayet (W-R) stars to their O-type progenitors appears to be much
larger in inner Galactic regions compared to some low-metallicity
galaxies. Similarly, the ratio of W-R stars of subtypes WN to those of
type WC also changes by a factor of about 20 or more between
metal-rich and metal-poor environments. Furthermore, the studies of
starburst galaxies containing recently born massive stars show the
existence of conspicuous differences in their massive star population
statistics. Finally, spectroscopic abundance determinations in AGN and
QSOs give us evidence of a very different chemical history among their
constituent gaseous and stellar content. These few striking examples
illustrate that targe differences may exist in massive star
populations among galaxies. It is thus essential to present a good
description of such differences and to have a proper understanding of
them.
Until about 20 years ago, it was generally thought that the
evolution of massive stars was fully understood. With an internal
physics governed by electron scattering opacities and a simple
equation of state, the stars were supposed to gently leave the main
sequence (MS) and finally explode as red supergiants, giving rise to
SN II. More recent years have demonstrated the major role of mass loss
and initial metallicity, hi addition to the initial mass function
(IMF), and the star formation rate (SFR) for shaping massive star
evolution and population statistics. The color-magnitude diagrams of
young clusters, the stellar abundances of He and CNO elements, and the
studies about SN 1987A and its precursor have led to numerous
additional investigations on the role of convection and mixing in
massive star evolution.
In Section 2 we present some of the
statistical properties of
massive stars that can be studied individually, and consider what
differences have been found between those in three relatively
well-known galaxies (the Milky Way and the Magellanic Clouds). We
examine the evolution models of OB stars and supergiants in
Section 3,
and compare them with the observations. We consider the properties of
W-R stars, those highly evolved descendents of the most massive stars,
in confrontation with the predictions of stellar evolution models in
Section 4. Observations and models of even
more distant galaxies containing starburst phenomena are considered in
Section 5. In these
cases, we are usually dealing only with integrated properties of stars
in galaxies. We intimate some directions for the future in
Section 6.
2. DISTRIBUTION OF INDIVIDUAL OB STARS
2.1. Overview
Massive stars are, for the most part, located in stellar associations
born in giant molecular clouds; a powerful enough birth event would be
called a "starburst." Initially these stars are surrounded by the
dense molecular gas cloud and surrounded by the commonly associated
dust. These ensembles will radiate strongly in the IR and radio
regions due to the heating of dust and gas excitation, but might be
completely hidden optically (e.g. W51 in our Galaxy). After some time,
the molecular clouds are dissociated and the dust is dissipated by the
radiation and stellar winds from the O stars within, and the region
becomes visible as an optical H II or giant H II (GH II) region
(e.g. 30 Doradus). The appearance of the spiral arms of galaxies in
the visible is primarily determined by the distributions of the H II
and GH II regions within them. For the nearer galaxies, the individual
stars may be investigated, but for more distant ones, only the
integrated properties of the association as it affects the excited gas
(and dust) can be studied.
Actual counts of massive stars in associations can be used directly
to give estimates of the slope of the IMF, along with the related
upper and lower mass limits Mupper and
Mlower. We consider these
parameters for a group of associations in our Galaxy and the
Magellanic Clouds in Section 2.2. Tn more distant GH
II regions and
starburst galaxies (Section 5), we turn to
indirect methods used to
confront the questions of "How many?" and "What kinds of massive stars
are present?". In such distant galaxies, we make use of the integrated
spectra and of global properties, such as their far-infrared (FIR)
luminosities, and their optical and UV imaging. For indirect methods,
we examine the use of 30 Doradus as a fundamental calibrator.
2.2 Direct Star Counts/Census
Pioneering efforts to elucidate the numbers and types of massive stars
in various environments have been made primarily by Massey and
associates, using both photometry and spectroscopy. As
Massey (1985)
has shown, even the unreddened U BV colors for the hottest stars are
degenerate, i.e. one cannot distinguish between the hottest and
coolest O type stars on the basis of their photometry alone, as is
commonly done with luminosity functions, Massey and his associates'
homogeneous approach to the determination of the IMF for various
associations of the Galaxy and Magellanic Clouds assures us that their
comparisons among various stellar groupings ought to be consistent
with each other.
2.2.1 PROCEDURE
One first acquires deep CCD U BV frames of the relevant stellar
associations. Accurate photometry (to 0.02 mag) must be accomplished,
and color-color plots used to estimate the extinction and identify the
bluest stars. The U BV colors are used to determine the brightness of
the stars but spectra suitable for classification are needed to
determine the effective temperature, Teff, of all
stars earlier in type
than BlV or so. Obtaining spectra is a time-consuming effort requiring
large telescopes; the photometry can be done on modest ones.
Distances of the associations by classic spectroscopic parallax
methods are obtained for the Galactic clusters; for the Magellanic
Clouds, the standard distances are used. MV and
spectral type (or
unreddened color) are converted to Mbol and
Teff using a calibration
procedure. These "observed" parameters for the association stars are
plotted on a "theoretical" HR diagram with evolutionary
tracks. Finally, one counts the numbers of stars in each mass interval
along the track, and plots the values as a function of mass. The slope
of this relationship is referred to as
 , defined in the equation

| (1)
|
where f(M) is the fractional number of stars per unit mass interval M,
A is a scaling constant, and the Salpeter value for
is -1.35. By the
above procedure, one is essentially measuring the slope of the Present
Day Mass Function (PDMF). An important assumption is that this number
is identical to the slope of the IMF; in other words, stellar deaths
can be ignored. This is reasonable for the very youngest O
associations, and one can, if necessary, account for the already
highly evolved W-R stars that are present in some of the regions
studied. A further typical assumption is that the spread in formation
time is of the order of, or less than, the evolution time, which seems
reasonable for O associations (but see
Section 2.2.2). Finally, one
ignores the binary membership. Unless the binary fraction, typically
considered to be 40% for hot stars
(Garmany et al 1980),
is different
from place to place, this assumption is also not unreasonable in the
context of seeking similarities and differences in the numbers and
types of massive stars in various environments.
2.2.2 MASSIVE STAR CENSUS IN O-ASSOCATIONS
In Table 1 (adapted from
Conti 1994),
we summarize the statistics for
ten associations in the Galaxy and Magellanic Clouds, along with those
for the solar vicinity. They have been grouped by galaxy abundance,
thus sampling the composition of the environment out of which these
stars formed.
Table 1. Massive star statistics for various
regions
|
| Association | -
| # > 60 M
| Galaxy | References
|
|
| Field < R
| 1.3 | | Milky Way | Garmany et al 1982
|
| Field > R
| 2.1 | | | Garmany et al 1982
|
| Cyg OB2 | 1.0 | 7 | | Massey & Thompson 1991
|
| Car OB1 | 1.3 | 7 | | Massey & Johnson 1993
|
| Ser OB1 | 1.1 | 1 | | Hillenbrand et al 1993
|
| LH9 | 1.6 | 0 | LMC | Parker et al 1992
|
| LH10 | 1.1 | 4 | | Parker et al 1992
|
| LH58 | 1.7 | 0 | | Garmany et al 1993
|
| LH117 | 1.8 | 2 | | Massey et al 1989a
|
| LH118 | 1.8 | 0 | | Massey et al 1989a
|
| 30 Dor | 1.4 | 21 | | Parker 1991
|
| NGC 346 | 1.8 | 3 | SMC | Massey et al 1989b
|
|
The two entries for the solar vicinity were obtained by a method
similar to the others but the models used were older and the numbers
not quite comparable; the values are just noted for completeness. The
authors of the various papers cited suggest that
has been determined
to an accuracy of ± 0.2 in each association. If there is a dependence
on metal abundance, Z, which, given the uncertainties, is by no means
clear, then gets
shallower as the metal abundance increases. This is
in opposition to the prevailing view
(Shields & Tinsley 1976)
that
becomes steeper with increasing abundance.
The entries in Table 1 also give a quantitative
indication of Mupper
for the most massive objects by listing the actual numbers of stars
with masses larger than 60
M as
inferred from the Mbol and Teff. We
obtained this by inspection of the HR diagrams plotted in the various
papers cited. The values, which are more or less proportional to the
total numbers of stars in each region, range farther upward in mass to
somewhere between 80 to 100
M this is a
reasonable estimate of Mupper
for starburst modeling purposes (see also
Section 3.4). There is no
dependence of either the numbers of massive stars or the
Mupper on the
galaxy environment, or on metallicity Z.
It has been suggested from indirect arguments that the
Mlower, limit
in some starburst regions might be significantly larger than the
canonical 0.1 M
found near the Sun, and more like a few
M (e.g. M
82 -
Rieke 1991,
McLeod et al 1993).
Is there any direct evidence for
this? Among well-studied energetic GH II regions, 30 Dor would be the
place to look. However,
Parker's (1991)
survey was complete only to
an apparent magnitude corresponding to a few
M, i.e. just
where it
begins to get interesting. Despite the (crowding) difficulties, a
deeper CCD photometric survey of 30 for needs to be made to
investigate its Mlower limit and this issue in general.
In their study of NGC 6611 = Ser OB1,
Hillenbrand et al (1993)
have
gone sufficiently deep in their CCD survey to be able to say something
about the stellar population at 3-7
M.
Remarkably, they find that
these stars are above the main sequence, in the pre-main sequence
phase. Furthermore, the ages of these still contracting stars are a
few × 105 years, appreciably less than the turn-off time
of the upper
main sequence, which is a few × 106 years! Thus in this
association,
the presence of (at least) 13 O stars has not inhibited further star
formation of lower mass stars. Whether ten or one hundred times that
many O stars would inhibit subsequent lower mass star formation
remains problematic.
Hillenbrand et al (1993)
also call attention to several luminous
stars that sit well to the right of the main body of massive stars in
NGC 6611. They argue that these stars are indeed cluster members,
which must have formed before most of the rest. Eye examination of the
rest of the associations referenced above also invariably reveals a
few stars in similar, advanced, evolutionary stages. Hillenbrand et al
suggest star formation might proceed much like "popcorn" when it is
heated; a few kernels "pop" before the main body, and a few more lag
behind.
2.2.3 LUMINOSITY FUNCTIONS
Massey (1985)
noted that using only photometry, it is difficult to
distinguish among the most massive stars employing luminosity
functions alone. In particular.
Massey et al (1989b)
show that had
they taken only their U BV photometry for the analysis of NGC 346,
they would have found to be
-2.5, instead of the -1.8 value listed
in Table 1.
Hill et al (1994)
have derived
for 14 OB associations in
the Magellanic Clouds using CCD photometry. They too find no
difference in this parameter between the LMC and SMC, thus no
dependence on Z. While their mean values of
are somewhat larger than
those listed in Table 1 (and probably for the
reason mentioned above),
this distinction is probably not significant. Their uncertainties in
are also larger than those found by Massey and associates with their
techniques.
Massey et al (1986) have done CCD photometry of several associations
in M31. Using plots and evolution tracks similar to those discussed
above, they obtained the curious result (shown in their Figures 31 and
32) that there are no stars in the luminous associations OB78 and OB48
more massive than 40
M, although
both have W-R stars present. This
inference is probably faulty as it is based on photometry only. Thus
the use of luminosity functions for massive stars must be treated with
caution, as both the derived
and the
Mupper might be suspect. For
luminous stars of M31 and other Local Group galaxies, spectra are
difficult but not impossible to obtain on the largest telescopes,
especially - with multiple slit instrumentation.
3. STELLAR MODELS AND OBSERVATIONS
3.1 Recent Progress in the Input Physics
Only in the Milky Way and a few galaxies of the Local Group are
individual observations of massive stars feasible. Before interpreting
the integrated spectra of more distant galaxies, we must first proceed
to careful tests of the current models by observing stars in nearby
galaxies and checking whether these models are realistic.
Over recent years many grids of stellar models of massive stars at
different metallicities Z have been produced with various physical
assumptions
(Brunish & Truran 1982 a,b;
Chin & Stothers 1990;
Maeder 1990;
Arnett 1991;
Baraffe & El Eid 1991;
Schaller et al 1992;
Schaerer et al 1993 a,b;
Charbonnel et al 1993:
Woosley et al 1993;
Alongi et al 1993;
Bressan et al 1993;
de Loore & Vanbeveren 1994;
Meynet et at 1994).
The general input physics for stellar models has
been extensively discussed
(Iben 1974,
Iben & Renzini 1983,
Chiosi & Maeder 1986.
Maeder & Meynet 1989,
Chiosi et al 1992a,
Schaller et al 1992).
We shall limit our review to those points most critical for
massive stars. Evaporation by stellar winds is a dominant feature of
massive star evolution and all model predictions are
influenced. Stellar wind models have been developed by several groups
(Abbott 1982,
Pauldrach et al 1986,
Owocki et al 1988,
Kudritzki et al 1987,
Schaerer & Schmutz 1994).
However, the observed mass loss rates,
M, and the wind momentum in O-type stars are generally still larger
than predicted
(Lamers & Leitherer 1993).
Thus, taking theoretical  is probably not yet a comfortable choice and it seems preferable to
base the models on the empirical values. Those compiled by de
Jager et al (1988)
have commonly been adopted. These mainly depend on
luminosity and to a smaller extent on Teff; the role
of rotation is still uncertain
(Nieuwenhuijzen & de Jager 1988,
1990;
Howarth & Prinja 1989).
These average might be too low
(Schaerer & Maeder 1992).
Considerable uncertainties remain in the adopted
,
particularly for the red supergiants which lose mass at very high
values
(de Jager et al 1988,
Stencel et al 1989,
Jura & Kleinmann 1990).
Presently there is no complete theory for the winds of red
supergiants. For these, evidence of dust ejection is provided by IRAS
observations, which show that some of them possess extended
circumstellar shells
(Stencel et al 1989)
potentially leading to OH/IR sources
(Cohen 1992).
Evidence for strong winds in the previous red
supergiant phase of SN 1987A has also been presented by
Fransson et al (1989),
and for the more recent SN 1993J by
Hoflich et al (1993).
is probably not yet a comfortable choice and it seems preferable to
base the models on the empirical values. Those compiled by de
Jager et al (1988)
have commonly been adopted. These mainly depend on
luminosity and to a smaller extent on Teff; the role
of rotation is still uncertain
(Nieuwenhuijzen & de Jager 1988,
1990;
Howarth & Prinja 1989).
These average might be too low
(Schaerer & Maeder 1992).
Considerable uncertainties remain in the adopted
,
particularly for the red supergiants which lose mass at very high
values
(de Jager et al 1988,
Stencel et al 1989,
Jura & Kleinmann 1990).
Presently there is no complete theory for the winds of red
supergiants. For these, evidence of dust ejection is provided by IRAS
observations, which show that some of them possess extended
circumstellar shells
(Stencel et al 1989)
potentially leading to OH/IR sources
(Cohen 1992).
Evidence for strong winds in the previous red
supergiant phase of SN 1987A has also been presented by
Fransson et al (1989),
and for the more recent SN 1993J by
Hoflich et al (1993).
Different treatments of convection and mixing in stellar interiors
have been advocated, giving a major uncertainty in massive star
models. We identify the following different assumptions regarding
convection and mixing in massive star models:
- Schwarzschild's criterion,
- Schwarzschild's criterion and core overshooting,
- Overshooting below the convective envelope,
- Ledoux criterion,
- Semiconvection or semiconvective diffusion,
- Turbulent diffusion or other forms of rotational mixing.
All of these models are claimed by their authors to fit the
observations and the debate has been lively in recent years
(Chiosi & Maeder 1986;
Maeder & Meynet 1989;
Brocato et al 1989;
Lattanzio et al 1991;
Stothers 1991 a,b;
Stothers & Chin 1990,
1991,
1992 a,b).
There
is at present no definite theoretical or observational proof in favor
of any model. However, a few useful indications on the limits and
possibilities of the various models must be mentioned.
Although claims have been made in favor of substantial overshooting
from convective cores with respect to what is predicted by
Schwarzschild's criterion, it now seems clear that the overshooting
distance is limited to about (0.2-0.4 ) Hp
(Maeder & Meynet 1989,
Stothers & Chin 1991,
Napiwotzki et al 1993,
Meynet et al 1993).
The main effect is to increase the main sequence width and lifetimes,
while the helium burning lifetimes are reduced (due to higher L); the
blue loops are also shorter. In contrast to overshooting, which
extends convective zones, the Ledoux criterion tends to prevent
convective mixing in zones with variable mean molecular weights
(Kippenhahn & Weigert 1990).
Some recent comparisons with observations
seem to favor Ledoux's rather than Schwarzschild's criterion for
convection
(Stothers & Chin 1992 a,b);
however, the result may depend
on the adopted . Other recent
theoretical work
(Grossman et al 1993)
shows that the Ledoux criterion has no bearing at all in stratified
stellar layers. Thus, both at the theoretical and observational
levels, the convective criteria remain uncertain.
Semiconvection occurs in zones that are convectively unstable
according to Schwarzschild's criterion, but not according to Ledoux's.
Semiconvection may thus produce some mixing in zones with a gradient
of the mean molecular weight. Various treatments of the problem have
been made
(Chiosi & Maeder 1986,
Langer at al 1989,
Arnett 1991,
Chiosi et al 1992a,
Langer 1992,
Alongi et al 1993).
In a semiconvective zone, the nonadiabatic effects (radiative losses)
produce a progressive increase of the amplitudes of oscillations at
the Brunt-Vaisala frequency around a stability level
(Kippenhahn & Weigert 1990).
The growth of amplitudes is generally rapid compared to
the evolutionary timescale, so that a situation equivalent to
Schwarzschild's criterion is established. However, this might not be
true in massive stars, as shown by
Langer et al (1985),
who discussed
the timescales involved in semiconvective mixing. They propose a
diffusion treatment that is equivalent to Schwarzschild's criterion
when the mixing timescale is short compared to the evolutionary
timescale, and to the Ledoux criterion in the opposite case. Models
with such diffusion are of special relevance to the discussion about
the blue progenitor of SN 1987A
(Langer et al 1989;
Langer 1991 a,c)
as well as about the evolutionary status of blue supergiants (cf
Section 3.5).
The effects of rotationally induced mixing may be important for
massive stars. The radiative viscosity is so large that dissipative
processes may have a timescale comparable to the evolutionary
timescalcs of massive stars
(Maeder 1987b).
Mixing could produce
chemically homogeneous or nearly homogeneous evolution on the main
sequence and thus lead directly as a result of nuclear burning to the
formation of He stars, which would be observed as W-R stars. Models of
massive stars losing mass and angular momentum have been calculated by
Sreenivasan & Wilson (1985).
As Langer (1992b)
emphasized, models with
semiconvective and rotational mixing may solve several problems: the
existence of the WN+WC stars
(Langer 1991b;
cf Section 4.2), the
origin of nitrogen enhancement in OB supergiants, the alleged mass
discrepancy for OB main sequence stars (cf
Section 3.3), and the
nature of the blue progenitor of SN 1987A. Curiously enough, the
claims in favor of semiconvection mean less mixing in the convective
zone with varying mean molecular weight, while the claims in favor of
rotational mixing mean more mixing from inner material into the outer
radiative zone
(Langer 1993).
The situation is still uncertain, but we
think it likely that mass and metallicity are not sufficient to
describe massive star evolution and that rotational velocity will be
an unavoidable additional parameter, as well as (for some) membership
in close binary systems.
3.2 Metallicity Effects in Massive Stars
Metallicity, like other effects such as nonconstant star formation
rates and peculiar initial mass functions
(Section 5), is a key factor
influencing massive star populations in galaxies. Metallicity effects
can enter evolution through at least four possible doors:
- Nuclear production. Metallicity Z may influence the nuclear rates;
a good example occurs for the CNO cycle. A very slight contraction or
expansion to a new equilibrium state may compensate for a change in
nuclear rates
(Schwarzschild 1958).
In massive stars, a lower Z also
produces a more active H-burning shell in the post-main sequence
evolution and this favors a blue location in a part or the whole of
the He-burning phase
(Brunish & Truran 1982 a,b;
Schaller et al 1992).
This was one of the initial explanations proposed for the blue
precursor of SN 1987A
(Truran & Weiss 1987).
- Opacity effects. In the interiors of massive stars, electron
scattering, which is independent of Z, is the main opacity
source. Thus, in contrast to the case of low and intermediate mass
stars, metallicity has no great direct effect on the inner structure
of massive stars.
- Stellar winds. In the very external layers, Z may strongly
influence the opacity and thus the atmospheres and winds. Wind models
for O stars by
Abbott (1982)
suggested a Z-dependence of the mass loss
rates of the form
 Z
Z , with
= 1.0. Other models gave a
value of between 0.5 and 0.7
(Kudritzki et al 1987,
1991;
Leitherer & Langer 1991;
Kudritzki 1994).
It is likely that this is the main effect by
which Z may influence massive star evolution
(Maeder 1991a).
For yellow and red supergiants, there are no models
(Lafon & Berruyer 1991)
nor observatidas
(Jura & Kleinmann 1990)
giving reliable vs Z
information; thus a major uncertainty in post-MS evolution remains.
, with
= 1.0. Other models gave a
value of between 0.5 and 0.7
(Kudritzki et al 1987,
1991;
Leitherer & Langer 1991;
Kudritzki 1994).
It is likely that this is the main effect by
which Z may influence massive star evolution
(Maeder 1991a).
For yellow and red supergiants, there are no models
(Lafon & Berruyer 1991)
nor observatidas
(Jura & Kleinmann 1990)
giving reliable vs Z
information; thus a major uncertainty in post-MS evolution remains.
- Helium content. A ratio
 Y /
Z greater than 3
between the relative
enrichments in helium and heavy elements has been established from
low-Z H II regions
(Peimbert 1986,
Pagel et al 1992).
Thus, changes in Z imply large changes in Y, which have a
direct effect on the models.
Y /
Z greater than 3
between the relative
enrichments in helium and heavy elements has been established from
low-Z H II regions
(Peimbert 1986,
Pagel et al 1992).
Thus, changes in Z imply large changes in Y, which have a
direct effect on the models.
3.3 Main Sequence Evolution
3.3.1 HR DIAGRAM, LIFETIMES, MASSES
Let us examine a few of the main
properties of the models of massive stars at various metallicities. At
low metallicity Z, the zero-age main sequence (ZAMS) is shifted to the
blue due to the lower opacity in the external layers. Between the
sequences at Z 0.001 and 0.04. the shift in log
Teff amounts to +0.06
dex at 20 M
(Schaller et al 1992,
Schaerer et al 1993b)
and a
lowering in luminosity by 0.10 dex. The reason is that at low Z the
hydrogen content is higher, thus the electron scattering opacity is
larger. The width of the MS band is predicted to change considerably
according to metallicity. The main feature is a prominent "paunch,"
which is displaced to lower luminosities for lower mass loss rates and
metallicities. Two physical effects are responsible for this paunch
(Maeder 1980).
First, the large mass fraction of the He core,
resulting from the removal of the outer layers, favors the redward
extension of the tracks, Second, when the surface hydrogen content
becomes lower than Xs = 0.3 or 0.4 as a result of mass loss
(Chiosi & Maeder 1986),
the lowering of the surface opacity moves the star back
to the blue. Thus, the paunch appears in the range of masses where
mass loss is sufficient to increase the core mass fraction, but not
high enough to lower Xs below the critical limit. An
increase of
overshooting or opacity may enhance the paunch. Models with enhanced
opacities may have a MS band covering all the HR diagram
(Stothers & Chin 1977,
Nasi & Forieri 1990).
The lifetimes in the various nuclear phases change with Z. For the
H-burning phase, the lifetimes t(H) are typically longer by 35% for a
20 M
model at Z = 0.001 compared to Z = 0.040. The reason rests on
the lower luminosity and the larger reservoir of hydrogen. The
lifetimes t(He) in the He-burning phase are generally longer in models
with higher Z, due to the higher mass loss rates which lead to a
drastic decrease of the luminosities in this phase. For models of 15
to 120 M,
the t(He) / t(H) is typically 9 to 10%; these ratios are
between 11 and 19% at Z = 0.04 and they may amount to 50% if the mass
loss rates are increased by a factor of 2
(Meynet et al 1994).
These large factors show how our ignorance of the exact mass loss rates at
various Z may affect massive star models.
There is an apparent lack of O stars close to the theoretical
zero-age sequence
(Garmany et al 1982).
This is also quite clear in
recent gravity and Teff determinations by
Herrero et al (1992).
We notice that for massive stars, the accretion timescale of the
protostellar cloud is longer than the Kelvin-Helmholtz timescale
(Yorke 1986).
The consequence is that no massive pre-MS star should be
visible
(Palla et al 1993)
- a fact that could contribute to obscured stars close to the ZAMS,
Wood & Churchwell (1989)
and Chiosi et al (1992a)
suggest that 10% to 20% of the O stars are still embedded in
their parent molecular clouds. An alternative explanation is that
there is no true ZAMS corresponding to a chemically homogeneous stage
for O stars, because nuclear reactions ignite early during the
contraction phase
(Appenzeller 1980)
and may thus make stars
inhomogeneous before the end of the contraction phase.
Another potential problem is the so-called mass discrepancy for O
stars. Spectroscopic masses derived from gravity and terminal velocity
determinations were claimed to be smaller than predicted by stellar
models
(Bohannan et al 1990,
Groenewegen et al 1989,
Herrero et al 1992,
Kudritzki et al 1992).
In other words, spectroscopy suggests
that O stars are overluminous for their masses and the discrepancy
amounts up to about 50%.
Langer (1992)
interprets the overluminosity
of O stars as a sign of rotational or tidal mixing enlarging the
helium core. Apart from the fact that the force multiplier may not be
correctly predicted by non-LTE wind models, the reality of the mass
discrepancy has been questioned recently by
Lamers & Leitherer (1993).
They show that large discrepancies exist between theoretical
and observed mass loss rates, as is true for the terminal velocities;
they also argue that the discrepancies cannot be solved by adopting
smaller masses for O stars. According to
Schaerer & Schmutz (1994),
the use of plane-parallel models for O stars may lead to significant
errors for spectroscopic gravities, masses, and helium abundances. It
is thus possible that the mass discrepancy is due to the inadequate
modeling of stellar atmospheres. This view seems confirmed by the
most recent work of
Pauldrach et al (1994)
and Kudritzki (1994),
who
do not find the mass discrepancy once additional wind opacity due to
iron transitions is taken into account.
3.3.2 ABUNDANCES ON THE MS
The surface abundances in He and CNO elements offer a powerful test of
stellar evolution. Evidence of CN processing is provided by He and N
enhancements together with C depletion, while O depletion only occurs
for advanced stages of processing. The abundances may cover a range
from solar values (C/N = 4, O/N 10) to CNO equilibrium values in the
extreme case which is reached in WN stars (C/N = 0.02, O/N = 0.1;
Maeder 1983, 1987a).
Models with mass loss but no extra-mixing predict
He and N enrichment in MS stars only for initial masses larger than
about 50 M
depending on the mass loss rates. Models with rotational
mixing may lead to a precocious appearance of the products of the CNO
cycle (cf
Maeder 19875,
Langer 1992).
The observations of 25 OB stars by
Herrero et al (1992)
show that most MS stars have normal He and N
abundances. The same is true for MS B-type stars
(Gies & Lambert 1992).
For example, even the most massive object,
Melnick 42
(O3f), appears to show normal abundance ratios
(Pauldrach et al 1994;
but see
Heap et al 1991).
However, there are also exceptions for O and B stars. For example, the O4f star
 Pup presents
evidence of an atmosphere with CNO burned material
(Bohannan et al 1986,
Pauldrach et al 1994).
Fast rotators are also an exception and they generally show
He and N enhancements
(Herrero et al 1992).
Another ease is the group
of ON stars, i.e. O stars with N-enrichments
(Walborn 1976, 1988;
Howarth & Prinja 1989);
this group contains at least 50% short-period binaries
(Bolton & Rogers 1978).
Pup presents
evidence of an atmosphere with CNO burned material
(Bohannan et al 1986,
Pauldrach et al 1994).
Fast rotators are also an exception and they generally show
He and N enhancements
(Herrero et al 1992).
Another ease is the group
of ON stars, i.e. O stars with N-enrichments
(Walborn 1976, 1988;
Howarth & Prinja 1989);
this group contains at least 50% short-period binaries
(Bolton & Rogers 1978).
An analysis of the association Per OB1
(Maeder 1987b)
suggests that
there is a bifurcation in stellar evolution: While most stars follow
the tracks of inhomogeneous evolution, a fraction of about 15%, mainly
composed of fast rotators and binaries, may evolve homogeneously and
become ON blue stragglers.
3.4 The Eddington Limit and LBV Stars
The value of the mass of the most massive stars in galaxies has been a
much debated subject. Recent photometric and spectroscopic studies
suggest stellar masses up to about 100
M
(Section 2.2.2;
Table 1;
Divan & Burnichon-Prevot 1988,
Kudritzki 1988,
Heydari-Malayeri & Hutsemekers 1991,
Massey & Johnson 1993).
Recently
Pauldrach et al (1994)
have suggested that the most massive star known is Melnick 42
in the LMC, which may have a mass of up to 150
M.
There is an upper luminosity limit to the distribution of stars in
the HR diagram. It runs from log L /
L = 6.8 at
Teff = 40,000 K to log
L /
L = 5.8 at
15,000 K and it stays constant at lower Teff
(Humphreys & Davidson 1979:
Humphreys 1989, 1992).
The theoretical location of the Eddington limit has been examined by
Lamers & Fitzpatrick (1988)
on the basis of model atmospheres including metal line opacities. The
limit was shown to agree with the observed limit in the Milky Way and
in the LMC. Subsequent investigations indicate that the Eddington
limit rises again at low Teff since the opacities decrease
considerably there
(Lamers & Noordhoek 1993).
Thus, the lowest part of
the limit was called the "Eddington trough"; its location in the HR
diagram is, of course, higher for stars of lower Z since they have
lower opacities in the external layers.
The Eddington limit or "trough" may prevent the redward evolution of
very massive stars in the HR diagram
(Maeder 1983,
Lamers & Noordhoek 1993).
The region inside the trough will be empty except for unstable
stars during their outbursts. The upper luminosity limit is determined
by stars that can just pass under the Eddington trough. Thus, because
the location of the trough depends on Z, the upper luminosity of red
supergiants may not be an ideal standard candle, contrary to expectations
(Humphreys 1983b).
The Luminous Blue Variables (LBVs,
Conti 1984),
also called
hypergiants, S Dor, or Hubble-Sandage Variables, are optically the
brightest blue supergiants. They show irregular and violent outbursts,
with average mass loss rates up to about 10-3
M yr-1
(Davidson 1989,
Lamers 1989).
The group continues toward lower Teff as the so-called
cool hypergiants
(Humphreys 1992),
which are the most luminous F, G,
K, and M stars. These also show evidence of variability, of high mass
loss, and extensive circumstellar dust. The He and CNO abundances in LBVs
(Davidson et al 1986)
are in agreement with products of the CNO
cycle at equilibrium, which confirms that LBVs are post-MS supergiants
(Maeder 1983).
About 30 LBVs have been identified by various authors
in nearby galaxies (see list by
Humphreys 1989)
including the LMC,
M31, M33, NGC 2403, M81, and M101. Among hypergiants, the OH/IR
supergiants, revealed by radio and IR observations, are the most
extreme M supergiants, likely having optically thick dust
shells. About two dozen cool hypergiants are currently known in the Milky Way
(Humphreys 1991).
The bolometric luminosities of LBVs are constant
(Appenzeller & Wolf 1981)
during an outburst. However, the matter ejection, particularly
during the outbursts, modifies the photospheric radius and
Teff, and
as a consequence also the bolometric correction and visual luminosity.
During their outbursts, LBVs essentially move back and forth
horizontally along the HR diagram. Obscuration by gas and dust may
also affect the emitted light
(Davidson 1987).
The circumstellar environment of these stars is peculiar and may affect
the distance estimates
(Viotti et al 1993).
The evolutionary changes of P Cyg over
the past two centuries have been recently discussed by
Lamers & de Groot (1992),
de Groot & Lamers (1992), and
El Eid & Hartman (1993)
and have been shown to correspond to recent theoretical estimates. At
its minimum visual light, the star is hotter (T = 20,000-25,000 K)
than at its maximum light (where T = 9000 K).
In the past, LBVs have been assigned to all possible evolutionary
stages, but they are currently interpreted as a short stage in the
evolution of massive stars with initial M > 40
M. A likely
scenario is
O star -> Of / WN -> LBV -> Of / WN -> LBV ... -> WN -> WC.
After central H-exhaustion, the star undergoes redward evolution in
the HR diagram and is likely to reach the Eddington limit or the
"trough". Strong mass loss occurs with shell ejection (LBV). As a
result, stability and bluer location in the HR diagram are restored
(Of/WN). Internal evolution again brings the star to the red in a few
centuries - a time that may depend on the stellar mass and amount of
ejected mass (cf
Maeder 1989, 1992b).
The star again moves toward the
Eddington limit, and the cycle of evolution between the Of/WN and LBV
stages continues until, as a result of mass loss, the surface hydrogen
content is low enough (Xs
 0.3) so that the star definitely
settles in
the Wolf-Rayet stage. The overall duration of the LBV phase is fixed
by the amount of mass M
to be lost between the end of the MS phase
and the entry in the W-R phase. For a typical
M = 10
M and an
average of 10-3 to
10-4 M
yr-1, the typical duration would be
0.3) so that the star definitely
settles in
the Wolf-Rayet stage. The overall duration of the LBV phase is fixed
by the amount of mass M
to be lost between the end of the MS phase
and the entry in the W-R phase. For a typical
M = 10
M and an
average of 10-3 to
10-4 M
yr-1, the typical duration would be
 104 to
105 yr. This general scenario is consistent with several
properties of LBVs: their location in the Hertzsprung-Russell diagram
(Humphreys 1989,
Massey & Johnson 1993),
their rates
(Lamers 1989),
their high N/C and N/O abundance ratios
(Davidson et al 1986),
and the existence of transition objects, as discussed below.
104 to
105 yr. This general scenario is consistent with several
properties of LBVs: their location in the Hertzsprung-Russell diagram
(Humphreys 1989,
Massey & Johnson 1993),
their rates
(Lamers 1989),
their high N/C and N/O abundance ratios
(Davidson et al 1986),
and the existence of transition objects, as discussed below.
Many observational studies have been made of these transition
objects, which are often of spectral type Of/WN and present spectral
variability. Examples are S Dor
(Appenzeller & Wolf 1981,
Wolf et al 1988),
R 71
(Appenzeller & Wolf 1981,
Wolf et al 1981),
AG Car
(Caputo & Viotti 1970,
Viotti et al 1993),
R 127
(Stahl et al 1983;
Stahl 1986,
1987;
Wolf 1989),
R 84
(Schmutz et al 1991),
and He 3-519
(Davidson et al 1993).
It is also possible that after the LBV phase,
some stars go to the stage of OH/IR object and then become W-R
stars. This different, but not contradictory scenario, could happen to
stars with masses low enough to enable them to go below the "trough".
The special cases of Var A in M33
(Humphreys 1989)
and IRC+104020 - an
extreme galactic F-supergiant with a very large IR excess from
circumstellar dust
(Jones et al 1993)
- might correspond to such a scenario.
The physical origin of the outbursts in LBVs and hypergiants is
still a matter of controversy and several models have been considered
(e.g.
Stothers & Chin 1983;
Doom et al 1986;
Appenzeller 1989;
de Jager 1992;
Maeder 1989,
1992b).
The most striking property of these
models is the strong density inversion occurring in the outer layers,
where a thin gaseous layer floats upon a radiatively supported
zone. This zone results from the opacity peak which leads to
supra-Eddington luminosities in some layers. The idea of a density
inversion has a 40 year history
(Underhill 1949,
Mihalas 1969,
Osmer 1972,
BisnovatyiKogan & Nadyozhin 1972,
Stothers & Chin 1983).
A review of the literature shows that essentially three different kinds
of conclusions were drawn: 1. A Rayleigh-Taylor instability occurs as
a result of the density inversion, which is therefore washed out by
the instability. 2. The supra-Eddington luminosity drives an outward
acceleration and mass loss without a density inversion. 3. Strong
convection and turbulence develop and the inversion is maintained.
A difficulty with most models is that they look for a hydrostatic
solution to the problem. However, the resolution likely lies in the
context of hydrodynamical models. Although the second of the above
conclusions seems preferable, it is still unclear whether or not the
density inversion is maintained. Another noticeable peculiarity in the
physics of LBVs is that the thermal timescale in the outer layers is
shorter than the dynamical timescale. During an outburst, which is at
the dynamical timescale, the ionization front is able to substantially
migrate inward
(Maeder 1992b),
so that some layers of matter may
participate in the ejection and produce the observed shells
(Hutsemekers 1994).
3.5 Blue and Red Supergiants
Conti (1991b)
recently reviewed the observations of hot massive stars
in galaxies and a complete list of the observations of red supergiants
in galaxies has been given by
Humphreys (1991).
Humphreys (1983b,
1991)
has also reviewed the potential role of red supergiants as
distance indicators. Amazingly, many problems and controversies remain
about supergiants, for which evolution is even more uncertain than for
W-R stars! The reason is that W-R stars are dominated by the
overwhelming effect of mass loss, which washes out most effects
related to uncertainties in convection and mixing. Supergiants are
often close to a neutral state between a blue and a red location in
the HR diagram
(Tuchmann & Wheeler 1989,
1990);
even minor changes in
convection and mixing processes may greatly affect their evolution.
3.5.1 CHEMICAL ABUNDANCES
Walborn (1976, 1988)
proposed that ordinary OB supergiants have an
atmospheric composition enriched in helium and nitrogen and depleted
in carbon, as a result of CNO processing. According to Walborn, it
may just be the small group of the so-called OBC supergiants that have
normal cosmic abundances
(Howarth & Prinja 1989).
Herrero et al (1992)
showed that most OB supergiants and Of stars show helium
enhancements. As for all rules, there are exceptions: A few
B-supergiants do not show He and N excesses
(Dufton & Lennon 1989).
Herrero et al also show that fast rotators of all luminosities present
evidence of CNO processing. Enhancements of nitrogen and helium
abundances have also been found for post-MS B type stars by
Gies & Lambert (1992),
and by
Voels et al (1989)
in the 09.5 Ia star Cam.
As expected, the so-called OBN stars show evidence of He and N
excesses with C depletion
(Walborn 1988,
Schonberner et al 1988).
Abundance determinations have also been made for B supergiants in
the LMC and SMC, particularly interesting in relation to the
progenitor of SN 1987A. These supergiants generally show He and N
enhancements
(Reitermann et al 1990,
Kudritzki et al 1990,
Lennon et al 1991).
A recent high-dispersion study of LMC B-supergiants also
confirms such enrichments
(Fitzpatrick & Bohannan 1993).
Among 62 stars of types B0.7 to B3, only 7 are OBC stars
(Fitzpatrick 1991).
These authors conclude, in agreement with the Walborn
hypothesis, that the "typical" supergiants show contaminated surfaces,
and only the rare nitrogen weak stars (OBC) have retained their
original main sequence composition. The progenitor of SN 1987A, which
was a B-supergiant, had N/C and N/O ratios larger than solar values by
37 and 12, respectively
(Fransson et al 1989).
From all these results,
it is clear that most B-type supergiants in the Galaxy, the LMC, and
the SMC generally show evidence of CNO processing on their surfaces.
The above observations place severe constraints on stellar models,
which do not usually predict He and N enrichments in blue supergiants
at solar composition. At solar Z, blue loops with the associated He
and N enrichments (as a result of dredge-up in red supergiants) only
occur for M 15
M. This is the case for the models with
Schwarzschild's criterion and overshooting
(Schaller et al 1992),
and with the Ledoux criterion
(Stothers & Chin 1992 a,b;
Brocato & Castellani 1993).
Models with semiconvection
(Arnett 1991)
have the same difficulty: At solar composition, the evolution goes straight to
the red supergiant phase and there are no enriched blue
supergiants. At lower metallicity, the blue loops are generally more
developed and thus blue supergiants are predicted with He and N
enrichments. However, even in this case it seems necessary
(Langer 1992)
to advocate some, rotational mixing to account for the observed abundances.
The study of CNO abundances in three A-type supergiants
(Venn 1993)
reveals N-enrichments larger than predicted by the first convective
dredge-up, if these stars have first gone to the red supergiant stage.
This supports the idea of additional mixing. Analyses of four F-type
supergiants by
Luck & Lambert (1985)
show material processed by the CN
cycle at a level that may be higher than predicted. Analyses of some F
and K supergiants in the SMC by
Barbuy et al (1991)
indicate solar N/Fe and C/Fe ratios, and thus no evidence of CNO processing. A
further study by
Barbuy et al (1992)
of 14 Galactic F-supergiants
shows an absence of CNO processed material in stars with low
rotational velocities. For F supergiants with high rotation, the
derivation of CNO abundances is unfortunately masked by the line
broadening. Yellow supergiants also show sodium overabundance by a
factor of 3 to 4
(Boyarchuk et al 1988:
cf also
Lambert 1992).
Boyarchuk et al have suggested an increase of this
overabundance with initial stellar masses. An interpretation put
forward by
Denissenkov & Ivanov (1987)
and Denissenkov (1988, 1989)
rests on proton capture by the isotope Ne22, supposed to be
overabundant. However, it is not clear why Ne22 should be
overabundant, whether it is present initially, or whether it results
from N-burning in the helium core.
Red supergiants of type G-K Ib exhibit some sodium overabundances,
but less pronounced than in F supergiants
(Lambert 1992).
For red
supergiants, the presence of CNO processed elements, as a result of
dredge-up in the deep convective envelopes, is both expected and observed
(Lambert et al 1984,
Harris & Lambert 1984).
Comparisons show a general agreement
(Maeder 1987a),
with possible indications that some extra mixing may be needed.
3.5.2 THE BLUE HERTZSPRUNG GAP
There are many more stars outside of the MS band than predicted
(Meylan & Maeder 1982).
The problem is particularly serious in the SMC
and LMC. In the Milky Way, excesses of A-type supergiants have also
been suggested
(Stothers & Chin 1977,
Chiosi et al 1978).
The observed
and theoretical numbers can be brought into agreement if the MS phase
would also include the B- and A-type supergiant stages. This
discrepancy is related to the problem of the so-called blue
Hertzsprung gap (BHG), which is predicted by most stellar models to
occur at the end of the MS and is not observed. Instead, the true star
distribution appears continuous from the MS to the A-type supergiants
(Nasi & Forieri 1990,
Fitzpatrick & Garmany 1990,
Chiosi et al 1992b).
Various explanations have been proposed for the lack of a BHG.
Opacity effects may produce a "paunch" on the MS as discussed above
(Section 3.3), but with present opacities
(Iglesias et al 1992)
and mass loss rates, the paunch occurs at luminosities too high to account
for the observations
(Schaller et al 1992).
Extended atmospheres and the role of binaries
(Tuchmann & Wheeler 1989, 1990)
have also been
advocated as explanations. Mixing reduces, but does not suppress, the
gap (Langer 1991c).
The temperature scale may also be a problem given
the photometric nature of most of the observations of stars. A gap
between Teff = 35,000 K and 20,000 K corresponds only
to a difference
of 0.04 in (B - V) color, which is quite small and may be blurred by
other effects. The adjustment of individual isochrones on star
clusters
(Meynet et al 1993),
together with a mapping of He and CNO
abundances and the use of (U - B) colors, may eventually inform us as
to the reality of the gap problem and the exact status of blue
supergiants.
3.5.3 THE SUPERGIANT DISTRIBUTION AND THE SN 1957A
PROGENITOR
A drop-off in the distribution of LMC supergiants in the HR diagram to
the right of an oblique line between log Teff = 4.2
and 3.9 was noted by
Fitzpatrick & Garmany (1990),
and called a "ledge": A further study
of 5050 LMC stars with new calibrations and reddening corrections
(Gochermann 1994)
shows that the "ledge" might be less significant. In
data from the Galaxy it appears marginally
(Blaha & Humphreys 1989).
Two kinds of models are able to produce high numbers of blue
supergiants and to produce a "ledge" or at least a marked decrease in
the star distribution in the HR diagram: (a) models with low mass
loss, (b) models with blue loops.
Models with low mass loss
(Brunish & Truran 1982 a,b:
Schaller et al 1992)
predict that most of the He core burning phase is spent in the
blue supergiant phase directly after the MS. This may give a ledge;
however such models do not provide red supergiants, in disagreement
with observations in the LMC and SMC. The blue location of models with
low mass loss is due to the large intermediate convective zone which
homogenizes a part of the star
(Stothers & Chin 1979,
Maeder 1981).
Mass loss, even if small, reduces this zone and favors the
redward motion in the HR diagram, and thus the star becomes a red
supergiant early during the He phase. However, the uncertainties about
mass loss are critical. As an example, 25
M models at
Z = 0.008 with typical
(Schaerer et al 1993a)
spend most of their He-burning phase
in the blue with log Teff between 4.3 and 3.9. An
enhancement of by
a factor of 2 leads to a red location of the whole He-burning phase
(Meynet et al 1994).
Thus, as long as the rates
are imprecise, it
may be difficult to derive conclusions about semiconvection,
diffusion, and rotational mixing from the distribution of supergiants.
Models with blue loops also enhance the number of blue supergiants,
and are simultaneously able to account for some He and N enrichments
in blue supergiants, but often not as much as required by the
observations (Section 3.5.1). Models with
Schwarzschild's criterion
and overshooting at Z
0.008 have well-developed blue
phases at all masses
(Schaerer et al 1993a).
This is also the case for models with
the Ledoux criterion for Z < 0.004
(Brocato & Castellani 1993)
and for models with semiconvection by
Arnett (1991)
at Z < 0.007, which well
reproduce the numbers of blue and red supergiants in the LMC and lead
to a blue location of the supernova progenitor at 20
M, as must be
the case for SN 1987A
(Arnett 1991,
Langer 1991c).
The physical
connection leading to the blue progenitor is most interesting
(Langer 1991 a,c)
and illustrates a general stellar property. The mild mixing
reduces the He content in the He burning shell, which is therefore
less efficient. At the end of the He core burning phase, when the CO
core contracts, the He shell acts as a weak minor and produces only a
moderate expansion in the intershell region between the He and H
shells. Thus, the H shell is not extinct and it keeps very active. It
acts as a strong mirror responding to the moderate intershell
expansion by a strong contraction of the external envelope; therefore
a blue final location results.
In conclusion, uncertainties in mass loss rates may allow many models
to fit some features of the supergiant distributions. However, the
situation is not fully satisfactory regarding the He and N enhancements,
the BHG, and the "ledge." These features are usually not predicted at
solar Z. At lower Z, most models predict blue loops and
better fit the
observations, but even there the agreement does not seem complete for
either the BHG, or the He or N abundances. It is essential that the
models reproduce the observations at all metallicities and this is not
yet achieved.
3.5.4 THE RATIO OF BLUE TO RED SUPERGIANTS (B/R)
The B/R of supergiants was among the first stellar properties to be
shown to vary through galaxies
(van den Bergh 1968,
Humphreys & Davidson 1979,
Humphreys 1983a,
Meylan & Maeder 1983,
Humphreys & McElroy 1984,
Brunish et al 1986).
Studies have been made in the Milky
Way, the LMC, the SMC, and also in M33
(Humphreys & Sandage 1980,
Freedman 1985).
The B/R depends on the range of luminosities
considered, being found to be slightly larger at higher
luminosities. The main trend is that B/R increases steeply with Z: for
Mbol between -7.5 and -8.5. B/R is up to 40 or more in
inner Galactic regions and only about 4 in the SMC
(Humphreys & McElroy 1984).
A difference in B/R by an order of magnitude between the Galaxy and the
SMC was also found on the basis of well-selected clusters
(Meylan & Maeder 1982).
Further studies of the young SMC cluster NGC 330 confirm
the high number of red supergiants
(Carney et al 1985).
Many star models are able to account for the occurrence of blue
supergiants, with predicted B/R more or less in agreement with the
observations
(Brunish et al 1986).
As already mentioned, one reason
for this is the flexibility offered by the uncertain mass loss rates.
Indeed, B/R may change from infinity in the case of no mass loss to
about 0 for high mass loss rates. Thus, we emphasize that the real
difficulty is not to account for some average observed B/R in the LMC
or the Galaxy, but to account also for its change with
metallicity. The models with Schwarzschild's criterion and overshooting
(Schaller et al 1992,
Alongi et al 1993),
the models with
the Ledoux criterion
(Brocato & Castellani 1993),
and the models with semiconvection
(Arnett 1991),
even if they are able to fit some
average B/R, all appear to predict higher B/R at lower Z, in
contradiction to the observations. This is a major problem, which is
not solved by any of the published models.
We also point out an interesting change is the Teff of red
supergiants according to the metallicity of the parent galaxy. Red
supergiants are hotter at lower Z, the difference amounting to about
800 K between models at Z = 0.001 and at Z = 0.040
(Schaller et al 1992).
This is consistent with observations
(Humphreys 1979,
Elias et al 1985)
which show that red supergiants in the Milky Way have
spectral types between MO and M5, while in the SMC they are between
types K3 and M2. This difference in the range of the spectral types of
red supergiants is mainly the result of increased opacities at higher
metallicities. We recall that a significant star formation rate is
also a necessary condition for the presence of red supergiants in a
galaxy. As an example, the paucity of red supergiants in M31 has been
assigned to the low star formation rate rather than to the metallicity
(Humphreys et al 1988).
However, when B/R ratios are considered in
galaxies, the effects of possible differences in the SFR and IMF are
quite small and mainly result from effects of Z. These various tests
show just how essential the studies of galaxies with different
metallicities are for stellar evolution.
4. W-R STARS: OBSERVATIONS AND PREDICTIONS
4.1 Overview
Recent general reviews on Wolf-Rayet stars have been made by
Abbott & Conti (1981),
Willis (1987, 1991),
Conti & Underhill (1988),
Smith (1991a),
van der Hucht (1991, 1992),
Maeder (1991c),
and Massey & Armandroff (1991).
W-R stars are nowadays considered as "bare cores"
resulting mainly from stellar winds peeling off of single stars
initially more massive than about 25 to 40
M. Close
binaries might
also lose their outer layers from Roche lobe overflow (RLOF). The main
evidence for the bare core model as reviewed by
Lamers et al (1991)
are the following:
- H/He ratios in W-R stars are low or zero.
- The CNO ratios are typical of nuclear equilibrium
(Section 4.2.1) in WN stars.
- The continuity of the abundances in the sequence of types O, Of,
WNL, WNE, WCL, WCE, and WO corresponds nicely to a progression in
peeling off the outer material from evolving massive stars.
- The observed in
progenitor O stars and in supergiants are high
enough to remove the stellar envelopes within the stellar lifetimes.
Also, the average in W-R stars
(Conti 1988)
are able to accomplish further significant mass loss.
- W-R stars have low average masses (between 5 and 10
M;
Abbott & Conti 1987);
moreover, they fit well the mass-luminosity relation for He stars
(Smith & Maeder 1989).
- W-R stars are present in young clusters and associations with ages
smaller than 6 Myr
(Humphreys & McElroy 1984,
Schild & Maeder 1984).
- Transition objects Of/WN between Of and W-R stars and between LBV and
WN stars exist (Section 3.3).
- He- and N-rich shells are present around some W-R stars
(Esteban & Vilchez 1991).
- The W-R/O and WN/WC number ratios are consistent with theoretical
expectations in galaxies with different Z
(Section 4.5).
With their bright emission lines and their high luminosities, W-R
stars are observable at large distances and are thus the stars for
which we have the best sampling in other galaxies. Their emission
lines also can become visible in the integrated spectrum of galaxies
with active star formation, which enables us to extend the studies of
young massive stars even farther out in the Universe. The discovery of
the differences in W-R populations in galaxies has a long history
starting with
Roberts (1962)
in the Milky Way and later Smith
(1968 a,b,c)
for the Magellanic Clouds. Further studies in the LMC and SMC
(Azzopardi & Breysacher 1979,
1985;
Breysacher 1981)
confirmed the
variations of W-R populations. These were also noticed (e.g.
Kunth & Sargent 1981)
in a sample of blue compact galaxies, which are dwarf
galaxies with very active star formation, and in the so-called H II or
W-R galaxies
(Conti 1991a).
The observed variations concern mostly the
statistics, and in particular, ratios such as W-R/O or WC/WN.
The existence and origin of the variations of W-R populations in
galaxies has been extensively debated over the past decade (see
Section 4.6). Indeed, properties and statistics of
W-R stars depend on
many parameters: metallicity Z, star formation rate (SFR), initial
mass function (IMF), age and duration of the bursts, binary frequency,
etc. It is essential to distinguish between (a) regions in galaxies
where the assumption of an average constant star formation rate over,
say, the past 20 Myr is valid, and (b) regions or galaxies where a
strong recent burst has recently occurred so that the assumption of a
constant SFR does not apply. The first case concerns selected volumes
in the Milky Way and in other galaxies (where individual W-R stars may
be counted), where a stationary situation for star formation can be
assumed. Within these regions, the effects of metallicity intrinsic to
stellar evolution can be assumed to be the dominant factor responsible
for the differences in W-R populations. This case is examined here
first, as its proper understanding is a prerequisite for the studies
of the second case (Section 5), which
concerns distant GH II regions. W-R galaxies, and other starbursts.
4.2 Subtypes and Chemical Abundances
The basic physical parameters of W-R stars, i.e. their masses M,
luminosities L, mass loss rates
, radii R, and
temperatures Teff, have been discussed by
Conti (1988),
Abbott & Conti (1987),
and van der Hucht (1992).
The M are in the range of 5 to 50
M with an
average of
about 10 M:
the L are between 104.5 and 106
L; the
between 10-5 and
10-4
M / yr with
an average of 4 × 10⁻⁵
M / yr; and
the observed Teff are
between 30,000 K and 90,000 K, There are two main groups of Wolf-Rayet
stars: subtypes WN and WC; a small additional subset is labeled WO
(Barlow & Hummer 1982).
4.2.1 WN STARS
The WN types are nitrogen-rich helium stars
(Smith 1973)
showing the
"equilibrium" products of the CNO hydrogen burning cycle. The late WN
stars of types WN6��WN9, abbreviated WNL
(Vanbeveren & Conti 1980,
Conti & Massey 1989),
generally still contain some hydrogen with H/He
ratios between 5 and 1 by number
(Conti et al 1983a;
Willis 1991;
Hamann et al 1991,
1993;
Crowther et al 1991).
The early WN stars of
types WN2-WN6, or WNE, generally show no evidence of hydrogen in their
spectra. (There are a few exceptions to this general abundance
relation with spectral subtype.) In a smaller sample of objects,
Hamann et al (1993)
found a correlation of the hydrogen content with
the Teff of WN stars, rather than with their subtypes;
the coolest WN
stars showed hydrogen and the hottest ones had none. The presence or
absence of hydrogen certainly should be a determining factor
influencing the opacity, temperature, and the structure of the outer
layers.
The observed abundance ratios in mass fraction are C/He = (0.21-8) ×
10-2; N/He = (0.035-1.4) × 10-2; and C/N
(0.6-6.0) × 10-2 (cf
Willis 1991,
Nugis 1991).
The corresponding solar ratios are respectively 1.1
× 10-2, 3.3 × 10⁻³, and 3.25
(Grevesse 1991
and references
therein). The well-studied WN5 star HD 50896 gives similar results (cf
Hillier 1987 a,b,
1988).
Not much is known concerning the oxygen
content of WN stars. Studies of ring nebulae around some WN stars
also show strong overabundances of N and He with respect to the Sun
(Parker 1978;
Esteban & Vilchez 1991,
1992;
Esteban et a1 1992,
1993).
These authors suggest that the ring nebulae have been ejected
at the end of the red supergiant phase. In our opinion, it is more
likely that a large part of the shell ejection, or even most of it,
occurs during the first thousand years after the entry in the WNE and
WC stages, which are marked by extreme mass loss, as predicted by the
M vs M relation for W-R stars (cf
Langer 1989b).
Among WN stars, eight have inordinately strong CIV lines
(Conti & Massey 1989).
Labeled
WN/WC stars, these are suggested to be transition objects between WN
and WC stars (Section 4.5).
The observed abundance ratios span the range of equilibrium values
of the CNO cycle
(Maeder 1983,
1991b),
with C/N and O/N ratios two
orders of magnitude smaller than solar. Interestingly enough, such
values are essentially independent of the various model assumptions
and mainly reflect the nuclear cross sections and initial
composition. The good agreement between the observed and predicted
values of CNO equilibrium indicates the general correctness of our
understanding of the CNO cycle and of the relevant nuclear data.
The initial CNO content, which depends of the initial Z, determines
the amount of nitrogen in WN stars
(Maeder 1990,
Schaller et al 1992).
The N abundance is thus lower for lower initial Z, but equilibrium
ratios such as C/N are predicted to be independent of the initial
Z. In this connection, one can understand the result by
Smith (1991a)
who noticed that the ratio of the
 4686 He II line to the
4640 N III
line is stronger for WNL stars in the LMC compared to the Galaxy.
4686 He II line to the
4640 N III
line is stronger for WNL stars in the LMC compared to the Galaxy.
4.2.2 WC STARS
WC stars contain no hydrogen and, as a result of mass loss, are mainly
He, C, and O cores as a result of mass loss
(Smith & Hummer 1988,
Torres 1988,
de Freitas-Pacheco & Machado 1988,
Hillier 1989,
Willis 1991,
Nugis 1991,
Eenens & Williams 1992,
de Freitas Pacheco et al 1993).
These stars represent objects in which we see at the surface
the result of triple- and
other helium burning reactions. A most
interesting finding is the one by Smith & Hummer, who showed that the
C/He ratio is increasing for earlier WC subtypes.
Smith & Maeder (1991)
emphasize that a measured (C+0) / He ratio is to be preferred to
the C/He and C/O ratios which go up and down during helium
processing. They propose the following calibration in (C+O) / He number
ratios: WC9, 0.03-0.06; WC8, 0.1; WC7, 0.2; WC6, 0.3; WC5, 0.55; WC4,
0.7-1.0; WO, > 1.
The sequence of types WC9 to WO appears as a progression in the
exposure of the products of He burning. The rare WO stars
(Barlow & Hummer 1982,
Kingsburgh & Barlow 1991,
Polcaro et al 1992,
Kingsburgh et al 1994)
simply appear to be the most extreme type in this
sequence. Comparisons of observations and model predictions show a
generally good agreement
(Willis 1991,
1994):
however, closer comparisons
(Schaerer & Maeder 1992)
suggest that in previous
evolutionary phases could be higher by a factor of 2 with respect to
current values by
de Jager et al (1988).
The above connection between
WC sub-types and the (C+O) / He ratios is the key to understanding the
Z-dependence of the distribution of WC stars in galaxies of different
metallicities (Section 4.6).
A present uncertainty concerns neon in WC stars. Models predict a
substantial abundance of neon (larger than 0.03 in mass fraction) -
essentially Ne22 at high initial Z and Ne20 at low
Z
(Maeder 1991a).
However, the only available data, which come from IRAS observation of
Ne II at 15.5 microns, indicate an abundance of 0.005 in the WC8 star
 Vel
(Barlow et al 1988).
Some of the nuclear cross sections in the
chain leading to Ne22 are still very uncertain and the ashes
of N14
could possibly be stocked in the form of O18 (indistinguishable from
O16 in W-R stars) rather than in the form of
Ne22. The problem is of
importance for explaining the role of WC stars as a possible site for
s-elements
(Prantzos et al 1990),
since these elements should be
formed by Ne22 (,
n)Mg25. The role of W-R stars as producers of
radioactive Al26, detectable through y ray observations, does
not seem important according to
Signore & Dupraz (1990),
but according to
Meynet (1994a)
their role could be as important as that of supernovae.
Vel
(Barlow et al 1988).
Some of the nuclear cross sections in the
chain leading to Ne22 are still very uncertain and the ashes
of N14
could possibly be stocked in the form of O18 (indistinguishable from
O16 in W-R stars) rather than in the form of
Ne22. The problem is of
importance for explaining the role of WC stars as a possible site for
s-elements
(Prantzos et al 1990),
since these elements should be
formed by Ne22 (,
n)Mg25. The role of W-R stars as producers of
radioactive Al26, detectable through y ray observations, does
not seem important according to
Signore & Dupraz (1990),
but according to
Meynet (1994a)
their role could be as important as that of supernovae.
4.3 Physical Properties
In addition to the usual model ingredients, the W-R star models
specifically require special attention on a number of
points. Concerning microphysics, the W-R models demand Rosseland
opacities for the appropriate He-C-O mixtures
(Iglesias & Rogers 1993)
and detailed calculations of the ionization balance for heavy elements
(Langer et al 1986,
Schaller et al 1992).
The Ms in stages previous to
the W-R phases and their dependence on Z are very critical. Also, the
adopted definitions (based on surface abundances) for the transitions
from LBV to WNL, WNL to WNE, and WNE to WC are of importance for the
comparison of models and observations.
For in the W-R stage, the
average observed rates
(Abbott et al 1986,
Conti 1988)
have often been used. However, these rates have led
to masses and luminosities that are too high with respect to the
observations
(Schmutz et al 1989).
A number of convergent suggestions
have been provided recently in favor of a mass dependence of
in WNE
and WC stars. In particular, models by
Langer(1989b)
suggest a
relation of the form: (W-R) =
(0.6-1.0) × 10-7 (M /
M)2.5
M / yr, where
the first coefficient applies to WNE and the second to WC
stars. Similar mass-dependent
s have been provided from binaries
(Abbott et al 1986,
St Louis et al 1988),
and from modeling the wind properties
(Turolla et al 1988,
Bandiera & Turolla 1990,
Schaerer & Maeder 1992).
The vs M relation
generally leads to an enormous mass
loss at the entry in the WNE stage, which results in very low final
W-R masses. This has a considerable impact on the chemical yields of
massive stars
(Maeder 1992a),
also resulting in an increase of the W-R
lifetimes. A question remains as to whether the WN luminosities
predicted from models with standard
(de Jager et al 1988)
are not too high with respect to the observed ones
(Howarth & Schmutz 1992).
Indeed, the relatively low observed luminosities of some WN
stars support larger in
previous stages. There are at present no indications of a mass dependence of
for WNL stars, although such a
relation would not be too surprising.
The maximum mass for the vibrational stability of a He star is about
16 M
(Noels & Maserel 1982, Noels & Magain 1984).
Thus, if a star
enters the helium configuration with a mass larger than critical
(which occurs in current models), it may be expected to be
vibrationally unstable with high mass loss as a consequence
(Maeder 1985).
The fact that regular pulsations have been recently observed in
the WN8 star WR 40
(Blecha et al 1992)
might give some support to this
claim. However, the nature of these pulsations is still under discussion
(Kirbiyik 1987)
and different pulsation modes have been proposed by
Glatzel et al (1993) and
Kiriakidis et al (1993).
Attempts
are also being made to explain the strong W-R winds by
multi-scattering and purely radiative processes
(Pauldrach et al 1988,
Cassinelli 1991),
by radiation and turbulence
(Blomme et al 1991),
or by radiation and Alfven waves
(Dos Santos et al 1993).
The main
difficulty, which is not satisfactorily resolved, is to explain why
the wind momentum of W-R stats may be up to 30 times the photon momentum
(Barlow et al 1981,
Cassinelli 1991;
but see
Lucy & Abbott 1993).
The problems of the atmospheres of hot stars have been reviewed by
Kudritzki & Hummer (1990)
and the different definitions of the radii
and Teff in extended atmospheres by
Bascheck et al (1991).
Values of hit have been given recently by
Conti (1988),
Schmutz et al (1989,
1993), and
Koesterke et al (1992):
They range between about 3 × 10⁴
and 105 K. In order to compare the observed
Teff with data from
interior models, a simple correction scheme has been proposed to
roughly account for the optically thick winds of W-R stars
(de Loore et al 1982,
Langer 1989a).
More refined procedures have been established by
Kato & Iben (1992), by
Schaller et al (1992),
and in particular by
Schaerer & Schmutz (1994).
The net result is that from a
surface temperature of 1-1.5 × 10⁵ K (without the wind),
the W-R stars
are shifted down to Teff 3-10 × 104 K
according to their rates, and
thus also according to their masses and luminosities since there is a
M-L- relation.
Since W-R stars of types WNE and WC are He-C-O cores, they have a
rather simple internal structure with little compositional difference
between center and surface. W-R properties and the relations between
the subtypes are mostly independent of their formation. Evolutionary
models predict
M-L--Teff
relations
(Schaerer & Maeder 1992)
for W-R stars without hydrogen. The mass-luminosity M-L relation is
(Maeder 1983,
Langer 1989a,
Beech and Mitalas 1992,
Schaerer & Maeder 1992):

| (2)
|
For M > 10
M, a linear
relation may be appropriate. On the
observational side, the M-L relation has been confirmed
(Smith & Maeder 1989,
Smith et al 1994).
The vs M relation is
supported by
binary observations as discussed above. The
M-L--Teff
relations also
indicate that WNE stars and WC stars should follow well-defined tracks
in the HR. diagrams. Such alignments seem to be present in the data
of Hamann et al
(1991,
1993; but see also
Maeder & Meynet 1994).
For WNL stars, the luminosities are generally higher than for WNE stars
(Conti 1988).
Models indi1cate that WNL luminosities are mainly
related to the initial masses. The reason is that the luminosity
depends on the size of the He cores, which is determined mainly by the
initial mass rather than by the actual mass, as long as the He cores
are not themselves peeled off. Models also suggest, in agreement with
observations (cf
Hamann et al 1993),
that the WNL Teff are mainly
determined by the remaining hydrogen content.
4.4 Initial Masses, Lifetimes, Formation
Observationally, most W-R stars appear to originate from stars
initially more massive than about 40
M
(Conti et al 1983b,
Conti 1984,
Humphreys et al 1985,
Tutukov & Yungelson 1985).
From the
presence of W-R stars in clusters down to type BO, it is clear that a
few W-R stars may originate from initial masses down to 20-25
M
(Firmani 1982,
The et al 1982,
Schild & Maeder 1984).
The modeling of W-R ring nebulae
(Esteban et al 1992)
also supports the above values
of initial masses. The minimum mass for forming WC stars does not
seem significantly higher than that for WN stars.
Maeder & Meynet (1994)
have obtained the lifetimes in the W-R stage
for two different cases: 1. the standard case with mass loss rates by
de Jager et al (1988)
in pre-W-R stages and the scaling with Z0.5 at
other metallicities; and 2. the case with M arbitrarily twice as large
as in pre-W-R stages. Indeed, several observations, in particular the
chemical abundances in WC stars (Section 4.2), the
W-R luminosities
(Section 4.3), and the number ratios of W-R stats
(Section 4.5)
clearly support the case of enhanced mass loss, for which the W-R
lifetimes are shown in Figure 1. From this
figure we note that:
- The minimum mass for forming W-R stars ranges from about 20 to 25
M
at Z = 0.04 to about 80
M at
Z = 0.001. The lower mass value is in
agreement with the observations in the Milky Way. The change of the
minimum initial mass with Z is a key effect to explaining the W-R
statistics in galaxies.
- The lifetimes in the W-R stage go up with M and Z,
which is just the
opposite of the behavior on the main sequence. The average W-R
lifetime weighted by the IMF is about 0.6 Myr at Z = 0.02 (for
rates
twice the standard ones). Figure 1 shows
lifetimes up to about 2 Myr in extreme cases.
- A detailed inspection of the model results indicates that the largest
initial stellar masses spend most of the W-R phase in the WNL stage
(Langer 1987, Maeder 1991a).
If the WNL phase is defined from the H
abundance at the surface (Section 4.2.1), then the
WNL stage can even
be entered during the main sequence phase of the most massive stars.
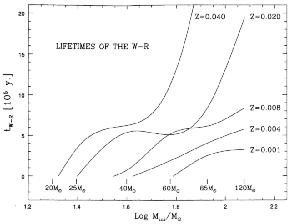
|
Figure 1.
Durations of the W-R phase as a function of initial stellar
masses for different Z in the case of enhanced mass loss rates (from
Maeder & Meynet 1994).
|
- The lower initial masses have very short WNL phases, and spend much
more time in the WNE and WC phases.
The formation of W-R stars is largely dominated by the overwhelming
effects of mass loss, as first proposed in the "Conti" scenario
(Conti 1976).
Mixing processes due to rotation or tidal distortion in
binaries may favor in some cases the formation of W-R stars and
increase their lifetimes
(Maeder 1981,
1987b).
Semiconvection or some
mild mixing at the edge of the He core seems necessary to account for
the existence of intermediate WN/WC stars
(Langer 1991b).
These stars represent about 4% of the W-R stars
(Conti & Massey 1989),
while models without extra mixing only predict 1% or less of WN/WC
stars. These stars cannot be explained by binary evolution
(Vrancken et al 1991).
Some additional mixing is necessary, but at the same time
the small observed fraction of WN/WC stars implies that the part of
the stellar mass that is actually mixed is quite small, and this puts
a limit on the role of mixing at the edge of the He core.
Detailed investigations of W-R binaries have been carried out in the
Galaxy by
Massey (1981)
and in the Magellanic Clouds by
Moffat 1988
and Moffat et al 1990.
Binary mass transfer by RLOF, which is an
extreme case of tidal interaction, may contribute to the formation of
WR+O binaries
(de Loore 1982;
De Greve et al 1988;
Vanbeveren 1988,
1991,
1994;
Schulte-Ladbeck 1989;
De Greve 1991,
de Loore & Vanbeveren 1994).
The fraction of all stars (single + binaries) undergoing RLOF
is estimated to be between 20 and 40%
(Podsiadlowski et al 1992).
We may note that this percentage also includes binaries that could be
mixed by tidal interactions and would thus evolve homogeneously,
without large increase of their radius and thus without RLOF, Indeed,
the importance of RLOF in W-R+O binaries is still unclear. From the
similarity of the relatively large orbital eccentricities in W-R+O and
O+O binaries,
Massey (1981)
concluded that mass transfer probably did
not play a major role in the formation of W-R+O binaries. We may
conjecture that several effects contribute to the formation of W-R
stars; it is likely that the relative importance of these effects
changes with Z as discussed below.
4.5 W-R Statistics
4.5.1 BASIC DATA AND ITS INTERPRETATION
W-R stars are observed in several galaxies of the Local Group, and
provide statistical data on their relative frequencies at various
metallicities. In the Milky Way, the catalogs by
van der Hucht et al (1988),
and by
Conti & Vacca (1990)
provide rather complete samples up
to about 2.5 kpc. These data show that the number density of W-R stars
projected onto the Galactic plane is strongly increasing with
decreasing galactocentric distance. Deep surveys are extending the
sampling
(Shara et al 1991).
The LMC and SMC catalogs are cornerstones
for data at other Z
(Azzopardi & Breysacher 1979,
1985;
Breysacher 1981,
1986).
A few additional W-R stars have also been identified
(Morgan & Good 1985,
Testor & Schild 1990,
Schild et al 1991,
Morgan et al 1991).
Most (75%) of the W-R stars in the center of the 30 Dor
Nebula are WNL stars of types WN6-WN7
(Moffat et al 1987),
while in
the surroundings the proportion is much lower. The excess of WNL stars
in giant H II regions is a common feature, as evidenced by those in
M33
(Drissen et al 1990,
1991).
The subtype distribution of W-R stars
in the Magellanic Clouds has been considered by
Smith (1991b).
Data
on W-R stars in M31 have been obtained by Moffat & Shara
(1983,
1987),
Massey et al
(1986,
1987a),
Armandroff & Massey (1991),
and Willis et al (1992).
For M33, studies have been made by
Wray & Corso (1972),
Conti & Massey (1981),
Massey & Conti (1983),
Massey et al (1987 a,
b),
Schild et al (1990),
and Armandroff & Massey (1991).
In both M31
and M33, the samples are still incomplete. In the two small galaxies
NGC 6822 and IC 1613 of the Local Group, many W-R stars were proposed by
Armandroff & Massey (1985)
and Massey et al (1987a),
but further analyses by Azzopardi et al
(1988; see also
Smith 1988)
confirmed only four W-R stars in NGC 6822 and one, which was already found by
Davidson & Kinman (1982),
in IC 1613. The study of W-R stars in other
galaxies is continuing. The galaxy IC 10 at 1.5 Mpc exhibits a very
high density of W-R stars with a WC/WN number ratio of about 0.5
(Massey et al 1992).
Ten individual W-R stars have been detected in
the galaxy NGC 300 at a distance of 1.5 Mpc
(Schild & Testor 1991,
1992).
Analyses of W-R star statistics in nearby galaxies have been made by
Azzopardi et al (1988),
Smith (1988),
Massey & Armandroff (1991),
Maeder (1991a),
and Maeder & Meynet (1994).
Table 2 gives the
available data on the W-R/O, WC/W-R, and WC/WN ratios for galaxies of
the Local Group, when an indication of the metallicity Z is
available. The table is adapted from
Maeder (1991a)
with revisions according to recent data from
Conti & Vacca (1990)
for the Milky Way; for M31 the W-R/O is from
Cananzi (1992);
for the SMC the new W-R star found by
Morgan et al (1991)
is included; the WN/WC ratios are in
agreement with those found by
Armandroff & Massey (1991).
Due to small number statistics, the ratios for NGC 6822 and IC 1613 are not
significant.
Such number ratios are to be preferred to surface densities, which
would depend not only on stellar evolution but also on the current
SFR. For the Galaxy, the statistics for O stars is based on the survey by
Garmany & Conti (1982).
In other galaxies, the numbers of O stars were estimated by
Azzopardi et al (1988)
on the basis of UV data
from Geneva and Marseille balloon experiments and on the basis of
Lequeux's (1986)
luminosity function. These indirect estimates lead to
larger uncertainties in the numbers of O stars than in those for W-R
stars.
The origin of the observed variations of the relative number of W-R
stars in different environments was attributed to metallicity by
Smith (1973) and
Maeder et al (1980),
who suggested that high Z favors mass
loss, which in turn favors the formation of W-R stars. The variations
of W-R subclasses in M31 were also attributed to a metallicity effect
by Moffat & Shara (1983).
The total dependence on Z was criticized by
several authors, who attributed the differences in the W-R populations
mainly to changes in the IMf and SFR
(Bertelli & Chiosi 1981,
1982;
Garmany et al 1982;
Armandroff & Massey 1985;
Massey 1985;
Massey et al 1986;
Massey & Armandroff 1991).
As suggested by these authors, it
is possible that prominent departures from the assumption of constant
star formation, such as is the case in 30 Dor in the LMC
(Moffat et al 1987)
or in giant HII regions of M33
(Conti & Massey 1981,
Drissen et at 1990)
where recent bursts of SFR have occurred, may produce
peculiar W-R number ratios (Section 5).
However, we note that no
systematic difference in the IMF slope has been found between the
Galaxy, the LMC, and SMC
(Humphreys & McElroy, 1984,
Mateo 1988,
Massey et at 1989a,
Parker et al 1992,
Section 2). Also, the Galactic
gradient of the surface density of W-R stars is much steeper than that
of their precursor O stars
(Meylan & Maeder 1982,
van der Hucht et al 1988)
- a fact that is reflected by the changes of the W-R/O in
Table 2. Thus, it is likely that the basic effect
in stellar evolutionary
models is Z, and that effects connected to the SFR and perhaps to the
IMF are population parameters that may also influence the relative
frequencies of W-R stars in G HII regions and bursts.
Table 2. Observed W-R/O, WC/W-R, and WC/WN in
galaxies of various metallicities
|
| GALAXY | Z | W-R/O | WC/W-R | WC/WN
|
|
| M31 | 0.035 | 0.24 | 0.44 | 0.79
|
| MILKY WAY | | | |
|
| ring 6-7.5 kpc | 0.029 | 0.205 | 0.55 | 1.22
|
| ring 7.5-9 kpc | 0.020 | 0.104 | 0.48 | 0.92
|
| ring 9.5-11 kpc | 0.013 | 0.033 | 0.33 | 0.49
|
| M33 | 0.013 | 0.06 | 0.52 | 1.08
|
| LMC | 0.006 | 0.04 | 0.20 | 0.26
|
| NGC 6822 | 0.005 | 0.02 | - | -
|
| SMC | 0.002 | 0.017 | 0.11 | 0.13
|
| IC 1613 | 0.002 | 0.02 | - | -
|
|
4.5.2 PREDICTED W-R/O AND WC/WN VALUES
As illustrated in Table 2, the W-R/O ratio
increases with the metallicity of the parent galaxy
(Maeder et al 1980;
Azzopardi et al 1988;
Smith 1988,
1991a).
This general trend is also confirmed by
studies of the integrated properties of H II or W-R galaxies
(Arnault et al 1989;
Conti 1991 a,b;
Smith 1991a;
Vacca & Conti 1992;
Mas-Hesse & Kunth 1991 a,b;
Mas-Hesse 1992).
In stellar models a growth of the W-R/O with Z is predicted
(Maeder 1991 a,
Maeder & Meynet 1994),
resulting from the lowering of the minimum initial mass for forming
W-R stars and from the increase of the lifetimes with increasing Z
(and mass loss). Figure 2 compares the
observations of Table 2 with
theoretical values for models with enhanced
as defined in
Section 4.4 and for stars with a Salpeter IMF. The
general agreement is quite
good, confirming that metallicity is a key factor in the variations of
the W-R/O ratio. Although some scatter appears, it might be due to
local departures from the simple assumption of a past constant SER and
to the averaging over some range of Z in large galaxies
(Smith 1991a).
No satisfactory agreement between observed and predicted W-R/O
can be achieved for models with standard
(de Jager et al 1988).
The differences would be especially large at high Z, while at
Z = 0.002,
the W-R/O values are in both cases of mass loss equal to about
0.005. Such negligible W-R/O values at low Z are in agreement with the
low fraction of W-R stars observed in metal deficient galaxies. Also,
the study of the integrated spectrum and He II 4686 Å feature in dwarf
galaxies shows a general absence of W-R contribution for galaxies with
very low oxygen content, corresponding to about Z = 0.002
(Arnault et al 1989,
Smith 1991a).
The observed WC/WN and WC/W-R numbers in Table 2
show a general
growth with increasing Z, but it is not monotonic and shows an
appreciable scatter. This was noted by
Armandroff & Massey (1991) and
Massey & Armandroff (1991)
as an argument supporting the fact that
metallicity is not the only determining factor for explaining the W-R
statistics. From models, the change in WC/WN results from the higher
which leads to an earlier visibility of the products of He burning
(Maeder 1991a,
Maeder & Meynet 1994).
Interestingly enough, for larger
M the predicted WC/WN ratios, instead of further increasing as
expected, go down again as Z becomes greater than 0.01. This occurs
because the WN phase of the most massive stars has already been
entered during the main sequence phase and is therefore much
longer. This model result accounts for the nonmonotonic behavior of
WC/WN found by
Armandroff & Massey (1991).
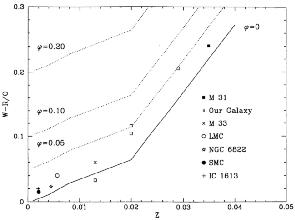
|
Figure 2. W-R/O as a function of Z
in nearby galaxies compared to model predictions by
Maeder & Meynet (1994).
The solid line represents the
predictions of single star models with enhanced mass loss rates
(Section 4.4) and Salpeter's IMF. The dotted lines
show the same for different
values  , the fraction of O
stars undergoing mass transfer in binaries. , the fraction of O
stars undergoing mass transfer in binaries.
|
The comparison between observed and theoretical WC/WN or WC/W-R
shows, as for the W-R/O, that a better fit is obtained for models with
enhanced in previous
phases. Nevertheless, the scatter is still
there, and reflects departures from the assumption of a constant
SFR. Such departures are prominent in some giant H II regions, such as
30 Dor in the LMC, or NGC 592, 595, and 604 in M33, which show
evidence of intense star formation
(Conti & Massey 1981;
Drissen et al 1990,
1991).
Armandroff & Massey (1985)
and Massey & Armandroff (1991)
noticed that regions with metallicity similar to that of the
LMC and SMC have different W-R numbers.
Smith & Maeder (1991)
suggested that in large spirals the W-R populations will he heavily
weighted toward properties of high Z values. Thus both the effects of
bursts of star formation (Section 5) and of
the averaging over Z may
contribute to increases in the W-R/O and WC/WN ratios, a situation
which may apply particularly to M33.
Close comparisons between models and observations must also account
for the various channels of W-R formation and in particular the Roche
lobe overflow (RLOF) in close binaries
(Vanbeveren 1991,
1994;
Vanbeveren & de Loore 1993).
The fraction of O stars becoming W-R
stars as a result of RLOF was estimated by the latter authors to be
about 35% (see also
Podsiadlowski et al 1992).
A new analysis quoted above
(Maeder & Meynet 1994)
suggests that the fraction of W-R stars
owing their existence to RLOF is highly variable with the metallicity
of the parent galaxy; it is nearly 100% at low Z, like in the SMC
(Smith 1991b),
and lower than 10% in the inner regions of the Milky Way.
The above results are compatible as shown in
Figure 2 with a
relatively low fraction , at
most 10%, of the ensemble of the O stars
that become W-R as a result of binary mass transfer. Such a low
fraction is consistent with by
Massey's (1981)
result on the distribution of the eccentricities of WR+O binaries. A close
investigation of the young cluster Tr 14
(Penny et al 1993)
reveals a
general absence of close binaries among the brightest O stars. In
further support of a low fraction of O stars undergoing RLOF, we
remark that at the low Z in the SMC, the W-R/O ratio is about 0.017,
while it is 0.21 in inner Galactic regions. Thus, if the fraction of O
stars becoming W-R as a result of RLOF is the same in both areas, this
fraction would be at most 0.017/0.21 = 8%, assuming that all W-R stars
in the SMC are formed by RLOF. This fixes the upper limit of the
fraction of O stars undergoing RLOF under the mentioned assumption.
Stellar winds produce fewer W-R stars at low Z, and only the binary
channel seems efficient in forming WR stars. As an example, in the
SMC, eight of the nine observed W-R stars may be binaries; five are
confirmed
(Moffat 1988,
Smith 1991a).
These binaries were likely formed by mass transfer
(De Greve et al 1988).
They are of type WNE,
which suggests that the binary channel may mainly lead to WNE
stars. Consistent with the SMC observations, the proportion of W-R
binaries has been found to be larger toward the anticenter in the Milky Way
(van der Hucht et al 1988).
The hypothesis that a small
fraction of the W-R stars is formed by RLOF also gives a better fit to
the observed behavior of the WNE/W-R and WNL/W-R ratios with Z
(Maeder & Meynet 1994).
We may also note that the average ages of WNL and WNE
stars are probably not the same;
Moffat et al (1991)
suggest that the
former are relatively younger than the latter; WNL stars are also more
luminous than WNE stars
(Conti 1988).
These facts are consistent with
the result (Section 4.5) that WNL stars mainly
originate from the most massive stars.
4.5.3 WC SUBTYPE STATISTICS
The distributions of WC and WO stars in galaxies exhibit a number
of distinct properties.
- It is well known that WC stars are relatively more numerous in
inner galactic regions (cf van der Hucht et al 1988, Conti & Vacca
1990). More specifically, the later WC subtypes - WC9 and WC8 - are
only found in inner galactic regions with higher Z, while outer
regions with lower Z contain WC stars of earlier subtypes, mainly
WC6-WC4. This is also true in the LMC, where only WC6-WC4 subtypes are
found, with very uniform properties
(Breysacher 1986,
Smith et al 1990,
Smith 1991b).
In more extreme low-Z dwarf galaxies, the rare WC
stars only belong to subtypes WC4 and WO. In M31 as in the Milky Way,
late WC stars (WCL) are found in inner galactic regions and early ones
(WCE) in outer regions
(Moffat & Shara 1987).
However, the metal-rich galaxy M31 contains no WC9 and WC8 stars
(Massey et al 1987a).
- The luminosity of earlier WC subtypes is lower than that for later
WC subtypes
(Lundstrom & Stenholm 1984,
van der Hucht et al 1988,
Conti 1988).
- Stars of a given WC subtype seem brighter in a galaxy with lower Z
as suggested by
Smith & Maeder (1991),
who point out that LMC WC4 stars are brighter than Galactic WC5-WC6 stars.
These various facts can be easily understood on the basis of recent
models and of the relation between WC subtypes and the (C+O)/He ratios
as shown by
Smith & Maeder (1991).
The entry points and lifetimes in
the WC9 to WO sequence are very dependent on M and Z. At high
Z and
high M, due to high mass loss the WC stage is entered very early
during the He burning phase, so that the surface (C+O)/He ratio is
very low, which implies a type WC9 or WC8. As evolution continues,
mass and luminosity decline and (C+O)/He decreases and thus the
sequence of types WC9 -> WO is described. The entry point in that
sequence occurs at lower L and earlier WC types for lower masses. At
lower Z, as in the LMC, the entry in the WC phase occurs at a later
stage of central He-burning, i.e. with higher O/C ratios
(Smith et al 1990)
and also with higher (C+O)/He ratios at the surface, which means
earlier WC types, typically WC5-WC4
(Smith & Maeder 1991).
Then, the
further evolutionary sequence described is short. This behavior also
explains the two above-mentioned points concerning the luminosity of
WC stars at different Z. That the luminosity for a WC subtype depends
on the initial Z may have consequences for the interpretation of WC
lines in integrated spectra of galaxies.
From W-R stars in clusters and in galaxies, some relationships
between subtypes can be understood
(van der Hucht et al 1988;
see also
Schild & Maeder 1984,
Moffat et al 1986,
Moffat 1988,
Schild et al 1991):
For galactocentric radius R < 8.5 kpc, we have WNL -> WCL; while
for R > 6.5 kpc, we find WNL -> WCE -> WO and WNE -> no WC stars.
These connections are supported by the model results
(Maeder 1991a).
The first connection is typical of high mass and high Z: A long WNL
phase, followed by a negligible WNE phase, emerges on the late and
luminous part of the WC sequence, typically at WC9 or WC8. The second
connection is typical of large masses with solar or lower metallicity,
while the third one corresponds to the lowest part of the mass range
able to form W-R stars.
We conclude this section by underlining that the observations and
understanding of W-R stars in nearby galaxies has brought the
clarification of many problems, which also have far-reaching
consequences for the injection of mass, momentum, and energy into the
interstellar medium
(Leitherer et al 1992a).
5. MASSIVE STARS IN STARBURSTS
5.1 Integrated Spectra of Galaxies
The spectra of galaxies are primarily those of the underlying stellar
population (absorption lines) with the addition of nebular emission
lines from the GH II and young starburst regions which are present if
recent star formation has occurred. We first consider how one might
infer the distribution of massive stars from the nebular line
analyses, and then discuss spectral synthesis of the stellar features.
5.1.1 NEBULAR LINE ANALYSES
The number of exciting stars of ionized hydrogen regions (NO*) can
readily be estimated from analysis of the emission line spectra
(e.g.
Kennicutt 1984,
Shields 1990).
One observes the spatially
integrated H flux (or the
H or radio
recombination measure),
accounts for the extinction (if necessary), and from simple
recombination theory infers the total number of Lyman continuum
photons (N Lyc) being emitted. This last step contains the nominal
nebular analysis assumptions of "Case B" - no dust, and ionization
bounded. The N Lyc is a direct measure of the number of exciting
stars. The total number released is a product of the numbers of hot
stars, the slope of the IMF, and the N Lyc at each spectral subtype.
or radio
recombination measure),
accounts for the extinction (if necessary), and from simple
recombination theory infers the total number of Lyman continuum
photons (N Lyc) being emitted. This last step contains the nominal
nebular analysis assumptions of "Case B" - no dust, and ionization
bounded. The N Lyc is a direct measure of the number of exciting
stars. The total number released is a product of the numbers of hot
stars, the slope of the IMF, and the N Lyc at each spectral subtype.
Vacca (1991, 1994)
has thoroughly reviewed and quantified this
procedure. He introduces the parameter
 0 as
defined in the equation
0 as
defined in the equation
| (3)
|
where N O7V is the number of "equivalent" O7V type stars, and
NO* is
the total number of O stars. The N O7V is simply the observed
N Lyc
divided by the number of Lyman continuum photons emitted by an O7V
star (1 × 1049 s-1). The
0 can
be calculated as a function of
, Teff,
and log g using the Kurucz stellar atmosphere models. Its value,
tabulated by Vacca, depends also on Mupper, and the
Mlower for Lyman
photon production - roughly the OB star boundary. This latter
parameter depends on the metal abundance Z via the stellar structure
models. This procedure makes the assumption that all O stars in H II
and GH II regions are main sequence; one can separately allow for
massive star evolution.
How accurately does this method work? It has been calibrated using
30 Dor in the LMC. Parker
(1991,
1993) and
Parker & Garmany (1993)
have made a detailed census of the hot star population in an 7' × 7'
area centered on R136. They find about 400 O stars. Vacca
(1991,
1994)
has analyzed the nebular spectrum of a trailed, 15-minute
spectrophotometric exposure of an 8' × 8' area scan centered on R136
(taken by M. Phillips). Using the Z value for the LMC and Parker's
value for (- 1.4), he finds
0 to be
0.44 and estimates that about
330 O stars are present, within 30% of the actual count (allowing for
the slight difference in areas)! This gives us confidence in the
procedure which has been applied to W-R and other emission line
galaxies by
Vacca & Conti (1992)
as we show below (Section 5.1.4).
5.1.2 EMISSION LINE GALAXIES - STARBURSTS
These galaxies with emission line spectra like those of H II regions
were noted by
Sargent & Searle (1970).
Given the often substantial
numbers of O-type stars found within these galaxies, they can be
understood to be examples of very young "starbursts." Using slit
spectroscopy, one may obtain the numbers of exciting stars by a
procedure similar to that outlined above for 30 Dor. For galaxies,
however, we might have additional complications if the slit width does
not include the entire region of interest, if the nebulosity is
density bounded, or if dust is present in sufficient quantities to
absorb a considerable fraction of the Lyman photons.
5.1.3 STARBURST MODELS
Several models for starburst populations have been produced to
simulate various properties of the galaxy spectra such as: the overall
stellar and nebular spectrum
(Leitherer 1990,
1991;
Leitherer et at 1992b;
Bernlohr 1992,
1993),
the strengths of the Si IV and CIV UV
wind features emitted by O stars
(Leitherer & Lamers 1991;
Mas-Hesse & Kunth 1991 a,b),
the widths of these UV lines
(Robert et al 1993),
the far-infrared and radio emission by the dust
(Mas-Hesse 1992,
Desert 1993),
the emission line ratios such as
4686 He II /
H or the
so-called W-R "bump" 4650
/ H
(Arnault et al 1989,
Meyner 1994b),
or other line ratios such as
4686He II /
4650CIII, which is sensitive to
the WN/WC ratio
(Kruger et al 1992).
The basic physical parameters for a starburst model are the star
formation rate - in particular the intensity and duration of the
burst, the age after its beginning, the IMF, and Z. The hope of
starburst models is to disentangle these various parameters. Let us
consider the didactical, but not unrealistic, case of an instantaneous
"burst" (formation over a time of up to 1 Myr - small with respect to
the massive star evolution time). In this case, an evolved W-R
population with its prominent emission features results from only a
part of the mass range of the potential W-R progenitors, while in the
case of a constant SFR the W-R population results from an equilibrium
mixture of the whole potential mass range. We may schematically
distinguish four different epochs in the evolution of a burst
according to recent models of massive stars and W-R stars
(Maeder & Meynet 1994):
- O-phase: For an age t
2 Myr, massive stars are in
their O-type
phase, giving rise to H II regions without W-R features.
- WNL phase: From t = 2 Myr to about 3 Myr, a large number of W-R
stars are present, nearly all of them are of WNL subtype.
- WC+WNL+WNE phase: After t = 3 Myr, the three subtypes may coexist
with fractions depending on the mass loss and/or Z. At solar
Z and
standard M, WC stars dominate, followed by WNL in the first part of
the period and by WNE stars in the second part. The higher the
and
Z, the more numerous are the WC stars. At lower Z and
, single star
evolution only leads to WNL stars and very few WC stars, but we may
also expect (Section 4.5.2) a fraction
of W-R stars of WNE type from RLOF binary evolution.
- O-phase (again): For t
 7 Myr, the W-R stars have
disappeared but
at up to 10 Myr there are still O-type stars to produce H II region
nebular emission line features. One way to distinguish between this
phase and the first O-phase might be to examine the equivalent width
of H nebula
emission; according to
Copetti et al (1986)
this parameter steadily decreases in value with age in model H II regions
(while the number of Lyc photons remains more or less steady, the
starlight at 4860 steadily
increases).
7 Myr, the W-R stars have
disappeared but
at up to 10 Myr there are still O-type stars to produce H II region
nebular emission line features. One way to distinguish between this
phase and the first O-phase might be to examine the equivalent width
of H nebula
emission; according to
Copetti et al (1986)
this parameter steadily decreases in value with age in model H II regions
(while the number of Lyc photons remains more or less steady, the
starlight at 4860 steadily
increases).
During these phases of a burst, the various ratios of W-R subtypes
to O stars are much larger than in the case of a constant SFR. As an
example, at solar Z the average WNL/O ratio is up to six times larger,
and the enhancement is even greater at lower Z. The reason is that the
duration of the W-R-rich phase is shorter at lower Z, meaning that
stars of only a narrow mass range become W-R stars, thus the contrast
between the cases of a burst and of constant SFR is much larger. For
bursts longer than 1 Myr, the situation is intermediate between the
instantaneous burst and constant SFR. We also notice that if an
observed H II region consists of a burst plus a region of lower but
constant SFR, we have for the 2 Myr after the burst a much lower W-R/O
ratio than for constant SFR, since at this time the W-R stars from the
burst have not yet appeared. On the whole, then, one must he cautious
before making quantitative inferences from number ratios alone.
5.1.4 WOLF-RAYET GALAXIES
These are a subset of emission line galaxies in which, in addition to
the nebular line spectrum, one observes broad emission at
4686 Å due
to the presence of Wolf-Rayet stars
(Conti 1991 a,b,
and references therein). The starburst phenomena illustrated by W-R galaxies
represent an extreme burst of star formation, in which hundreds to
thousands (or more) of massive stars have been born. There are
currently about 50 examples of such systems, most of which have been
discovered serendipitously. Many are Markarian or Zwicky galaxies and
exhibit disturbed morphologies which may be the result of interactions
or mergers. Examples of W-R galaxies may be found among Blue Compact
Dwarf Galaxies
(Sargent 1970),
isolated extragalactic H II regions
(Sargent & Searle 1970),
dwarf irregulars
(Dinerstein & Shields 1986),
"amorphous" galaxies
(Walsh & Roy 1987),
spiral galaxies containing knots or GH II regions
(Keel 1982),
recent galaxy mergers
(Rubin et al 1990),
or powerful IRAS galaxies
(Armus et al 1988).
The broad emission features are seen in contrast to the galaxy
stellar population continua. The dilution is such that the few hundred
Å equivalent width of an emission line of typical single W-R stars is
usually only a few Å in W-R galaxies. Examples of the spectra are
given in
Vacca & Conti (1992)
and Conti (1993).
Many of these galaxies
are metal-weak but this may be a selection effect, given that
starburst galaxies with more normal composition are likely to have a
brighter underlying stellar population, which could "drown out" the
W-R stars even if present.
Vacca & Conti (1992)
have recently analyzed optical spectra of ten
Wolf-Rayet and four other emission line galaxies. The nebular line
ratios indicate that the excitation is caused by stars. The strength
of the 4686 Å may be
used to infer the numbers of W-R stars present;
this uses a calibration of the line flux for single W-R stars in the
LMC, dividing that number into the measured line flux in the galaxy.
Typically, tens to hundreds of W-R stars are inferred to be present in
the starbursts. This procedure has been quantitatively checked by
using the area spectrophotometry of 30 Dor in which a broad
4686 He
II line is measured; the inferred numbers of W-R stars (20) are
similar to the census of
Moffat et al (1987).
The contribution of the
W-R stars to the observed N Lyc is subtracted from the observed value
for the galaxy, and the remainder is treated, as above, to determine
the number of O-type stars present. As it is not possible to derive
the slope of an IMF from this procedure, a
equivalent to that of 30
Dor was adopted for each galaxy; similarly the was assumed to be the
same (100 M).
With the usual assumptions that low mass stars have
formed along with the high mass ones, typical star formation rates
range from 2 × 10⁻² to 3
M per year
(the former is the value for 30 Dor).
Following the nebular line analysis taken for 30 Dor,
spectrophotometric studies have provided quantitative values of WNL/O
for W-R galaxies
(Vacca & Conti 1992,
Conti 1993).
Figure 3 shows the
comparison of these observations with continuous star formation and
newly constructed burst models
(Meynet 1994b;
see also
Maeder & Meynet 1994).
The observed WNL/O ratios in W-R galaxies are much higher than
the predictions of models with constant SFR, in agreement with
previous estimates
(Arnault et al 1989).
In Figure 3, burst models
with two different IMF slopes are shown which bracket the observations
nicely. Notice also the importance of Z to the predictions. The
observed values are, strictly speaking, the number of WN stars derived
from the strength of 4686
He II, but in most of these W-R galaxies,
there is little or no evidence of WC stars. The largest source of
uncertainty in the observed values is a possible mismatch between the
slit width (1.5") and the starburst (typically 2 to 3"). This
underestimates the number of O stars. Arbitrarily correcting for this
would lower the ratio by a factor 2 (see a more thorough discussion in
Conti 1993).
W-R binaries might enhance the production of W-R stars, but this
effect is believed to be small except at the lowest Z. While
Masegosa et al (1991)
suggest that SN contamination could affect the starburst
properties, particularly the "blue bump" at
4650, this may be
unimportant as no other effects (e.g. shocks) are seen in the nebular
spectra of W-R galaxies
(Vacca & Conti 1992).
Could there be different
values for in various
starburst regions? This possibility has been
raised in recent years
(Scalo 1989;
Mas-Hesse & Kunth 199l a,b;
Rieke 1991;
Joseph 1991;
Bernlohr 1993).
We have already noted (Section 2)
that in regions where the O star populations can be counted directly,
does appear to differ from
region to region by a small, but significant amount. Thus differences in
from starburst region to
starburst region are possible, but final conclusions are still uncertain.
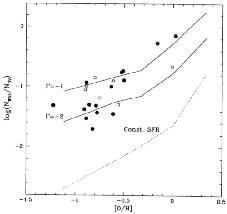
|
Figure 3. WNL/OV ratio in W-R galaxies, as
a function of the oxygen abundance [O/H]; data adapted from
Conti (1993);
stellar models from
Maeder & Meynet (1994).
(bullet) Galaxies of
Vacca & Conti (1992);
(square)
galaxies of W.D. Vacca (private communication); (triangle) 30 Dor (from
Vacca 1991).
The dotted line denotes the predictions for "continuous" star
formation; the solid lines are for values estimated for a "burst" (see
text). is the slope of the
IMF as defined in Section 2.2.
|
From Figure 3 we conclude that for W-R galaxies,
the W-R/O ratios
are well above the predictions for "continuous" star formation, and
nicely match the predictions of "burst" models. We infer that the
starbursts observed in W-R galaxies are typically going on for only a
relatively "brief" interval, typically
 106
yr. The energetics are
similar to 30 Doradus at the faint end to more than 100× larger. Are
these nearby starbursts paradigms for the first phases of massive star
evolution in very young galaxies?
106
yr. The energetics are
similar to 30 Doradus at the faint end to more than 100× larger. Are
these nearby starbursts paradigms for the first phases of massive star
evolution in very young galaxies?
Phillips & Conti (1992)
discovered evidence for WC9 stars in a GH II
region at the edge of the bar in the metal-rich (+0.5 dex) galaxy
NGC 1365. As their spectrum only covered the yellow region, there is
currently no information on the numbers of WN stars in their strong
starburst region. However, the presence of late type WC stars in a
strong Z environment nicely follows the models predictions
(Section 4.5.3).
5.1.5 SPECTRAL SYNTHESIS
Optical spectroscopy of most galaxies shows absorption line spectra
from an old evolved population of late type giant stars. In the W-R
galaxies studied by
Vacca & Conti (1992)
the optical absorption
spectra are those of late B and A type stars (narrow K line, upper
Balmer series in absorption, no other features). In these objects,
even though there are large numbers of very hot stars, the optical
spectra are dominated by other stars. However, in the UV the O (and
W-R) stars become the dominant contributors to the continua. In
emission line galaxies containing OB stars, P Cygni spectral features
at 1400 Si IV and
1550 C IV are seen; if W-R
stars are present, an
emission line at 1640 He
II is found.
In Figure 4 we show IUE spectra of a 3' ×
3' area of the GH II
region 30 Dor in the LMC and NGC 1741, a W-R galaxy. UV spectra such
as these can be used directly to estimate the numbers of hot stars
present by spectral synthesis techniques
(Leitherer et al 1992 a,b;
Robert et al 1993).
One can also ascertain the age of the starburst
and tell whether or not the formation of the massive stars has been
"continuous" or a "burst": In work in progress,
Vacca et at (1994)
have found a reasonable fit for the Si IV, C IV, and He II profiles
for ages between 1.5 and 2 Myr for the UV spectrum of 30 Dor
illustrated in Figure 4. For younger ages,
insufficient W-R stars have been produced to match the
1640 emission line; for
older ages, the Si
IV and C IV profiles begin to diverge from the observations. It is
also possible to estimate the number of O stars from the
extinction-corrected IUE continuum of 30 Dor, as the models predict
this quantity. The agreement with the census from Parker
(1991,
1993) and
Parker & Garmany (1993)
is good. Unfortunately, even the brightest
starburst galaxies are at the limit of IUE sensitivity. The 10"
× 20"
slit is typically larger than the starburst, so dilution of the
spectral signatures can be a problem. For the number counts, but not
for the age estimate, the UV extinction is critical and remains a
serious problem for more general application of this method.
5.2 Global Properties
5.2.1 FAR-INFRARED LUMINOSITIES
Radiation from dusty H II and GH II regions and galaxies in the
far-infrared appears to come from heating of the dust by their stellar
populations.
Devereux & Young (1991)
have argued that the far-infrared
(FIR) luminosities relate directly to the content of hot stars. They
have derived the FIR luminosity of 124 spiral galaxies from the IRAS
archives, which also have
H measurements. From the
individual IRAS
colors, they find that this dust is at a temperature of 30 to 40 K,
corresponding to heating by hot stars: they suggest that ambient
heating by stars of all types would be more like 15-20 K. In their
Figure 5 they show a correlation between the FIR
and the H emission
extending over two orders of magnitude. Part of the dispersion in
their relation could come from the differences in Teff
of the exciting
stars. Although Devereux & Young claim that one can infer the actual
Teff values, we don't believe that the modeling used
is adequate.
With considerable caution, one could perhaps use the FIR
luminosities of star forming regions to infer the total numbers of hot
stars present, but, absent other information, one cannot infer an IMF
slope () or an
Mupper. The FIR luminosities for normal spiral galaxies
range from 109 to 1011
L and,
according to
Devereux & Young (1991),
show no dependence on the Hubble type. This seems at odds with the
appearance of stellar images on direct plates. It would be nice to
confirm that the relationship between FIR luminosity and numbers of
hot exciting stars is as orderly as claimed. This might be
accomplished with identifications and counts of O type stars in
otherwise obscured GH II regions of our Galaxy, such as W51, through
classification K band spectroscopy
(Conti et al 1993).
5.2.2 IMAGING OF EMISSION LINE AND W-R GALAXIES
Optical CCD photometry of galaxies is a growth industry: Spectral
syntheses of the continua can give us valuable information on stellar
populations of all but the hottest and most massive stars. As we have
already noted, even in W-R galaxies, demonstrably the youngest
examples of starburst phenomena, the optical light comes primarily
from stars of type A. Thus in this wavelength region we are sampling
stars with lifetimes (not necessarily ages) of 50 million years or
more.
Conti & Vacca (1994)
have used the HST with FOC camera and the
2200
Å filter to obtain a UV image of the W-R galaxy He 2-10; the spatial
resolution with image restoration is
0.1". At this
wavelength one is
primarily sampling the OB stars, which have lifetimes of a few ×
106
to 107 yr. Given the presence of W-R stars in this galaxy,
the age is
closer to the lower of those numbers. This W-R galaxy has recently
been found by
Corbin et al (1993),
using deep CCD photometry, to be at
the center of a faint elliptical galaxy (3 kpc diameter)! There are
three starburst regions, the strongest (containing W-R stars) at the
center. Figure 5 is a reconstructed HST UV image
of the central
starburst in He 2-10. One can see ten individual knots of activity,
several just at the limit of resolution (10 pc in diameter), with
separations of about two to three times this number.
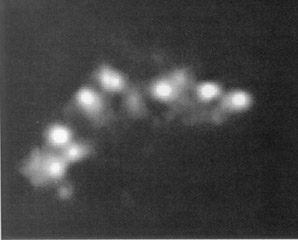
|
Figure 5. Reconstructed UV image of the
central starburst in He2-10 (from
Conti & Vacca 1994).
Nine individual starburst knots are readily
seen. The spatial scale across the figure is 3". corresponding to
125pc. The parent elliptical galaxy
(Corbin et al 1993)
is about 80"
in diameter, which is much larger than the scale of this starburst.
|
Conti & Vacca (1994)
estimate the average 2200
luminosities of the
individual starburst knots in He 2-10 to be
1038 erg
s-1 Å-1. This
corresponds to MV of -13.9, and mean total masses (assuming a normal
IMF) of a few × 105
M. These
masses are similar to those of globular
clusters, but in objects with ages of less than 10 Myr!
Whitmore et al (1993)
have recently identified about 40 blue objects in the galaxy
merger remnant NGC 7252 as being globular clusters of age about 500
Myr, on the basis of their optical colors and absolute
magnitudes. Their average MV are about one magnitude fainter than
those of He 2-10, which could be an evolution effect since the
starburst in NGC 7252 is older.
Conti & Vacca (1994)
have noted that at least a dozen other W-R
galaxies for which they have HST UV imaging also show multiple knots of
star forming activity. The luminosities of the knots in several of these
galaxies are substantially larger than those of He 2-10. Many of these
other galaxies are clear examples of merging or interacting galaxies
(the status of He 2-10 is not quite clear on this point). They thus
suggest that galaxy merger events may lead to star formation episodes
which produce knots of activity and eventual production of what we now
recognize as globular clusters. Of course, it is not certain that where
large numbers of massive stars have been produced, as in these starburst
regions, low mass stars are also born. In nearby galactic associations
we do consistently see a lower main sequence, but in highly energetic
star formation episodes, this might not always be the case.
6. CONCLUSIONS
Theoretical considerations and extensive modeling suggest that
substantial distinctions in the evolutionary history of massive stars
will arise because of the importance of mass loss and its strong
dependence on metallicity. We have reviewed and discussed the
properties, chemical abundances, and populations of individual OB
stars, supergiants, and Wolf-Rayet stars in various galaxy
environments and find order of magnitude differences from place to
place. These are understood to depend on Z, along with the IMF and
SFR, but not all these parameters are completely sorted out at the
present time. From detailed star counts in stellar associations
(Section 2), it does appear that there is no
simple dependence of the
IMF slope, , on Z,
but there may be differences from place to
place. There is no evidence that the Mupper limit
depends on Z; data
concerning potential differences in the Mlower limit
with location is
currently lacking. A major unresolved question is that concerning the
SFR: What does this parameter depend upon? Clearly one needs
sufficient molecular gas; future studies should address the
relationship between this parameter and the actual numbers of massive
stars in very quantitative terms.
We have lightly touched upon the connection between studies of
nearby massive star formation regions where stellar statistics may be
accomplished, and measurement and analyses of their integrated
properties. These objects, such as 30 Dor in the LMC and NGC 604 in
M33, can be used as "stepping stones" in our understanding of similar
phenomena in more distant galaxies. It will be important to improve
the "calibration" of these types of massive star groupings in various
galaxy environments to better understand those even more energetic and
less common starbursts found at larger distances.
In starbursts we are dealing nearly exclusively with integrated
spectral properties. For those containing massive stars of O and W-R
type we have an advantage that the lifetimes are less than 10 Myr, and
the formation time scales appear to be only 1 Myr. The modeling can be
thus simplified to that of a "burst." Probably SN will not have played
much of a role, as yet, in the energetics of the phenomena we are
observing; the excitation of the gas will be primarily due to stars.
Multiwavelength studies of many galaxies have already been made but
there has been little quantitative integration of all these data for
the same galaxies and the same starbursts. In addition to the
inferences concerning hot stars, one would like to know the cool star
population, and the quantity of neutral and molecular gas. This
requires observations at IR wavelengths and in the sub-mm and cm
regimes. One certain caution is that of aperture; it is critically
important that these are matched, independent of the wavelengths, so
that the same volume elements are being examined in each case. Even
more significant is the probability that as one goes to shorter and
shorter wavelengths, differential internal galactic extinction might
necessarily shield from our view the "back side" of a starburst
episode.
With our new-found knowledge of the properties and evolution of
massive stars, we now can begin to study and understand the
appearances of ever more distant galaxies, and one would hope, to
delineate their past history. "In the beginning" there were
undoubtedly many massive stars in newly forming galaxies. Our improved
comprehension of newly born local massive stars can help clarify our
knowledge of some of the earliest stages in the evolution of our
Universe.
ACKNOWLEDGMENTS
The authors are grateful to Lorraine Volsky and the JILA publications
office for editorial assistance. PSC appreciates continuous support by
the National Science Foundation. AM acknowledges support of the Ponds
National Suisse de la Recherche Scientifique.
REFERENCES
Abbott, D.C.
1982. Ap. J. 259:282-301
Abbott, D.C., Bieging, J.H., Churchwell, E.,
Torrees, A.V.
1986 Ap. J. 303: 239-61
Abbott, D.C., Conti, P.S.
1987. Annu. Rev. Astron. Astrophys. 25: 113-50
Alongi, M., Bertelli, G., Bressan, A., Chiosi, C.,
Fagotto, F., et al.
1993. Astron. Astrophys. Suppl, 97: 851-71
Appenzeller, I. 1980. In
Star Formation, 10th Saas-Fee Course, ed A.
Maeder, L. Martinet, pp. 3-73. Geneva: Geneva Obs.
Appenzeller, I.
1989. See Davidson et al 1989, pp. 195-204
Appenzeller, I., Wolf, B. 1981. In
The Most Massive Stars, ed. S.
d'Odorico, pp. 131-39. Garching: ESO Workshop
Armandroff, T.E., Massey, P.
1985. Ap. J. 291: 685-92
Armandroff, T.E., Massey, P.
1991. Astron. J. 102: 927-50
Armus, L., Heckman, T., Miley, G.
1988. Ap. J. Lett. 326: 45-49
Arnault, P., Kunth, D., Schild, H.
1989. Astron. Astrophys. 224: 73-85
Arnett, D.
1991. Ap. J. 383: 295-307
Azzopardi, M., Breysacher, J.
1979. Astron. Astrophys. 75: 243-46
Azzopardi, M., Breysacher, J.
1985. Astron. Astrophys. 149: 213-16
Azzopardi M, Lequeux J, Moeder A.
1998. Astron. Astrophys. 189:34-38
Bandiera, R., Turolla, R.
1990. Astron. Astrophys. 231: 85-88
Baraffe, I., El Eid, M.F.
1991. Astron. Astrophys. 245: 548-60
Barbuy, B, Medeiros, J.R., Macdot, A.
1992. Int. Symp. on Nuclear
Astrophysics, Karlsruhe, ed. F. Kappeler, K. Wisshack, pp. 35-40.
Bristol and Philadelphia: Inst. Phys.
Barbuy, B., Spite, M., Spite, F., Milone, A.
1991. Astron. Astrophys.
247: 15-19
Barlow, M.J., Hummer, D.G.
1982. See de Loore & A.J. Willis 1982,
pp. 387-92
Barlow, M.J., Roche, P.F., Aitken, D.K.
1988. M.N.R.A.S. 232: 821-34
Barlow, M.J., Smith, L.J., Willis, A.J.
1981. M.N.R.A.S. 196: 101-10
Baschek, H., Schol, M., Wchrse, R.
1991. Astron. Astrophys. 246: 374-82
Beech, M., Mitalas, R.
1992. Astron. Astrophys. 262: 483-86
Bernlohr, K.
1992. Astron. Astrophys. 263: 54-68
Bernlohr, K.
1993. Astron. Astrophys. 268: 25-34
Bertelli, G., Chiosi, C. 1981. In
The Most Massive Stars, ed. S.
d'Odorico, D. Baade, K. Kjar, pp. 211-13. Garching: ESO Work Shop
Bertelli, G., Chiosi, C.
1982. See de Loore & Willis 1982, pp. 359-63
Bisnovatyi-Kogan, G.S., Nadyozhin, D.K.
1972. Astrophys. Space Sci. 15: 353-74
Blaha, C., Humphreys, R.M.
1989. Astron. J. 98: 1598-608
Blecha, A., Schaller, G., Maeder, A.
1992. Nature 360: 320-21
Blomme, R., Vanbeveren, D., Van Rensbergen, W.
1991. Astron. Astrophys. 241: 479-87
Bohannan, B., Abbott, D.C., Voels, S.A., Hummer, D.G.
1986. Ap. J. 308: 728-35
Bohannan, B., Voels, S.A., Hummer, D.G., Abbott,
D.C.
1990. Ap. J. 365: 729-37
Bolton, C.T., Rogers, G.L.
1978. Ap. J. 222: 234-45
Boyarchuk, A.A., Gubeny, I., Kubat, I., Lyubimkov,
L.S., Sakhibullin, N.A.
1988. Astrofizika 28: 197-202
Bressan, A., Fagotto, F., Bertelli, G., Chiosi, C.
1993. Astron. Astrophys. Suppl. 100: 647-64
Breysacher, J.
1981. Astron. Astrophys. Suppl. 43: 203-7
Breysacher, J.
1986. Astron. Astrophys. 160: 185-94
Brocato, E., Buonanno, R., Castellani, V., Walker,
A.R.
1989. Ap. J. Suppl. 71: 25-46
Brocato, E., Castellani, V.
1993. Ap. J. 410: 99-109
Brunish, W.M., Gallagher, J.S., Truran, J.W.
1986. Astron. J. 91:
598-601
Brunish, W.M., Truran, J.W.
1982a. Ap. J. 256: 247-58
Brunish, W.M., Truran, J.W.
1982b. Ap. J. Suppl. 49: 447-68
Cananzi, K.
1992. Astron. Astrophys. 259: 17-24
Caputo, F., Viotti, R.
1970. Astron. Astrophys. 7: 266-78
Carney, B.W., Janes, K.A., Flower, P.J.
1985. Astron. J. 90: 1196-210
Cassinelli, J.P. 1991. See
van der Hucht & Hidayat, 1991. pp 289-307
Charbonnel, C, Meynet, G., Maeder, A., Schaller, G.,
Schaerer, D.
1993. Astron. Astrophys. Suppl. 101: 415-19
Chin, C.W., Stothers, R.B.
1990. Ap. J. Suppl. 73: 821-40
Chiosi, C., Bertelli, G., Bressan, A.
1992a. Annu. Rev. Astron. Astrophys. 30: 235-85
Chiosi, C., Bertelli, G., Bressan, A. 1992b. In
Instabilities in Evolved
Super- and Hypergiants, ed. C. de Jager, H. Nieuwenhuijzen, pp. 145-55.
Amsterdam: North-Holland
Chiosi, C., Maeder, A.
1986. Annu. Rev. Astron. Astrophys. 24: 329-75
Chiosi, C., Nasi, E., Sreenivasan, S.R.
1978. Astron. Astrophys. 63:
103-24
Cohen, R.I. 1992. In
Instabilities in Evolved Super- and Hypergiants,
ed. C. de Jager, H. Nieuwenhuijzen, pp. 55-59. Amsterdam: North-Holland
Conti, P.S.
1976. Mem. Soc. R. Sci. Liege 9: 193-212
Conti, P.S. 1984. In
Observational Tests of the Stellar Evolution
Theory, IAU Symp. 105, ed. A. Maeder, A. Renzini, pp. 233-54.
Dordrecht: Reidel
Conti, P.S. 1988. In
O-stars and WR stars, NASA SP-497, ed. P.S. Conti,
A.B. Underhill, pp. 81-269. Washington: NASA
Conti, P.S.
1991a. Ap. J. 377: 115-25
Conti, P.S. 1991b. See
Leitherer et al 1991, pp. 21-43
Conti, P.S. 1993.
In Massive Stars: Their lives in the Interstellar
Medium, ed. J.P. Cassinelli, E.B. Churchwell. ASP Conf. Ser. 35: 449-62
Conti, P.S.
1994. In Space Sci. Rev. In press
Conti, P.S., Block, D.L., Geballe, T.R., Hanson, M.M.
1993. Ap. J. Lett. 406: 21-23
Conti, P.S., Garmany, C.D., de Loore, C., Vanbeveren, D.
1983b. Ap. J. 274: 302-12
Conti, P.S., Leep, E.M., Perry, D.N.
1983a. Ap. J. 268: 228-45
Conti, P.S., Massey, P.
1981. Ap. J. 249: 471-80
Conti, P.S., Massey, P.
1989. Ap. J. 337: 251-71
Conti, P.S., Underhill, A.B., eds. 1988.
O Stars and WR Stars, NASA
SP-497. Washington, DC: NASA. 428 pp.
Conti, P.S., Vacca, W.D.
1990. Astron. J. 100: 431-44
Conti, P.S., Vacca, W.D.
1994. Ap. J. Lett. In press
Copetti, M.V.F., Pastoriza, M.G., Dottori, H.A.
1986. Astron.
Astrophys. 156: 111-20
Corbin, M.R., Korista, K.T., Vacca, W.D.
1993. Astron. J. 105: 1313-17
Crowther, P.A., Smith, L.J., Willis, A.J. 1991. See
van der Hucht & Hidayat, pp. 97
Davidson, K.
1987. Ap. J. 317: 760-64
Davidson, K. 1989. See
Davidson et al 1989, pp. 101-8
Davidson, K., Dufour, R.J., Walborn, N.R., Gull,
T.R.
1986. Ap. J. 305: 867-79
Davidson, K., Humphreys, R.M., Haijan, A., Terzian, Y.
1993. Ap. J. 411: 336-41
Davidson, K., Kinman, R.D.
1982. Publ. Astron. Soc. Pac. 94: 634-39
Davidson, K., Moffatt, A.J.F., Lamers, H.J.G.L.M,
eds. 1989. Physics of
Luminous Blue Variables. Dordrecht: Kluwer
de Freitas Pacheco, J.A., Costa, R.D.D., de Araujo,
F.X., Petrini, D.
1993. M.N.R.A.S. 260: 401-7
de Freitas Pacheco, J.A., Machado, M.A.
1988. Astron. J. 96: 365-70
De Greve, J.P. 1991. See
van der Hucht & Hidayat. 1991, p. 213
De Greve, J.P., Hellings, P., van den Heuvel, E.P.J.
1988. Astron. Astrophys. 189: 74-80
de Groot, M.J.H., Lamers, H.
1992. Nature 355: 422-23
de Jager, C. 1992. In
Instabilities in Evolved Super- and Hypergiants,
ed, C. de Jager, H. Nieuwenhuijzen, pp. 98-103. Amsterdam North-Holland
de Jager, C., Nieuwenhuijzen, H, eds. 1992.
Instabilities in Evolved
Super- and Hypergiants. Amsterdam: North-Holland
de Jager, C., Nieuwenhuijzen, H., van der Hucht,
K.A.
1988. Astron. Astrophys. Suppl. 72: 259-89
de Loore, C. 1982, See
de Loore & Willis. 1982, pp. 343-58
de Loore, C., Hellings, P., Lamers,
H.J.G.L.M. 1982. See
de Loore & Willis, pp. 53-56
de Loore, C., Vanbeveren, D.
1994. Astron. Suppl. 103: 67-82
de Loore, C., Willis, A.J. eds. 1982.
Wolf-Rayet Stars: Observation,
Physics, Evolution, IAU Symp. 99. Dordrecht: Reidel
Denissenkov, P.A.
1988. Sov. Astron. Lett. 14: 435-37
Denissenkov, P.A.
1989. Astrofizika 31: 293-308
Denissenkov, P.A., Ivanov, W.
1987. Sov. Astron. Lett. 13: 214-16
Desert, F.X. 1993. In
First Light in the Universe, ed, B. Rocca -
Volmerange, B. Guideroni, M. Dennefeld, J. Tran Thanh Van, pp. 193-98.
Gif-sur-Yvette: Editions Frontieres
Devereux, N.A., Young, J.S.
1991. Ap. J. 371: 515-24
Dinnerstein, H.L., Shields, G.A.
1986. Ap. J. 311: 45-57
Divan, L., Burnichon-Prevot, M.L. 1988. In
O-stars and WR Stars, NASA
SP-497, ed. P.S. Conti, A.R. Underhill, pp. 1-78. Washington: NASA
Doom, C., de Greve, J.P., de Loore, C.
1986. Ap. J. 303: 136-45
Dos Santos, L.C., Jatenco-Pereira, V., Opher, R.
1993. Ap. J. 410: 732-39
Drissen, L., Moffat, A.F.J., Shara, M.M.
1990. Ap. J. 364: 496-512
Drissen, L., Moffat, A.F.J., Shara, M.M. 1991, See
van der Hucht & Hidayat, pp. 595-600
Dufton, P.L., Lennon, D.J.
1989. Astron. Astrophys. 211: 397-401
Eenens, P.R.J., Williams, P.M.
1992. M.N.R.A.S. 255: 227-36
El Eid, M.F., Hartmann, D.H.
1993. Ap. J. 404: 271-75
Elias, J.H., Frogel, J.A., Humphreys, R.M.
1985. Ap. J. Suppl. 57: 91-131
Esteban, C., Smith, L.J., Vilchez, J.M., Clegg,
R.E.S.
1993. Astron. Astrophys. 272: 299-320
Esteban, C., Vilchez, J.M.
1991. See van der Hucht & Hidayat. 1991, p. 422
Esteban, C., Vilchez, J.M.
1992. Ap. J. 390: 536-40
Esteban, C., Vilchez, J.M., Smith, L.J., Clegg,
R.E.S.
1992. Astron. Astrophys. 259: 629-48
Firmani, C. 1982. See
de Loore & Willis, 1982, pp. 499-513
Fitzpatrick, E.L.
1991. Publ. Astron. Soc. Pac. 103: 1123-48
Fitzpatrick, E.L., Bohannan, B.
1993. Ap. J. 404: 734-38
Fitzpatrick, E.L., Garmany, C.D.
1990. Ap. J. 363: 119-30
Fransson, C., Cassetella, A., Gilmozzi, R.,
Kirshner, R.P., Panagia, N., et al.
1989. Ap. J. 336: 429-41
Freedman, W.
1985. Astron. J. 90: 2499-507
Garmany, C.D., Conti, P.S. 1982.
Catalogue of Galactic O-type Stars.
Greenbelt, M.d.: Goddard Space Flight Center, Astron. Data Center
Garmany, C.D., Conti, P.S., Chiosi, C.
1982. Ap. J. 263: 777-90
Garmany, C.D., Conti, P.S., Massey, P.
1980. Ap. J. 242: 1063-76
Garmany, C.D., Massey, P., Parker, J.W.
1993, Astron. J. 106: 1471-83
Gies, D.R., Lambert, D.L.
1992. Ap. J. 387: 673-700
Glatzel, W., Kiriakidis, M., Fricke, K.J.
1993. M.N.R.A.S. 262: L7-11
Gochermann, J.
1994. Space Sci. Rev. In press
Grevesse, N. 1991. In
Evolution of Stars: The Photospheric Abundance
Connection, IAU Symp. No. 145, ed. G. Michaud, A. Tutukov, pp. 63-69,
Dordrecht: Kluwer
Groenewegen, M.A.T., Lamers, H.J.G.L.M., Pauldrach, A.W.A.
1989. Astron. Astrophys. 221: 78-80
Grossman, S.A., Narayan, R., Arnett, D.
1993. Ap. J. 407: 284-315
Hamann, W.R., Dunnebeil, G., Koesterke, L., Schmutz,
W., Wessolowski, U.
1991. Astron. Astrophys. 249: 443-54
Hamann, W.R., Koesterke, L., Wessolowski, U.
1993. Astron. Astrophys. 274: 397-414
Harris, M.J., Lambert, D.L.
1984. Ap. J. 281: 739-45
Heap, S.R., Altner, B., Ebbets, D., Hubeny, I.,
Hutchings, J.B., et al.
1991. Ap. J. Lett. 377: 29-32
Herrero, A., Kudritzki, R.P., Vilchez, J.M., Kunze,
D., Butler, K., Haser, S.
1992. Astron. Astrophys. 261: 209-34
Heydari-Malayeri, M., Hutsemekers, D.
1991. Astron. Astrophys. 243: 401-4
Hill, R.J., Madore, B.F., Freedman, W.L.
1994. Ap. J. In press
Hillenbrand, L.A., Massey, P., Strom, S.E., Merrill,
K.M.
1993. Astron. J. 106: 1906-46
Hillier, D.J.
1987a. Ap. J. Suppl. 63: 947-64
Hillier, D.J.
1987b. Ap. J. Suppl. 63: 965-81
Hillier, D.J.
1988. Ap. J. 327: 822-39
Hillier, D.J.
1989. Ap. J. 347: 392-408
Hoflich, P. Langer, N., Duschinger, M.
1993. Astron. Astrophys. 275:
L25-28
Howarth, I.D., Prinja, R.K.
1989. Ap. J. Suppl. 69: 527-92
Howarth, I.D., Schmutz, W.
1992. Astron. Astrophys. 261: 503-22
Humphreys, R.M.
1979. Ap. J. 231: 384-87
Humphreys, R.M.
1983a. Ap. J. 265: 176-93
Humphreys, R.M.
1983b. Ap. J. 269: 335-51
Humphreys, R.M. 1989. See
Davidson et al 1989, pp. 3-14
Humphreys, R.M. 1991. See
Leitherer et al 1991, pp. 45-47
Humphreys, R.M. 1992. See
de Jager & Nieuwenhuijzen, 1992, pp. 13-17
Humphreys, R.M., Davidson, K.
1979. Ap. J. 232: 409-20
Humphreys, R.M., McElroy, D.B.
1984. Ap. J. 284: 565-77
Humphreys, R.M., Nichols, M., Massey, P.
1985. Astron. J. 90: 101-8
Humphreys, R.M., Pennington, R.L., Jones, T.J., Ghigo, F.D.
1988. Astron. J. 96: 1884-907
Humphreys, R.M., Sandage, A.R.
1980. Ap. J. 44: 319-81
Hutsemekers, D.
1994. Astron. Astrophys. 281: L81-84
Iben, I.
1974. Annu. Rev. Astron. Astrophys. 12: 215-77
Iben, I., Renzini, A.
1983. Annu. Rev. Astron. Astrophys. 21: 271-342
Iglesias, C.A., Rogers, F.J.
1993. Ap. J. 412: 752-60
Iglesias, C.A., Rogers, F.J., Wilson, B.G.
1992. Ap. J. 397: 717-28
Jones, T.J., Humphreys, R.M., Gehrz, R.D., Lawrence,
G.F., Zickgraf, F.J., et al.
1993. Ap. J. 411: 323-35
Joseph, R. 1991. See
Leitherer. et al 1991, pp. 259-70
Jura, M., Kleinmann, S.G.
1990. Ap. J. Suppl. 73: 769-80
Kato, M., Iben, I.
1992. Ap. J. 394: 305-12
Keel, W.C.
1982. Publ. Astron. Soc. Pac. 94: 765-68
Kennicutt, R.C.Jr.
1984. Ap. J. 287: 116-30
Kingsburgh, R.L., Barlow, M.J. 1991. See
van der Hucht & Hidayat, p. 101
Kingsburgh, R.L., Barlow, M.J., Storey, P.J.
1994. Astrophys. Space Rev.
In press
Kippenhahn, R., Weigert, A.
1990. Stellar Struture and Evolution.
Berlin, Heildberg: Springer-Verlag
Kirbiyik, H.
1987. Astrophys. Space Sci. 136: 321-30
Kiriakidis, M., Fricke, K.J., Glatzel, W.
1993. M.N.R.A.S. 264: 50-62
Koesterke, L., Hamann, W.R., Wessolowski, U.
1992. Astron. Astrophys. 261: 535-43
Kruger, H., Fritze, v. Alvensleben, U., Fricke,
K.J., Loose, H-H.
1992. Astron. Astrophys. 259: L73-76
Kudritzki, R.R. 1988. In
Radiation in Moving Gaseous Media, 18th
Saas-Fee Course, pp. 3-192. Geneva: Geneva Obs.
Kudritzki, R.P.
1994. Space Sci. Rev. In press
Kudritzki, R.P., Gabler, R., Kunze, D., Pauldrach,
A.W.A., Publ. 1990.
See Leitherer et al 1991, pp. 59-96
Kudritzki, R.P., Hummer, D.G.
1990. Annu. Rev. Astron. Astrophys. 28: 303-45
Kudritzki, R.P., Hummer, D.G., Pauldrach, A.W.A.,
Puls, J., Najarro, F., Imhoff, J.
1992. Astron. Astrophys. 257: 655-62
Kudritzki, R.P., Pauldrach, A., Puls, J.
1987. Astron. Astrophys. 173:
293-98
Kudritzki, R.P., Pauldrach, A., Puls, J., Voels,
S.R. 1991. In The
Magellanic Clouds, IAU Symp. 148, ed. R. Haynes and D. Milne, pp.
279-84. Dordrecht: Kluwer
Kunth, D., Sargent, W.L.W.
1981. Astron. Astrophys. 101: L5-8
Lafon, J.P.J., Berruyer, N.
1991. Astron. Astrophys. Rev. 2: 249-89
Lambert, D.L., 1992. See
de Jager & Nienwenhuijzen 1992, pp. 156-70
Lambert, D.L., Brown, J.A., Hinkle, K.H., Johnson,
H.R.
1984. Ap. J. 284: 223-37
Lamers, H.J.G.L.M. 1989. See
Davidson et al 1989, pp. 135-47
Lamers, H.J.G.L.M., de Groot, M.J.H.
1992. Astron. Astrophys. 257: 153-62
Lamers, H.J.G.L.M., Fitzpatrick, E.L.
1988. Ap. J. 324: 279-87
Lamers, H.J.G.L.M., Leitherer, C.
1993. Ap. J. 412: 771-91
Lamers, H.J.G.L.M., Maeder, A., Schmutz, W.,
Cassinelli, J.P.
1991. Ap. J. 368: 538-44
Lamers, H.J.G.L.M., Noordhoek, R. 1993. In
Massive Stars and Their Lives
in the Interstellar Medium, ed. J.P. Cassinelli, E. Churchwell, ASP
Conf. Ser. 35: 517-21
Langer, N.
1987. Astron. Astrophys. 171: L1-4
Langer, N.
1989a. Astron. Astrophys. 210: 93-113
Langer, N.
1989b. Astron. Astrophys. 220: 135-43
Langer, N.
1991a, Astron. Astrophys. 243: 155-59
Langer, N.
1991b. Astron. Astrophys. 248: 531-37
Langer, N.
1991c. Astron. Astrophys. 252: 669-88
Langer, N.
1992. Astron. Astrophys. 265: L17-20
Langer, N. 1993. In Inside the Stars,
IAU Colloq. 137, ed, W. Weiss, A.
Baglin. ASP Conf. Ser. 40: 426-36
Langer, N., El Eid, M.F., Baraffe, I.
1989. Astron. Astrophys. 224: L17-20
Langer, N., El Eid, M.F., Fricke, K.J.
1985. Astron. Astrophys. 145: 179-91
Langer, N., El Eid, M.F., Fricke, K.J. 1986. In
Nucleosynthesis and its
Implication on Nuclear and Particle Physics, 20th Moriond Astrophys.
Meet., ed. J. Audouze, N. Mathieu, pp. 177-87. Dordrecht: Reidel
Lattanzio, J.C., Vallenari, A., Bertelli, G., Chiosi, C.
1991. Astron, Astrophys. 250: 340-50
Leitherer, C.
1990. Ap. J. Suppl. 73: 1-20
Leitherer, C. 1991. See
Leitherer et al 1991, pp. 1-19
Leitherer, C., Gruenwald, R., Schmutz, W. 1992b. In
Physics of Nearby
Galaxies, ed. T.X. Thuan et al, pp. 257-264. Gif-sur-Yvette: Editions
Frontieres
Leitherer, C., Lamers, H.J.G.L.M.
1991. Ap. J. 373: 89-99
Leitherer, C., Langer, N. 1991. In
The Magellanic Clouds, IAU Symp. 148,
ed. R.F. Hanes, D.K. Milne, pp. 480-82. Dordrecht: Kluwer
Leitherer, C., Robert, C., Drissen, L.
1992a. Ap. J. 401: 596-617
Leitherer, C., Wolborn, N.R., Heckman, T.M., Norman,
C.A., eds. 1991.
Massive Stars in Starbursts. Cambridge: Cambridge Univ. Press
Lennon, D.J., Kudritzki, R.P., Becker, S.T., Butler,
K., Eber, F., et al.
1991. Astron. Astrophys. 252: 498-507
Lequeux, J. 1986. In
Spectral Evolution of Galaxies, ed. C. Chiosi, A.
Renzini, pp. 57-73. Dordrecht: Reidel
Luck, R.E., Lambert, D.L.
1985. Ap. J. 298: 782-802
Lucy, L., Abbott, D.C.
1993. Ap. J. 405: 738-46
Lundstrom, I., Stenholm, B.
1984. Astron. Astrophys. Suppl. 58: 163-92
Maeder, A.
1980. Astron. Astrophys. 92: 101-10
Maeder, A.
1981. Astron. Astrophys. 102: 401-10
Maeder, A.
1983. Astron. Astrophys. 120: 113-29
Maeder, A.
1985. Astron. Astrophys. 147: 300-8
Maeder, A.
1987a. Astron. Astrophys. 173: 247-62
Maeder, A.
1987b. Astron. Astrophys. 178: 159-69
Maeder, A.
1989. See Davidson et al 1989, pp. 15-26
Maeder, A.
1990. Astron. Astrophys. Suppl. 84: 139-77
Maeder, A.
1991a. Astron. Astrophys. 242: 93-111
Maeder, A. 1991b. In
Evolution of Stars: The Photospheric Abundance
Connection, IAU Symp. 145, ed. G. Michaud, A. Tutukov, pp. 221-33.
Dordrecht: Kluwer
Maeder, A.
1991c. Q.J.R. Astron. Soc. 32: 217-23
Maeder, A.
1992a. Astron. Astrophys. 264: 105-20
Maeder, A. 1992b. See
de Jager & Nieuwenhuijzen 1992, pp. 138-44
Maeder, A., Lequeux, J., Azzopardi, M.
1980. Astron. Astrophys. 90: L17-20
Maeder, A., Meynet, G.
1989. Astron. Astrophys. 210: 155-73
Maeder, A., Meynet, G.
1994. Astron. Astrophys. In press
Masegosa, J., Moles, M., del Olmo, A.
1991. Astron. Astrophys. 224: 273-79
Mas-Hesse, J.M.
1992. Astron. Astrophys. 253: 49-56
Mas-Hesse, J.M., Kunth, D.
1991a. Astron. Astrophys. Suppl. 88: 399-450
Mas-Hesse, J.M., Kunth, D.
1991b. See van der Hucht & Hidayat. 1991, pp. 613-18
Massey, P.
1981. Ap. J. 246: 153-60
Massey, P.
1985. Publ. Astron. Soc. Pac. 97: 5-24
Massey, P., Armandroff, T.E. 1991. See
van der Hucht & Hidayat. 1991, pp. 575-86
Massey, P., Armandroff, T.E., Conti, P.S.
1986. Astron. J. 92: 1303-33
Massey, P., Armandroff, T.E., Conti, P.S.
1992. Astron. J. 103: 1159-65
Massey, P., Conti, P.S.
1983. Ap. J. 273: 576-89
Massey, P., Conti, P.S., Armandroff, T.E.
1987a. Astron. J. 94: 1538-55
Massey, P., Conti, P.S., Moffat, A.F.J., Shara, M.M.
1987b. Publ. Astron. Soc. Pac. 99: 816-31
Massey, P., Garmany, C.D., Silkey, M., Degioia-Eastwood.
1989a. Astron. J. 97: 107-30
Massey, P., Johnson, J.
1993. Astron. J. 105: 980-1001
Massey, P., Parker, J.W., Garmany, C.D.
1989b. Astron. J. 98: 1305-34
Massey, P., Thompson, A.B.
1991. Astron. J. 101: 1408-28
Mateo, M.
1988. Astron. J. 331: 261-93
McLeod, K.K., Rieke, G.H., Rieke, M.J., Kelley, D.M.
1993. Ap. J. 412: 99-110
Meylan, G., Maeder, A.
1982. Astron. Astrophys. 108: 148-56
Meylan, G., Maeder, A.
1983. Astron. Astrophys. 124: 84-88
Meynet, G.
1994a. Ap. J. Suppl. In press
Meynet, G.
1994b. Astron. Astrophys. In press
Meynet, G., Maeder, A., Schaller, G., Schaerer, D.,
Charbonnel, C.
1994. Astron. Astrophys. Suppl. 103: 97-105
Meynet, G., Mermilliod, J.C., Maeder, A.
1993. Astron. Astrophys. Suppl. 98: 477-504
Mihalas, D.
1969. Ap. J. 156: L155-58
Moffat, A.F.J.
1988. Ap. J. 330: 766-75
Moffat, A.F.J., Niemela, V.S., Marraco, H.G.
1990. Ap. J. 348: 232-41
Moffat, A.F.J., Niemela, V.S., Phillips, M.M., Chu,
Y.H., Seggewiss, W.
1987. Ap. J. 312: 612-25
Moffat, A.F.J., Shara, M.M.
1983. Ap. J. 273: 544-61
Moffat, A.F.J., Shara, M.M.
1987. Ap. J. 320: 266-82
Moffat, A.F.J., Shara, M.M., Potter, M.
1991. Astron. J. 102: 642-53
Moffat, A.F.J., Vogt, N., Paquin, G., Lamontagne,
R., Barrera, L.H.
1986. Astron. J. 91: 1386-91
Morgan, D.H., Good, A.R.
1985. M.N.R.A.S. 216: 459-465
Morgan, D.H., Vassiliadis, E., Dopita, M.A,
1991. M.N.R.A.S. 251:
51p-53p
Napiwotzki, R., Rieschick, A., Blocker, T.,
Schonberner, D., Wenske, V. 1993. In
Inside the Stars, IAU Colloq. 137, ed. W. Weiss, A. Baglin.
ASP Conf. Ser. 40: 461-63
Nasi, E., Forieri, C.
1990. Astrophys, Space Sci. 166: 229-58
Nieuwenhuijzen, H., de Jager, C.
1988. Astron. Astrophys. 203: 355-60
Nieuwenhuijzen, H., de Jager, C.
1990. Astron. Astrophys. 231: 134-36
Noels, A., Magain, E.
1984. Astron. Astrophys. 139: 341-43
Noels, A., Maserel, C.
1982. Astron. Astrophys. 105: 293-95
Nugis, T. 1991. See
van der Hucht & Hidayat. 1991, pp. 75-80
Osmer, P.S.
1972. Ap. J. Suppl. 24: 255-82
Owocki, S.P., Castor, J., Rybicki, G.B.
1988. Ap. J. 335: 914-30
Pagel, B.E.J., Simonson, E.A., Terlevich, R.J.,
Edmunds, M.G.
1992. M.N.R.A.S. 255: 325-45
Palla, F., Stahler, S.W., Parigi, C. 1993. In
Inside the Stars, IAU
Colloq. 137, ed. W. Weiss, A. Baglin, ASP Conf. Ser. 40: 437-39
Parker, J.W. 1991.
30 Doradus in the Large Magellanic Cloud: The
Stellar Content and Initial Mass Function. Ph.D thesis. Univ. Colo.,
Boulder
Parker, J.W.
1993. Astron. J. 106: 560-77
Parker, J.W., Garmany, C.D.
1993. Astron. J. 106: 1471-83
Parker, J.W., Garmany, C.D., Massey, P., Walborn, N.R.
1992. Astron. J. 103: 1205-23
Parker, R.A.R.
1978. Ap. J. 224: 873-84
Pauldrach, A., Kudritzki, R.P., Puls, J., Butler,
K., Hunsinger, J.
1994. Astron. Astrophys. In press
Pauldrach, A., Puls, J., Kudritzki, R.P.
1986. Astron. Astrophys. 164:
86-100
Pauldrach, A., Puls, J., Kudritzki, R.P. 1988. In
O-Stars and WR Stars,
NASA SP-497, ed. P.S. Conti, A.B. Underhill, pp. 173-99. Washington:
NASA
Penny, L.R., Gies, D.R., Hartkopf, W.I., Mason,
B.D., Turner, N.H.
1993. Publ. Astron. Soc. Pac. 105: 588-94
Peimbert, M.
1986. Publ. Astron. Soc. Pac. 98: 1057-60
Phillips, A.C., Conti, P.S.
1992. Ap. J. Lett. 395: 91-93
Podsiadlowski, P.H., Joss, P.C., Hsu, J.J.L.
1992. Ap. J. 391: 246-64
Polcaro, V., Viothi, R., Rossi, C., Norci, L.
1992. Astron. Astrophys. 265: 563-69
Prantzos, N., Hashimoto, M., Nomoto, K.
1990. Astron. Astrophys. 234: 211-29
Reitermann, A., Baschek, B., Stahl, O., Wolf, B.
1990. Astron. Astrophys. 234: 109-18
Rieke, G. 1991. See
Leitherer et al. 1991, pp. 205-16
Robert, C., Leitherer, C., Heckman, T.M.
1993. Ap. J. 418: 749-59
Roberts, M.S.
1962. Astron. J. 67: 79-85
Rubin, V.C., Hunter, D.A., Ford, W.K.Jr.
1990. Ap. J. 365: 86-92
Sargent, W.L.W.
1970. Ap. J. 160: 405-27
Sargent, W.L.W., Searle, L.
1970. Ap. J. Lett. 162: 155-60
Scalo, J. 1989. In
Windows on Galaxies, ed. G. Fabbiano, et al, pp.
125-40. Dordrecht: Kluwer
Schaerer, D., Charbonnel, C., Meynet, G., Maeder,
A., Schaller, G.
1993b. Astron. Astrophys. Suppl. 102: 339-42
Schaerer, D., Maeder, A.
1992. Astron. Astrophys. 263: 129-36
Schaerer, D., Meynet, G., Maeder, A., Schaller, G.
1993a. Astron.
Astrophys. Suppl. 98: 523-27
Schaerer, D., Schmutz, W.
1994. Astron. Astrophys. In press
Schaller, G., Schaerer, D., Meynet, G., Maeder, A.
1992. Astron. Astrophys. Suppl. 96: 269-331
Schild, H., Lortet, M.C., Testor, G. 1991. See
van der Hucht & Hidayat, pp. 479-84
Schild, H., Maeder, A.
1984. Astron. Astrophys. 136: 237-42
Schild, H., Smith, L.J., Willis, A.J.
1990. Astron. Astrophys. 237: 169-77
Schild, H., Tester, G.
1991. Astron. Astrophys. 243: 115-17
Schild, H., Testor, G.
1992. Astron. Astrophys. 266: 145-49
Schmutz, W., Hamann, W.R., Wessolowski, U.
1989. Astron. Astrophys. 210: 236-48
Schmutz, W., Leitherer, C., Hubeny, I., Vogel, M.,
Hamann, W.R., Wessolowski, U.
1991. Ap. J. 372: 664-82
Schmutz, W., Leitherer, C., Gruenwald, R.
1993. Publ. Astron. Soc. Pac. 104: 1164-72
Schonberner, D., Herrero, A., Becker, S., Eber, F.,
Butler, K., et al.
1988. Astron. Astrophys. 197: 209-22
Schulte-Ladbeck, R.E.
1989. Astron. J. 97: 1471-79
Schwarzschild, M. 1958.
Structure and Evolution of Stars, p. 296.
Princeton: Princeton Univ. Press
Shara, M.M., Moffat, A.F.J., Smith, L.F., Potter, M.
1991. Astron. J. 102: 716-43
Shields, G.A.
1990. Annu. Rev. Astron. Astrophys. 28: 525-60
Shields, G.A., Tinsley, B.M.
1976. Ap. J. 203: 66-71
Signore, M., Dupraz, C.
1990. Astron. Astrophys. 234: L15-18
Smith, L.F.
1968a. M.N.R.A.S. 138: 109-21
Smith, L.F.
1968b. M.N.R.A.S. 140: 409-33
Smith, L.F.
1968c. M.N.R.A.S. 141: 317-27
Smith, L.F. 1973. In
WR and High-Temperature Stars, IAU Symp. 49, ed.
M.K.V. Bappu, J. Sahade, pp. 15-41, Reidel: Dordrecht
Smith, L.F.
1988 Ap. J. 327: 128-38
Smith, L.F. 1991a. See
van der Hucht & Hidayat, pp. 601-10
Smith, L.F. 1991b. In The Magellanic Clouds,
IAU Symp. 148, ed. R.
Haynes, D. Milne, pp. 267-72. Dordrecht: Kluwer
Smith, L.F., Hummer, D.G.
1988. M.N.R.A.S. 230: 511-34
Smith, L.F., Maeder, A.
1989. Astron. Astrophys. 211: 71-80
Smith, L.F., Maeder, A.
1991. Astron. Astrophys. 241: 77-86
Smith, L.F., Meynet, G., Mermilliod, J-C.
1994. Astron. Astrophys. In press
Smith, L.F., Shara, M.M., Moffat, A.F.J.
1990. Ap. J. 348: 471-84
Sreenivasan, S.R., Wilson, W.J.F.,
1985. Ap. J. 290: 653-59
St Louis, N., Moffat, A.F.J., Drissen, L., Bastien,
P., Robert, C.
1988. Ap. J. 330: 286-304
Stahl, O.
1986. Astron. Astrophys. 164: 321-27
Stahl, O.
1987. Astron. Astrophys. 182: 229-36
Stahl, O., Wolf, B., Klare, G., Cassatella, A.,
Krauther, J., et al.
1983. Astron. Astrophys. 127: 49-62
Stencel, R.E., Pesce, J.E., Bauer, W.H.
1989. Astron. J. 97: 1120-38
Stothers, R.B.
1991a. Ap. J. 381: L67-70
Stothers, R.B.
1991b. Ap. J. 383: 820-36
Stothers, R.B., Chin, C.W.
1977. Ap. J. 211: 189-97
Stothers, R.B., Chin, C.W.
1979. Ap. J. 233: 267-79
Stothers, R.B., Chin, C.W.
1983. Ap. J. 264: 583-93
Stothers, R.B., Chin, C.W.
1990. Ap. J. Lett. 348: 21-24
Stothers, R.B., Chin, C.W.
1991. Ap. J. 374: 288-90
Stothers, R.B., Chin, C.W.
1992a. Ap. J. Lett. 390: L33-35
Stothers, R.B., Chin, C.W.
1992b. Ap. J. 390: 136-43
Testor, G., Schild, H.
1990. Astron. Astrophys. 240: 299-304
The PS, Arens, M., van der Hucht, K.A.
1982. Astrophys. Lett. 22: 109-18
Torres, A.V.
1988. Ap. J. 325: 759-47
Truran, J.W., Weiss, A. 1987. In
SN 1987A, ed, I.J. Danziger, pp.
271-282. Garching: ESO Workshop
Tuchman, J., Wheeler, J.C.
1989. Ap. J. 344: 835-43
Tuchman, J., Wheeler, J.C.
1990. Ap. J. 363: 255-64
Turolla, R., Nobili, L., Calvani, M.
1988. Ap. J. 324: 899-906
Tutukov, A.V., Yungelson, L.R.
1985. Sov. Astron. 29: 352
Underhill, A.B.
1949, M.N.R.A.S. 109: 562-70
Vacca, W.D. 1991.
Wolf-Rayet Stars in the Milky Way, the Large
Magellanic Cloud, and Emission-Line Galaxies. Ph.D thesis. Univ. Colo,,
Boulder
Vacca, W.D.,
1994. Ap. J. in press
Vacca, W.D., Conti, P.S.
1992. Ap. J. 401: 543-58
Vacca, W.D., Conti, P.S., Leitherer, C., Robert, C.
1994, In prep.
Vanbeveren, D.
1988. Astrophys. Space Sci. 149: 1-12
Vanbeveren, D.
1991. Astron, Astrophys. 252: 159-71
Vanbeveren, D.
1994. Astrophys. Space Sci. In press
Vanbeveren, D., Conti, P.S.
1980. Astron. Astrophys. 88: 230-39
Vanbeveren, D., de Loore, C. 1993. In
Massive Stars: Their Lives in the
Interstellar Medium, ed. J.P. Cassinelli, E.R. Churchwell, ASP Conf.
Ser. 35: 257-59
van den Bergh, S.
1968. J.R. Astron. Soc. Can. 62: 69
van der Hucht, K.A. 1991. See
van der Hucht & Hidayat. 1991, pp. 19-36
van der Hucht, K.A.
1992. Astron. Astrophys. Rev. 4: 123-59
van der Hucht, K.A., Hidayat, B., eds. 1991.
Wolf-Rayet Stars and
Interrelations with Other Massive Stars in Galaxies, IAU Symp. 143.
Dordrecht: Kluwer
van der Hucht, K.A., Hidayat, B., Admiranto, A.G.,
Supelli, K.R., Doom, C.
1988. Astron. Astrophys. 199: 217-34
Venn, K.A.
1993. Ap. J. 414: 316-32
Viotti, R., Polcaro, V.F., Rossi, C.
1993. Astron. Astrophys. 276: 432-44
Voels, S.A., Bohannan, B., Abbott, D.C., Hummer,
D.G.
1989. Ap. J. 340: 1073-190
Vrancken, M., de Greve, J.P., Yungelson, L., Tutukov, A.
1991. Astron. Astrophys. 249: 411-16
Walborn, N.R.
1976. Ap. J. 205: 419-25
Walborn, N. 1988. In
Atmospheric Diagnostics of Stellar Evolution, IAU
Colloq. 108, ed. K. Nomoto, pp. 70-78. Berlin, Heidelberg:
Springer-Verlag
Walsh, J.R., Roy, J-R.
1987. Ap. J. Lett. 319: 57-62
Whitmore, B.C., Schweizer, F., Leitherer, C., Borne,
K., Robert, C.
1993. Astron. J. 106: 1354-70
Willis, A.J. 1987. Q.J.R. Astron. Soc. 28: 217-24
Willis, A.J. 1991. In
Evolution of Stars: The Photospheric Abundance
Connection, IAU Symp. 145, ed. G. Michaud, A. Tutukov, pp. 195-207.
Dordrecht: Kluwer
Willis, A.J.
1994. Astrophys. Space Sci. Rev. In press
Willis, A.J., Schild, H., Smith, L.J.
1992. Astron. Astrophys. 261: 419-32
Wolf, B.
1989. Astron. Astrophys. Suppl. 217: 87-91
Wolf, B., Appenzeller, I., Stahl, O.
1981. Astron. Astrophys. 103: 94-102
Wolf, B., Stahl, O., Smolinski, J., Cassatella, A.
1988. Astron. Astrophys. Suppl. 74: 239-45
Wood, D.O.S., Churchwell, E.
1989. Ap. J. 340: 265-72
Woosley, S.E., Langer, N., Weaver, T.A.
1993. Ap. J. 411: 823-39
Wray, J.D., Corso, G.J.
1972. Ap. J. 172: 577-82
Yorke, H.W.
1986. Annu. Rev. Astron. Astrophys. 24: 49-87