


UIT pointings were chosen by the UIT science team and guest observers
with an emphasis on breadth of coverage of galaxy types, likely UV
brightness, low foreground extinction, and a size (typically more than
5' diameter) which takes advantage of the UIT's large field of
view. Given the short duration of the Astro missions and the brief
( 35 minute) periods
during which the spacecraft was in Earth's shadow, it was not possible
to conduct statistically complete surveys or very deep
exposures. Technical difficulties with the Shuttle data display units
often reduced exposure times below requested values. This atlas includes
data from all Astro-1 UIT frames containing identifiable images of
galaxies, excluding fields centered on the Magellanic Clouds, which have
been discussed elsewhere by
Cheng et al. (1992);
Cornett et al.
(1994,
1997);
Hill et al.
(1993a,
1994a,
1995c);
and Parker et al.
(1996,
1998).
35 minute) periods
during which the spacecraft was in Earth's shadow, it was not possible
to conduct statistically complete surveys or very deep
exposures. Technical difficulties with the Shuttle data display units
often reduced exposure times below requested values. This atlas includes
data from all Astro-1 UIT frames containing identifiable images of
galaxies, excluding fields centered on the Magellanic Clouds, which have
been discussed elsewhere by
Cheng et al. (1992);
Cornett et al.
(1994,
1997);
Hill et al.
(1993a,
1994a,
1995c);
and Parker et al.
(1996,
1998).
Often, galaxies in addition to the intended target are present in the field. All galaxies which were readily detectable as UV sources on the selected UIT images are included in this atlas. Identification of cataloged sources in the UV frames was accomplished by comparing each image with Digital Sky Survey images obtained using SkyView (McGlynn, Scollick, & White 1996), and searching relevant catalogs using a 20' radius around the central coordinate of the image. We did not attempt a rigorous selection of very faint or uncataloged sources. Examples of examination of UIT data frames for very low surface brightness objects may be found in O'Neil et al. (1996).
Table 3 lists the objects which were found to be UV sources in the Astro-1 images. Sources which are both strongly detected and have an angular diameter exceeding 30" in the MUV are classified as "Primary" objects. For these we present multiband imagery, corresponding azimuthally averaged radial surface brightness profiles and integrated magnitudes. Objects which are either weakly detected or appear as point sources are classified as "Secondary" objects. For these we present UV images and integrated quantities.
| V0 | D | Dist. | Scale | MB0 | RC3 | RSA | ||||
| Object (1) | Alt. ID (2) | R.A. (2000) (3) | Decl. (2000) (4) | (km s-1) (5) | (Mpc) (6) | Ref. (7) | (pc arcsec-1) (8) | (mag) (9) | Type (10) | Type (11) |
| Primary Objects | ||||||||||
| NGC 221... | M32 | 00 42 41.9 | +40 51 55 | -28 | 0.76 | 1 | 3.7 | -15.70 | cE2 | E2 |
| NGC 224... | M31 | 00 42 44.4 | +41 16 08 | -121 | 0.76 | 1 | 3.7 | -20.37 | SA(s)b | Sb I -II |
| NGC 598... | M33 | 01 33 50.9 | +30 39 37 | -46 | 0.84 | 2 | 4.1 | -18.54 | SA(s)cd | Sc(s) II-III |
| NGC 628... | M74 | 01 36 42.1 | +15 47 11 | 753 | 7.6 | 3 | 36.8 | -19.58 | SA(s)c | Sc(s) I |
| NGC 1068... | M77 | 02 42 40.2 | -00 00 48 | 1144 | 15.3 | 4 | 74.1 | -21.36 | SA(rs)b Sy2 | Sb(rs) II |
| NGC 1275... | Pers A | 03 19 48.5 | +41 30 45 | 5362 | 71.5 | 4 | 347 | -22.38 | cD,pec Sy2 | |
| NGC 1316... | Fornax A | 03 22 41.6 | -37 12 28 | 1674 | 17.0 | 5 | 82 | -21.73 | SAB(s)0,pec | Sa,pec |
| NGC 1317... |
| 03 22 44.7 | -37 06 10 | 1822 | 17.0 | 5 | 82 | -19.24 | SAB(r)a | Sa |
| NGC 1399... |
| 03 38 29.0 | -35 26 58 | 1323 | 17.0 | 5 | 82 | -20.60 | E1,pec | E1 |
| NGC 1404... |
| 03 38 51.7 | -35 35 36 | 1805 | 17.0 | 5 | 82 | -20.18 | E1 | E2 |
| NGC 2146... |
| 06 18 40.1 | +78 21 19 | 1035 | 13.8 | 4 | 66.9 | -19.65 | SB(s)ab,p | Sb II,pec |
| NGC 2992... |
| 09 45 42.1 | -14 19 39 | 2125 | 28.9 | 4 | 140 | -19.43 | Sa,pec Sy2 | Sa (tides) |
| NGC 2993... |
| 09 45 48.4 | -14 22 08 | 2224 | 28.9 | 4 | 140 | -19.46 | Sa,p | Sab (tides) |
| NGC 3031... | M81 | 09 55 33.5 | +69 04 00 | 69 | 3.6 | 6 | 17.4 | -20.05 | SA(s)ab | Sb(r) I-II |
| NGC 3034... | M82 | 09 55 54.0 | +69 40 57 | 323 | 3.6 | 6 | 17.4 | -18.61 | I0 | Amorphous |
| UGC 5336... | Ho IX | 09 57 30.0 | +69 02 00 | 154 | 3.6 | 6 | 17.4 | -13.64 | Im | |
| UGC 6697... |
| 11 43 48.7 | +19 58 12 | 6678 | 86 | 7 | 417 | -20.59 | Im | |
| NGC 4151... |
| 12 10 32.4 | +39 24 30 | 1022 | 13.6 | 4 | 66 | -19.17 | SAB(rs)ab Sy1.5 | Sab |
| NGC 4321... | M100 | 12 22 55.2 | +15 49 23 | 1540 | 16 | 8 | 77 | -21.03 | SAB(s)bc | Sc(s) I |
| Secondary Objects | ||||||||||
| Mrk 335... |
| 00 06 19.5 | +20 12 09 | 7846 | 105 | 4 | 509 |
| S0/a Sy1 | |
| NGC 891... |
| 02 22 33.1 | +42 20 48 | 661 | 8.8 | 4 | 42.7 | -19.23 | SA(s)b? | Sb on edge |
| NGC 1267... |
| 03 18 44.9 | +41 28 04 | 5161 | 71.5 | 4 | 347 |
| E+ | |
| NGC 1268... |
| 03 18 44.9 | +41 29 18 | 3226 | 43.0 | 4 | 208 |
| SAB(rs)b | |
| NGC 1270... |
| 03 18 58.5 | +41 28 18 | 4973 | 71.5 | 4 | 347 | -20.71 | E | |
| NGC 1272... |
| 03 19 21.3 | +41 29 32 | 4123 | 71.5 | 4 | 347 | -22.11 | E+ | |
| NGC 1273... |
| 03 19 27.2 | +41 32 25 | 5453 | 71.5 | 4 | 347 | -20.75 | SA(r)0? | |
| UGC 2665... |
| 03 19 27.4 | +41 38 07 | 7909 | 104 | 4 | 504 |
| Scd? | |
| NGC 1277... |
| 03 19 51.8 | +41 34 25 | 5084 | 71.5 | 4 | 347 | -20.36 | S0+,pec | |
| NGC 1278... |
| 03 19 54.4 | +41 33 50 | 6148 | 71.5 | 4 | 347 | -21.45 | E,pec | |
| NGC 1282... |
| 03 20 12.1 | +41 22 05 | 2294 | 30.6 | 4 | 148 | -19.30 | E | |
| NGC 1396... |
| 03 38 06.3 | -35 26 25 | 771 | 17.0 | 6 | 82 | -16.35 | SAB0- | |
| NGC 2551... |
| 08 24 49.3 | +73 24 46 | 2384 | 32 | 4 | 155 | -19.50 | SA(s)0/a | Sb(r) I-II |
| NGC 3837... |
| 11 43 56.7 | +19 53 42 | 6230 | 86 | 7 | 417 | -20.42 | E | |
| MCG3-30-71... |
| 11 44 01.9 | +19 46 57 | 4886 | 65 | 4 | 315 | -18.52 | Irr | |
| NGC 3842... |
| 11 44 02.0 | +19 57 01 | 6164 | 86 | 7 | 417 | -21.89 | E | |
| CGCG 97-114... |
| 11 44 47.2 | +19 46 22 | 6369 | 86 | 7 | 417 | -19.37 | Irr | |
| NGC 4156... |
| 12 10 49.7 | +39 28 24 | 6782 | 90 | 4 | 436 | -20.81 | SB(rs)b | |
| UGC 7188... |
| 12 11 16.5 | +39 24 08 | 1030 | 13.6 | 4 | 66 |
| SBm | |
| NGC 4470... |
| 12 29 37.9 | +07 49 22 | 2272 | 16 | 8 | 78 | -18.00 | Sa? | |
| NGC 4472... | M49 | 12 29 46.5 | +07 59 58 | 846 | 16 | 8 | 78 | -21.65 | E2 | E1/S01 |
| NGC 4476... |
| 12 29 58.7 | +12 20 53 | 1873 | 16 | 8 | 78 | -18.11 | SA(r)0- | E5,pec |
| NGC 4478... |
| 12 30 17.4 | +12 19 44 | 1329 | 16 | 8 | 78 | -18.76 | E2 | E2 |
| NGC 4486... | M87 | 12 30 49.7 | +12 23 24 | 1229 | 16 | 8 | 78 | -21.43 | E0,pec | E0 |
Notes. - Col. (1): Galaxy identification. Col. (2): Alternate identification. Col. (3): Right ascension of the galaxy centroid taken from the RC3, in units of hours, minutes, and seconds. Col. (4): Declination of the galaxy centroid taken from the RC3, in units of degrees, arcminutes, and arcseconds. Col. (5): Recession velocity in km s-1, corrected to the Galactic standard of rest as presented in the RC3. Col. (6): Adopted distance in megaparsecs. Col. (7): Distance references, given below. Col. (8): Physical scale in parsecs per arcsec using the distance given in col. 7. Col. (9): Absolute B magnitude, derived from BT, corrected for Galactic foreground absorption, using the distance given in col. 7. Col. (10): Morphological type from the RC3. Col. (11): Morphological type from the Revised Shapely Ames Catalog. | ||||||||||
References for Distance Estimates. - (1) Freedman 1990, Freedman & Madore 1990; (2) Freedman et al. 1991; (3) Sohn & Davidage 1996, Sharina et al. 1996; (4) distance obtained from recessional velocity listed in col. (7) and H0 = 75 km s-1 Mpc-1; (5) Fornax cluster members, Kohle et al. 1996, Shaya et al. 1996, McMillan et al. 1993; (6) Freedman et al. 1994; (7) D'Onofrio et al. 1997, Fruscione & Gavazzi 1990, Godwin & Peach 1982; (8) Ferrarese et al. 1996. | ||||||||||
Table 4 summarizes information pertaining to both
the UIT and ground-based images, such as exposure times and image
sources. A footnoted entry in column (4) indicates that multiple images
of adequate quality were obtained for that object. In such a case, the
listed UIT frame number is the best image of the set (e.g., it has the
longer exposure time or optimally shows low surface brightness
structures). Where there are multiple images for a given filter with
comparable exposure times, the images have been registered, scaled, and
co-added to improve the signal-to-noise ratio. Addition of UIT images
for objects which are only marginally detected does not significantly
enhance the detection. In situations for which a short and a long
exposure exist for a particular object, the shorter exposure was used to
replace any saturated pixels in the longer exposure. Saturated pixels in
the UV data (those with E-unit values
 1500 in the notation of
Stecher et al. 1997)
were found for a few of the brightest galaxy nuclei (e.g.,
Mrk 335) and
star-forming regions (as found in NGC 598) but were common in the
optical images. Spatial registration of images was accomplished using
field star astrometry obtained from the HST Guide Star Catalog
(Lasker et al. 1990).
Many of the FUV frames did not contain enough bright field stars to
accurately derive an astrometric solution. In such cases, we used either
spacecraft telemetry, uncataloged field stars, or morphological features
of the targets to register and align the images. For Andromeda (NGC 224), a mosaic covering a roughly
1° field of view was constructed
from two different UIT pointings. Image panels for the primary objects
are presented in
Figures 4a -
22a.
Secondary objects are displayed in
Figures 23a -
23b.
1500 in the notation of
Stecher et al. 1997)
were found for a few of the brightest galaxy nuclei (e.g.,
Mrk 335) and
star-forming regions (as found in NGC 598) but were common in the
optical images. Spatial registration of images was accomplished using
field star astrometry obtained from the HST Guide Star Catalog
(Lasker et al. 1990).
Many of the FUV frames did not contain enough bright field stars to
accurately derive an astrometric solution. In such cases, we used either
spacecraft telemetry, uncataloged field stars, or morphological features
of the targets to register and align the images. For Andromeda (NGC 224), a mosaic covering a roughly
1° field of view was constructed
from two different UIT pointings. Image panels for the primary objects
are presented in
Figures 4a -
22a.
Secondary objects are displayed in
Figures 23a -
23b.
| Object (1) | Filter (2) | texp (s) (3) | UIT Frame/Observatory (4) | Date (5) | Calibration Reference (6) | ||||||
| Primary Objects | |||||||||||
| NGC 221... | B1 | 582.5 | 0485f | 1990 Dec 9 | | ||||||
| | A1 | 583.5 | 0388f | 1990 Dec 9 | | ||||||
| NGC 224... | B1 | 384.5 | 0266f a | 1990 Dec 7 | | ||||||
| | A1 | 330.5 | 0236f | 1990 Dec 7 | | ||||||
| NGC 598... | B1 | 424.5 | 0496fa | 1990 Dec 9 | | ||||||
| | A1 | 416.5 | 0402fa | 1990 Dec 9 | | ||||||
| | R | 120.0 | KPNOa | 1992 Jan 1 | 1 | ||||||
| | H | 600.0 | KPNOa | 1992 Jan 1 | 2 | ||||||
| NGC 628... | B1 | 514.5 | 0172f | 1990 Dec 6 | | ||||||
| | A1 | 530.5 | 0161f | 1990 Dec 6 | | ||||||
| | B | 600.0 | MLO | 1991 Oct 8 | 1,3,4 | ||||||
| | V | 300.0 | MLO | 1991 Oct 8 | 1,3,4 | ||||||
| | R | 180.0 | MLO | 1991 Oct 8 | 1,4 | ||||||
| | H | 900.0 | MLO | 1991 Oct 8 | 5 | ||||||
| NGC 1068... | B1 | 563.5 | 0411fa | 1990 Dec 6 | | ||||||
| | A1 | 752.5 | 0303fa | 1990 Dec 6 | | ||||||
| | B | 300.0 | MLO | 1991 Dec 1 | 1,6 | ||||||
| | V | 150.0 | MLOa | 1993 Nov 7 | 1,6 | ||||||
| | R | 60.0 | KPNO | 1991 Mar 12 | 6 | ||||||
| | H | 2040.0 | KPNO | 1991 Mar 12 | 7 | ||||||
| NGC 1275... | B1 | 563.5 | 0464f | 1990 Dec 9 | | ||||||
| | A1 | 564.5 | 0384fa | 1990 Dec 9 | | ||||||
| | B | 900.0 | KPNO | 1991 Mar 8 | 1b | ||||||
| | V | 900.0 | KPNO | 1991 Mar 8 | 1b | ||||||
| | R | 180.0 | KPNO | 1991 Mar 13 | 1b | ||||||
| NGC 1316... | B1 | 545.5 | 0533f | 1990 Dec 10 | | ||||||
| | A1 | 545.5 | 0425f | 1990 Oct 12 | | ||||||
| | B | 300.0 | CTIO | 1991 Dec 6 | 1 | ||||||
| | V | 180.0 | CTIO | 1991 Dec 6 | 1 | ||||||
| | R | 180.0 | CTIO | 1991 Dec 6 | 1 | ||||||
| | H
| 600.0 | CTIO | 1991 Dec 6 | NCc | ||||||
| NGC 1317... | B1 | 545.5 | 0533f | 1990 Dec 10 | | ||||||
| | A1 | 545.5 | 0425f | 1990 Oct 12 | | ||||||
| | B | 600.0 | CTIO | 1991 Dec 10 | 1b | ||||||
| | V | 600.0 | CTIO | 1991 Dec 10 | 1b | ||||||
| | R | 180.0 | CTIO | 1991 Dec 6 | 1b | ||||||
| | H
| 900.0 | CTIO | 1991 Dec 11 | 8 | ||||||
| NGC 1399... | B1 | 1454.5 | 0232f | 1990 Dec 7 | | ||||||
| | A1 | 1099.5 | 0216f | 1990 Dec 7 | | ||||||
| | B | 300.0 | MLO | 1990 Jul 19 | 1b | ||||||
| | V | 600.0 | MLO | 1991 Feb 18 | 1,9 | ||||||
| | R | 300.0 | MLO | 1990 Jul 19 | 1,9b | ||||||
| NGC 1404... | B1 | 1454.5 | 0232f | 1990 Dec 7 | | ||||||
| | A1 | 1099.5 | 0216f | 1990 Dec 7 | | ||||||
| NGC 2146... | B5 | 443.5 | 0545fa | 1990 Dec 10 | | ||||||
| | A1 | 442.5 | 0437f | 1990 Oct 12 | | ||||||
| | B | 300.0 | KPNO | 1991 Dec 1 | 1 | ||||||
| | R | 180.0 | KPNO | 1991 Dec 1 | 1 | ||||||
| | H
| 600.0 | KPNO | 1991 Dec 31 | 7,10 | ||||||
| NGC 2992... | B1 | 256.5 | 0097f | 1990 Dec 5 | | ||||||
| | A1 | 256.5 | 0090f | 1990 Dec 5 | | ||||||
| | B | 300.0 | KPNO | 1991 Dec 9 | 1 | ||||||
| | V | 600.0 | CTIO | 1991 Dec 9 | 1 | ||||||
| | R | 600.0 | CTIO | 1991 Dec 9 | 1 | ||||||
| | H
| 1800.0 | CTIO | 1991 Dec 9 | 11 | ||||||
| NGC 2993... | B1 | 256.5 | 0097f | 1990 Dec 5 | | ||||||
| | A1 | 256.5 | 0090f | 1990 Dec 5 | | ||||||
| | B | 300.0 | KPNO | 1991 Dec 9 | 1 | ||||||
| | V | 600.0 | CTIO | 1991 Dec 9 | 1 | ||||||
| | R | 600.0 | CTIO | 1991 Dec 9 | 1b | ||||||
| | H
| 1800.0 | CTIO | 1991 Dec 9 | 11 | ||||||
| NGC 3031... | B1 | 640.5 | 0556f | 1990 Dec 10 | | ||||||
| | A1 | 639.5 | 0442f | 1990 Oct 12 | | ||||||
| | B | 600.0 | KPNO | 1993 Dec 8 | 1 | ||||||
| | V | 600.0 | KPNO | 1991 Mar 8 | 1 | ||||||
| | R | 300.0 | KPNOa | 1990 May 27 | 1 | ||||||
| | H
| 600.0 | KPNO | 1991 Apr 13 | 12 | ||||||
| NGC 3034... | B1 | 270.5 | 0204fa | 1990 Dec 6 | | ||||||
| | A1 | 270.5 | 0194f | 1990 Dec 6 | | ||||||
| | B | 600.0 | MLO | 1991 Feb 19 | 13 | ||||||
| | V | 600.0 | KPNO | 1991 Mar 9 | 13 | ||||||
| | R | 300.0 | MLOa | 1991 May 12 | 13 | ||||||
| | H
| 1200.0 | MLO | 1991 May 12 | 14 | ||||||
| UGC 5336... | B1 | 640.5 | 0556f | 1990 Dec 10 | | ||||||
| | A1 | 639.5 | 0442f | 1990 Oct 12 | | ||||||
| | B | 600.0 | KPNO | 1993 Dec 8 | 1b | ||||||
| | R | 300.0 | KPNOa | 1990 May 27 | 1b | ||||||
| UGC 6697... | B5 | 529.5 | 0193f | 1990 Dec 6 | | ||||||
| | A1 | 105.5 | 0184f | 1990 Dec 6 | | ||||||
| | B | 300.0 | KPNO | 1992 Jan 1 | 1b | ||||||
| | R | 180.0 | KPNO | 1992 Jan 1 | 1b | ||||||
| NGC 4151... | B5 | 1199.5 | 0337fa | 1990 Dec 8 | | ||||||
| | A1 | 293.5 | 0295fa | 1990 Dec 8 | | ||||||
| | B | 300.0 | KPNO | 1990 Jun 1 | 1b | ||||||
| | V | 600.0 | KPNO | 1991 Mar 8 | 1b | ||||||
| | R | 180.0 | KPNO | 1990 Jun 1 | 1 | ||||||
| | H
| 3600.0 | KPNO | 1991 Mar 8 | NC | ||||||
| NGC 4321... | B5 | 226.5 | 0166f | 1990 Dec 6 | | ||||||
| | A5 | 226.5 | 0157f | 1990 Dec 6 | | ||||||
| | B | 600.0 | KPNO | 1991 Mar 12 | 1,15 | ||||||
| | V | 300.0 | KPNO | 1991 Mar 12 | 1,15 | ||||||
| | R | 180.0 | KPNO | 1992 Jan 2 | 1,15 | ||||||
| | H
| 600.0 | KPNO | 1992 Jan 2 | 16 | ||||||
| Secondary Objects | |||||||||||
| Mrk 335... | B1 | 286.5 | 0507fa | 1990 Dec 10 | | ||||||
| | A1 | 294.5 | 0410fa | 1990 Dec 10 | | ||||||
| NGC 891... | B5 | 437.5 | 0358fa | 1990 Dec 8 | | ||||||
| | A1 | 437.5 | 0307f | 1990 Dec 8 | | ||||||
| | R | 300.0 | MLO | 1992 Aug 23 | NC | ||||||
| | H
| 600.0 | MLO | 1993 Dec 6 | 10 | ||||||
| NGC 1267... | B1 | 563.5 | 0464f | 1990 Dec 9 | | ||||||
| | A1 | 564.5 | 0384fa | 1990 Dec 9 | | ||||||
| NGC 1268... | B1 | 563.5 | 0464f | 1990 Dec 9 | | ||||||
| | A1 | 564.5 | 0384fa | 1990 Dec 9 | | ||||||
| NGC 1270... | B1 | 563.5 | 0464f | 1990 Dec 9 | | ||||||
| | A1 | 564.5 | 0384fa | 1990 Dec 9 | | ||||||
| | B | 900.0 | KPNO | 1991 Mar 8 | 1 | ||||||
| | V | 900.0 | KPNO | 1991 Mar 8 | 1 | ||||||
| | R | 180.0 | KPNO | 1991 Mar 13 | 1b | ||||||
| NGC 1272... | B1 | 563.5 | 0464f | 1990 Dec 9 | | ||||||
| | A1 | 564.5 | 0384fa | 1990 Dec 9 | | ||||||
| | B | 900.0 | KPNO | 1991 Mar 8 | 1 | ||||||
| | V | 900.0 | KPNO | 1991 Mar 8 | 1b | ||||||
| | R | 180.0 | KPNO | 1991 Mar 13 | 1b | ||||||
| NGC 1273... | B1 | 563.5 | 0464f | 1990 Dec 9 | | ||||||
| | A1 | 564.5 | 0384fa | 1990 Dec 9 | | ||||||
| | B | 900.0 | KPNO | 1991 Mar 8 | 1 | ||||||
| | V | 900.0 | KPNO | 1991 Mar 8 | 1 | ||||||
| | R | 180.0 | KPNO | 1991 Mar 13 | 1b | ||||||
| UGC 2665... | B1 | 563.5 | 0464f | 1990 Dec 9 | | ||||||
| | A1 | 564.5 | 0384fa | 1990 Dec 9 | | ||||||
| | B | 900.0 | KPNO | 1991 Mar 8 | 1b | ||||||
| | V | 900.0 | KPNO | 1991 Mar 8 | 1b | ||||||
| NGC 1277... | B1 | 563.5 | 0464f | 1990 Dec 9 | | ||||||
| | A1 | 564.5 | 0384fa | 1990 Dec 9 | | ||||||
| | B | 900.0 | KPNO | 1991 Mar 8 | 1 | ||||||
| | V | 900.0 | KPNO | 1991 Mar 8 | 1 | ||||||
| | R | 180.0 | KPNO | 1991 Mar 13 | 1b | ||||||
| NGC 1278... | B1 | 563.5 | 0464f | 1990 Dec 9 | | ||||||
| | A1 | 564.5 | 0384fa | 1990 Dec 9 | | ||||||
| | B | 900.0 | KPNO | 1991 Mar 8 | 1 | ||||||
| | V | 900.0 | KPNO | 1991 Mar 8 | 1 | ||||||
| | R | 180.0 | KPNO | 1991 Mar 13 | 1b | ||||||
| NGC 1282... | B1 | 563.5 | 0464f | 1990 Dec 9 | | ||||||
| | A1 | 564.5 | 0384fa | 1990 Dec 9 | | ||||||
| | B | 900.0 | KPNO | 1991 Mar 8 | 1 | ||||||
| | V | 900.0 | KPNO | 1991 Mar 8 | 1 | ||||||
| | R | 180.0 | KPNO | 1991 Mar 13 | 1 | ||||||
| NGC 1396... | B1 | 1454.5 | 0232f | 1990 Dec 7 | | ||||||
| | A1 | 1099.5 | 0216f | 1990 Dec 7 | | ||||||
| NGC 2551... | B1 | 454.5 | 0451fa | 1990 Dec 9 | | ||||||
| | A1 | 454.5 | 0380f | 1990 Dec 9 | | ||||||
| NGC 3837... | B5 | 529.5 | 0193f | 1990 Dec 6 | | ||||||
| | A1 | 105.5 | 0184f | 1990 Dec 6 | | ||||||
| | B | 300.0 | KPNO | 1992 Jan 1 | 1 | ||||||
| | R | 180.0 | KPNO | 1992 Jan 1 | 1b | ||||||
| MCG 3 30 71... | B5 | 529.5 | 0193f | 1990 Dec 6 | | ||||||
| | A1 | 105.5 | 0184f | 1990 Dec 6 | | ||||||
| | B | 300.0 | KPNO | 1992 Jan 1 | 1b | ||||||
| | R | 180.0 | KPNO | 1992 Jan 1 | 1b | ||||||
| NGC 3842... | B5 | 529.5 | 0193f | 1990 Dec 6 | | ||||||
| | A1 | 105.5 | 0184f | 1990 Dec 6 | | ||||||
| | B | 300.0 | KPNO | 1992 Jan 1 | 1 | ||||||
| | R | 180.0 | KPNO | 1992 Jan 1 | 1b | ||||||
| CGCG 97 114... | B5 | 529.5 | 0193f | 1990 Dec 6 | | ||||||
| | A1 | 105.5 | 0184f | 1990 Dec 6 | | ||||||
| NGC 4156... | B5 | 1199.5 | 0337fa | 1990 Dec 8 | | ||||||
| | A1 | 293.5 | 0295fa | 1990 Dec 8 | | ||||||
| | B | 300.0 | KPNO | 1990 Jun 1 | 1 | ||||||
| | V | 600.0 | KPNO | 1991 Mar 8 | 1 | ||||||
| | R | 180.0 | KPNO | 1990 Jun 1 | 1b | ||||||
| | H
| 3600.0 | KPNO | 1991 Mar 8 | NC | ||||||
| UGC 7188... | B5 | 1199.5 | 0337fa | 1990 Dec 8 | | ||||||
| | A1 | 293.5 | 0295fa | 1990 Dec 8 | | ||||||
| | B | 300.0 | KPNO | 1990 Jun 1 | 1b | ||||||
| | V | 600.0 | KPNO | 1991 Mar 8 | 1b | ||||||
| | R | 180.0 | KPNO | 1990 Jun 1 | 1b | ||||||
| | H
| 3600.0 | KPNO | 1991 Mar 8 | NC | ||||||
| NGC 4470... | B5 | 180.5 | 0415f | 1990 Dec 9 | | ||||||
| | A5 | 180.5 | 0338f | 1990 Dec 9 | | ||||||
| NGC 4472... | B5 | 180.5 | 0415f | 1990 Dec 9 | | ||||||
| | A5 | 180.5 | 0338f | 1990 Dec 9 | | ||||||
| NGC 4476... | B5 | 352.5 | 0125f | 1990 Dec 5 | | ||||||
| | A1 | 70.5 | 0113f | 1990 Dec 5 | | ||||||
| NGC 4478... | B5 | 352.5 | 0125f | 1990 Dec 5 | | ||||||
| | A1 | 70.5 | 0113f | 1990 Dec 5 | | ||||||
| NGC 4486... | B5 | 352.5 | 0125f | 1990 Dec 5 | | ||||||
| | A1 | 70.5 | 0113f | 1990 Dec 5 | | ||||||
| | B | 300.0 | MLO | 1991 Feb 4 | 1,17,18,19 | ||||||
| | V | 300.0 | MLO | 1991 Nov 5 | 1,17,18,19,20 | ||||||
| | R | 300.0 | MLOa | 1991 Nov 5 | 1,21,22 | ||||||
Notes. - Col. (1): Galaxy identification.
Col. (2): Filter used for this observation.
Col. (3): Exposure time in seconds.
Col. (4): For UIT data this column lists the assigned UIT image frame
number from which the photometry was derived (See
Section 4.2
for details). These frame numbers can be used to access the UIT data
from the HST multimission archive. For optical band imagery,
this column lists the source of the data.
Col. (5): Date of observation.
Col. (6): Literature reference to the published data that was used to
bootstrap the calibration of the optical photometry presented in this
paper.
References. -(1)
Prugniel &
Heraudeau 1998; (2)
using spectrophotometric standard star Feige 34
(Stone 1977) ; (3)
Frogel 1985; (4)
Elmegreen 1980; (5)
Kennicutt & Hodge
1980; (6)
Schild et
al. 1985; (7)
Young et al. 1988;
(8)
Crocker et
al. 1996; (9)
Mackie et
al. 1990; (10)
Smith & Harvey
1996; (11)
Usui et al. 1998;
(12)
Hill et al. 1995a;
(13) using standard star field; (14)
O'Connell &
Mangano 1978;
(15) de Jong & van
der Kruit 1994,
with applied systematic offsets given by
Prugniel &
Heraudeau 1998; (16)
Kennicutt & Kent
1983; (17)
Goudfrooij et al. 1994,
with applied systematic offsets given by
Prugniel
& Heraudeau 1998; (18)
Michard 1982,
with applied systematic offsets given by
Prugniel &
Heraudeau 1998; (19)
Poulain 1983, private communication, with applied systematic offsets
given by
Prugniel & Heraudeau
1998; (20)
Aaronson & Mould
1981, with applied systematic offsets given by
Prugniel &
Heraudeau 1998; (21)
Djorgovski 1985,
with applied systematic offsets given by
Prugniel &
Heraudeau 1998; (22)
Peletier et
al. 1990, with applied systematic offsets given by
Prugniel &
Heraudeau 1998
| |||||||||||
|

|
Figure 4. (a) UV images for
NGC 221 (M32). Surface brightness and color profiles
show 1 |
|

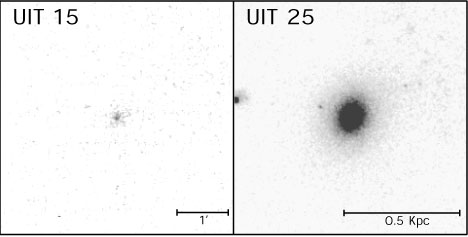
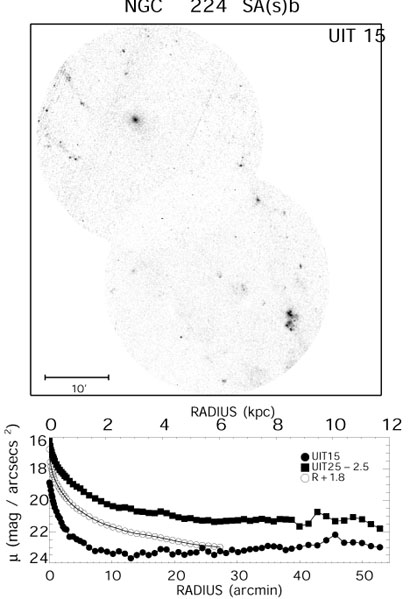
|
Figure 5. (a) Upper panel: FUV mosaic of NGC 224 (M31). Lower panel: UV and R-band (from Kent 1987) extinction-corrected radial surface brightness profiles. Note that offsets (given in the legend) have been applied. (b) Upper panel: MUV mosaic of NGC 224. Lower panel: UV and R-band extinction-corrected color profiles. Note that offsets (given in the legend) have been applied. |
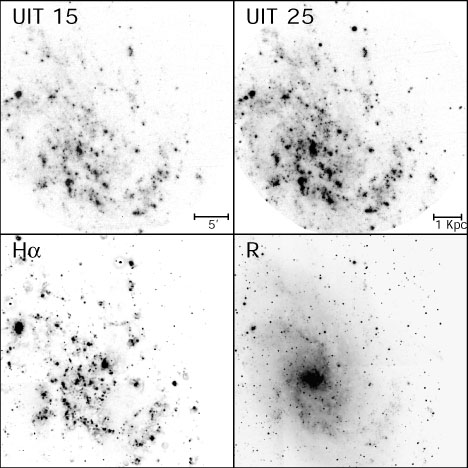
|
|
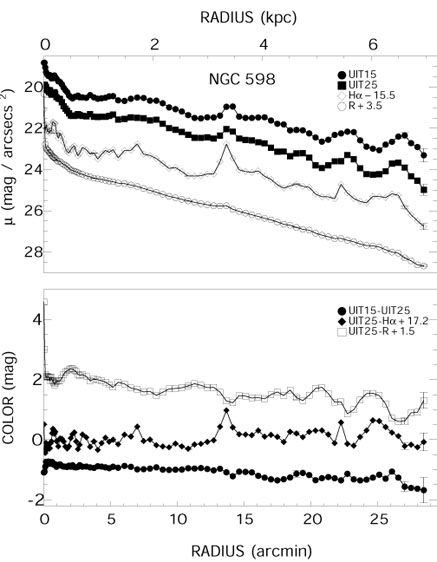
Figure 6. (a) UV and optical images
for NGC 598 (M33). (b) UV/optical
extinction-corrected radial
surface brightness (upper) and color (lower) profiles for
NGC 598. Note that offsets (given in the legend)
have been applied. The
H |

|
|
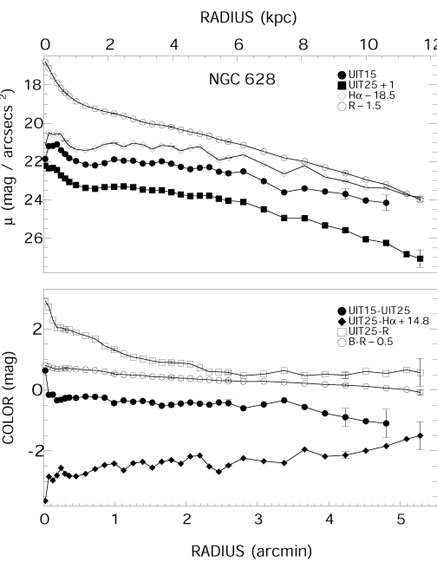
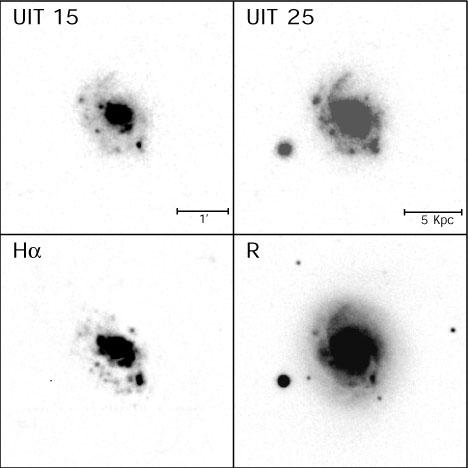
Figure 7. (a) UV and optical images
for NGC 628 (M74). (b) UV/optical
extinction-corrected radial
surface brightness (upper) and color (lower) profiles for
NGC 628. Note that offsets (given in the legend)
have been applied. The
H |
|
|
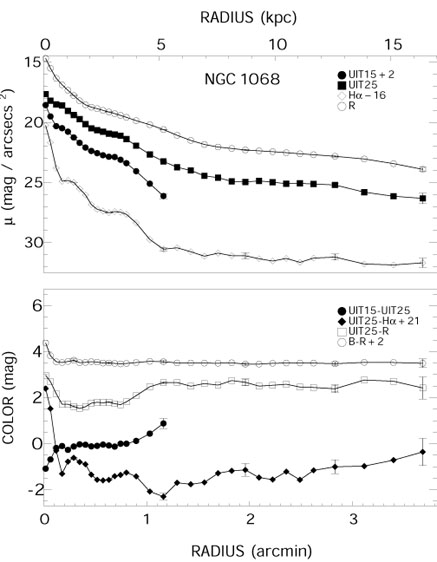
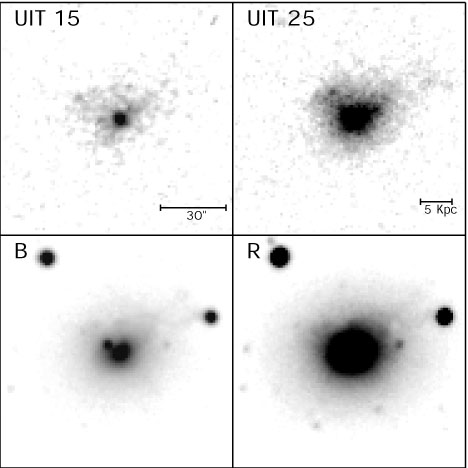
Figure 8. (a) UV and optical images
for NGC 1068. (b) UV/optical extinction-corrected
radial surface
brightness (upper) and color (lower) profiles for
NGC 1068. Note that offsets (given in the legend) have been applied. The
H |
|
|
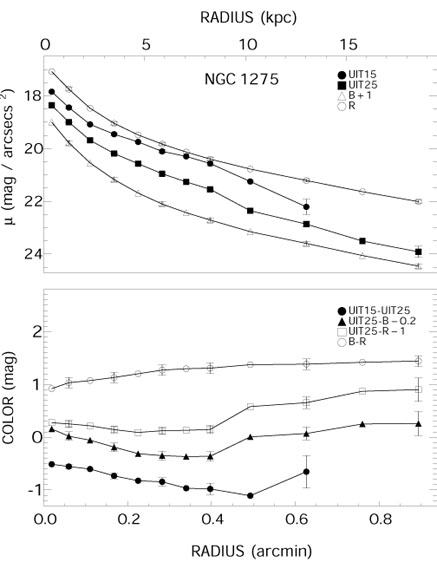
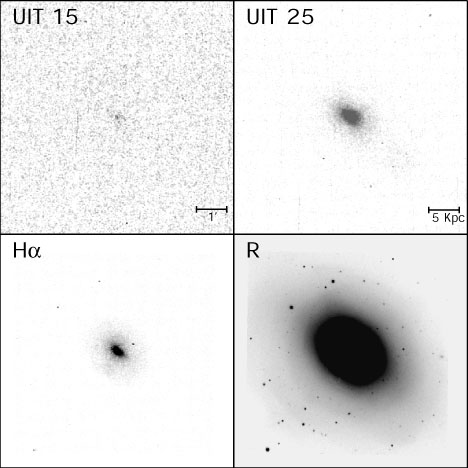
Figure 9. (a) UV and optical images for NGC 1275. (b) UV/optical extinction-corrected radial surface brightness (upper) and color (lower) profiles for NGC 1275. Note that offsets (given in the legend) have been applied. |
|

|
Figure 10. (a) UV and optical images
for NGC 1316. (b) UV/optical extinction-corrected
radial surface
brightness (upper) and color (lower) profiles for
NGC 1316. Note that the
H |
|
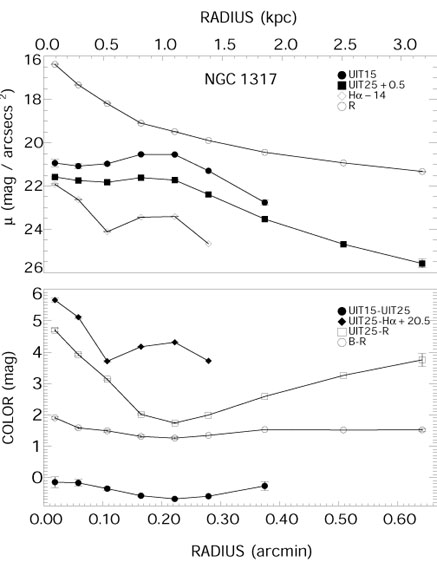
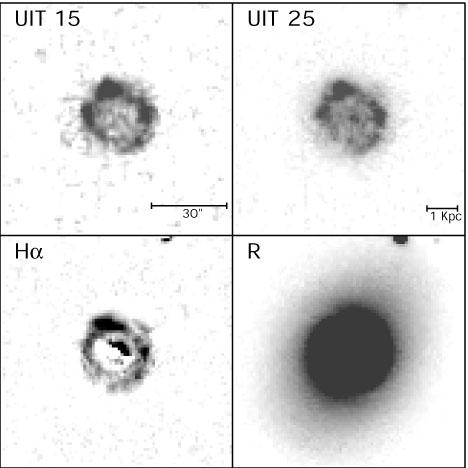
|
Figure 11. (a) UV and optical images
for NGC 1317. (b) UV/optical extinction-corrected
radial surface
brightness (upper) and color (lower) profiles for
NGC 1317. Note that offsets (given in the legend)
have been applied. The
H |
|
|
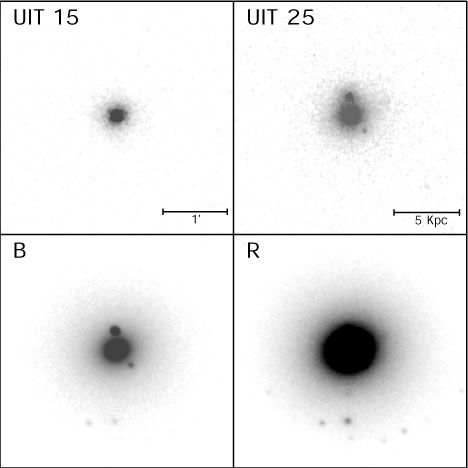
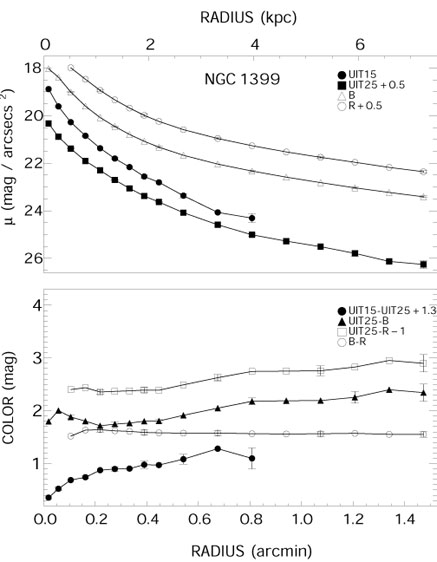
Figure 12. (a) UV and optical images for NGC 1399. (b) UV/optical extinction-corrected radial surface brightness (upper) and color (lower) profiles for NGC 1399. Note that offsets (given in the legend) have been applied. |
|

|
Figure 13. (a) UV images for NGC 1404. (b) UV/optical extinction-corrected radial surface brightness (upper) and color (lower) profiles for NGC 1404. |
|

|
Figure 14. (a) UV and optical images for NGC 2146. (b) UV/optical extinction-corrected radial surface brightness (upper) and color (lower) profiles for NGC 2146. Note that offsets (given in the legend) have been applied. |
|
|
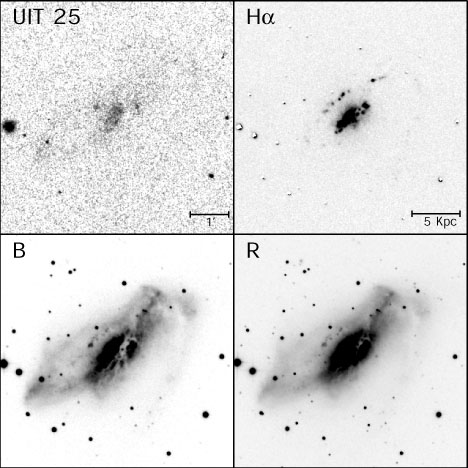
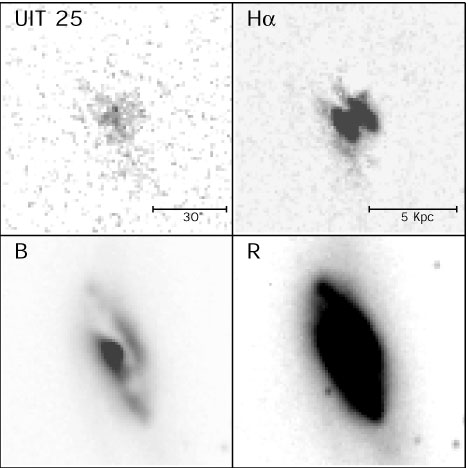
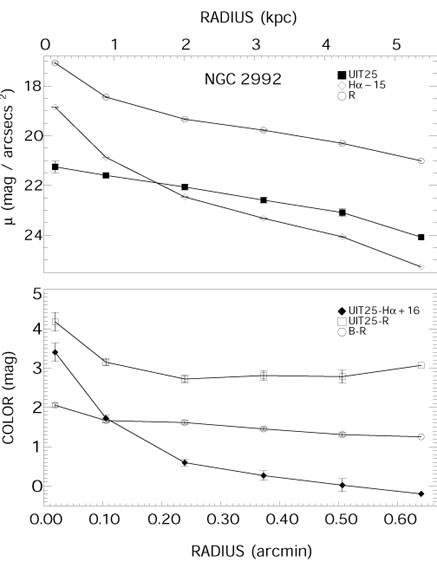
Figure 15. (a) UV and optical images
for NGC 2992, an interacting galaxy with NGC 2993. (b)
UV/optical extinction-corrected radial surface brightness
(upper) and color (lower) profiles for NGC 2992. Note
that offsets (given in the legend) have been applied. The
H |
|
|
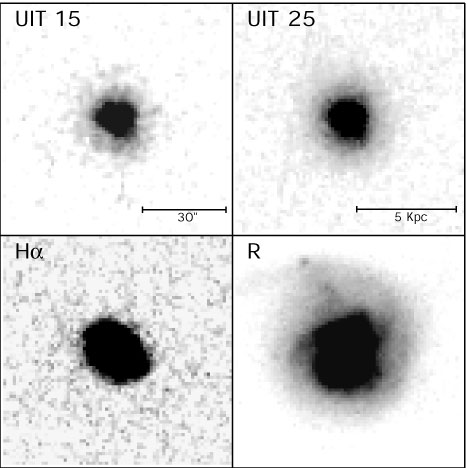
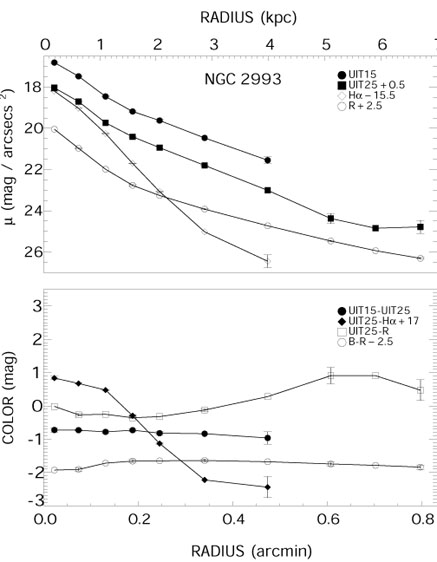
Figure 16. (a) UV and optical images
for NGC 2993, an interacting galaxy with NGC 2992. (b)
UV/optical extinction-corrected radial surface brightness
(upper) and color (lower) profiles for NGC 2993. Note
that offsets (given in the legend) have been applied. The
H |
|
|
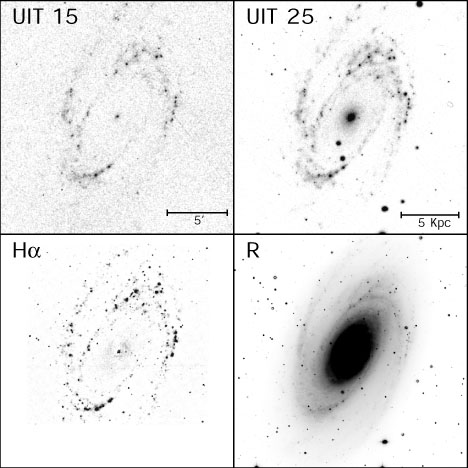
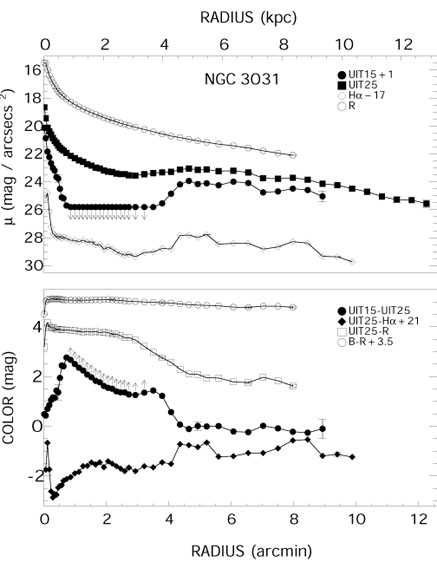
Figure 17. (a) UV and optical images for NGC 3031 (M81). (b) UV/optical extinction-corrected radial surface brightness (upper) and color (lower) profiles for NGC 3031. |
|
|
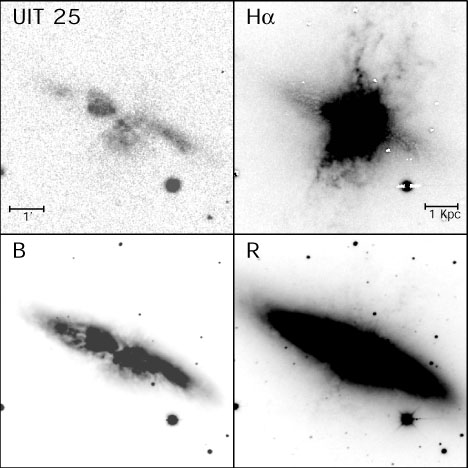
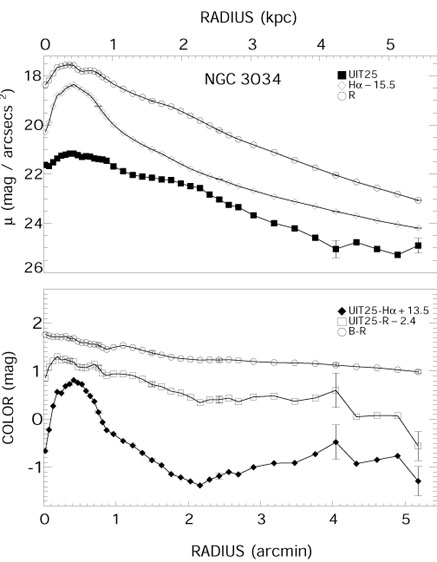
Figure 18. (a) UV and optical images
for NGC 3034 (M82). (b) UV/optical
extinction-corrected radial
surface brightness (upper) and color (lower) profiles for
NGC 3034. Note that offsets (given in the legend)
have been applied. The
H |
|
|
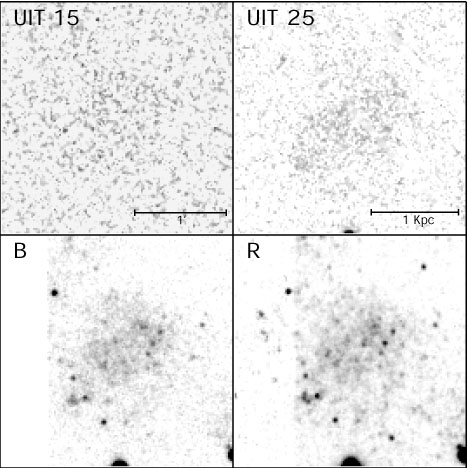
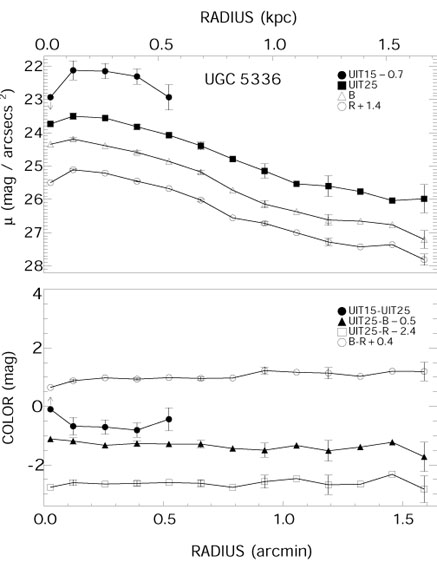
Figure 19. (a) UV and optical images for UGC 5336. (b) UV/optical extinction-corrected radial surface brightness (upper) and color (lower) profiles for UGC 5336. Note that offsets (given in the legend) have been applied. |
|

|
Figure 20. (a) UV and optical images for UGC 6697. (b) UV/optical extinction-corrected radial surface brightness (upper) and color (lower) profiles for UGC 6697. Note that offsets (given in the legend) have been applied. |
|
|
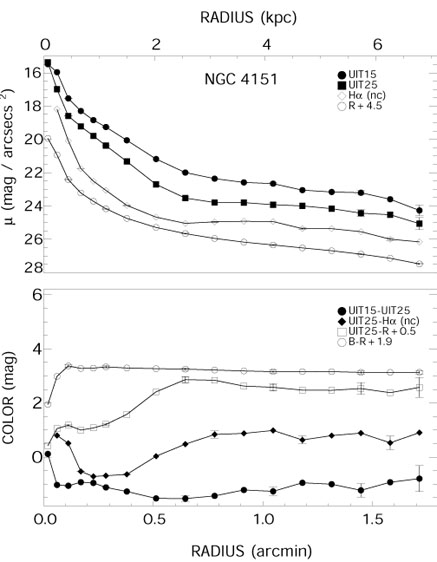
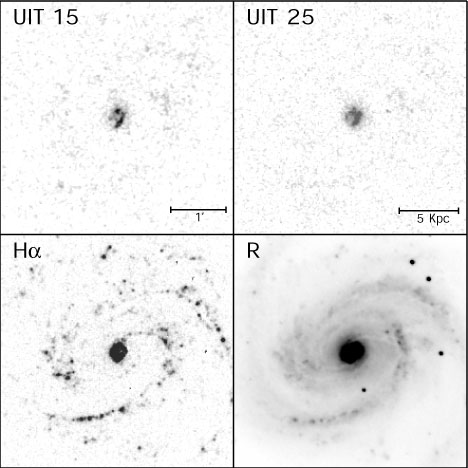
Figure 21. (a) UV and optical images
for NGC 4151. (b) UV/optical extinction-corrected
radial surface
brightness (upper) and color (lower) profiles for
NGC 4151. Note that offsets (given in the legend)
have been applied and that the
H |
|
|
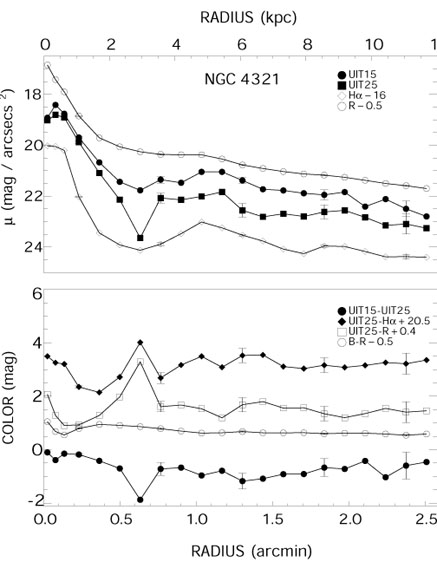
Figure 22. (a) UV and optical images
for NGC 4321. (b) UV/optical extinction-corrected
radial surface
brightness (upper) and color (lower) profiles for
NGC 4321. Note that offsets (given in the legend)
have been applied. The
H |
|
|
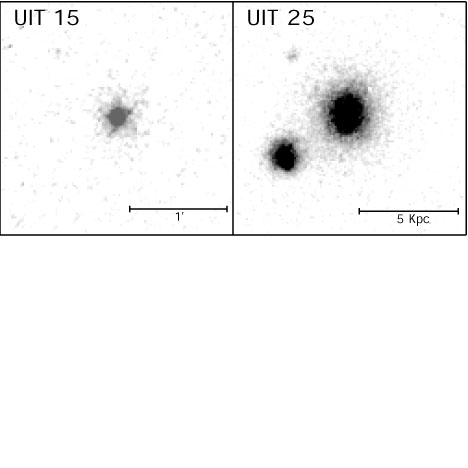
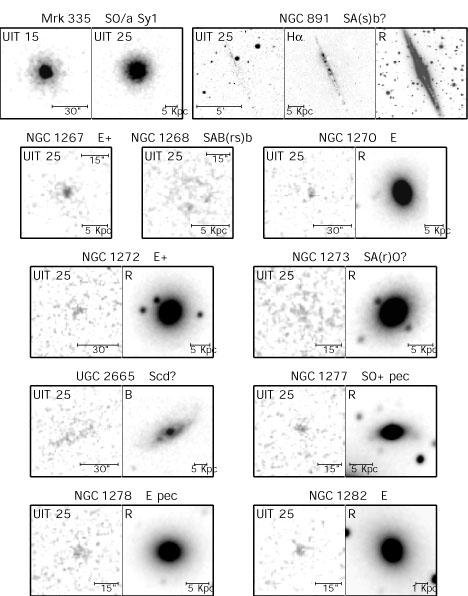
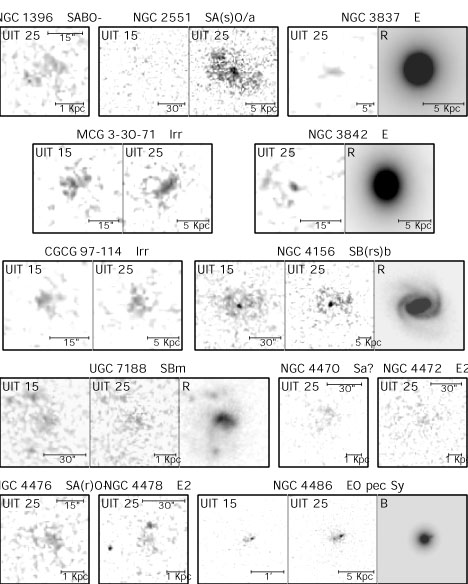
Figure 23. UV and optical (where available) images for "secondary" objects. |
Some Astro-1 images were affected by thin (a few pixels) linear scratches, apparently on the emulsion surface, which occurred during the digitalization process. These artifacts have been treated by replacing the affected pixels with values determined by linear interpolation from neighboring pixels. Astro-2 images (see Kuchinski et al. 2000) are not similarly affected.
4.3. Flux Calibration and Error Analysis
UIT noise characteristics have been determined from repeated
measurements of the pixel values in laboratory flat fields (see
Stecher et al. 1997
for full details). The resulting noise/signal ratio is relatively small
(15%-20% for single pixels and 5% for regions several arcseconds in
size) over the center of the dynamic range, with substantial increases
( 40%) at the extremes. The
photometric uncertainties reported in the tables here combine the
estimated variances for all pixels in a given measuring aperture in
quadrature, treating source pixels and sky as independent contributors
to uncertainty in the flux values.
40%) at the extremes. The
photometric uncertainties reported in the tables here combine the
estimated variances for all pixels in a given measuring aperture in
quadrature, treating source pixels and sky as independent contributors
to uncertainty in the flux values.
Absolute flux calibration of UIT was determined by comparing photometry of stars from selected UIT frames with photometry from IUE, HUT, ANS, GHRS, and other UV instruments. The primary calibration is based on isolated stars observed in common with IUE. Typical uncertainties in absolute fluxes for UIT sources with good exposure were determined to be ~ 15% (Stecher et al. 1997).
The majority of the ground-based images were taken under nonphotometric
sky conditions. Broadband optical images in the BVR bands were
calibrated by comparison to a compilation of published aperture and CCD
photometry as given by
Prugniel &
Heraudeau (1998).
All R-band data given in this atlas are based on the Cousins
R
(Bessell 1986)
photometric system. Additional sources were used to flux calibrate the
H and some R-band
images. For the broadband data, calibration scaling factors were derived
from the mean offset (in magnitudes) between all available photometry
and instrumental values determined for matching apertures. Offsets
obtained in this manner inherently account for air mass corrections,
color terms (for that particular object), and instrumental
corrections. We note that foreground stars were masked out during
computation of the photometry presented in this paper. To derive a
calibration by comparison to published values, instrumental magnitudes
were computed without masking foreground stars, on the assumption that
the literature values were derived in this manner. References and
methods used to calibrate the optical data are given in column (6) of
Table 4. Uncalibrated data are indicated as "NC"
in the table.
Continuum-free H images were
obtained by subtracting a scaled R-band image from a narrowband
image centered on
H. Unsaturated stars common
to both images were used to determine the scaling factor applied to the
R-band image. Published
H aperture photometry was
then used to derive an absolute calibration for the pure emission line
image. The narrowband filters used for the
H data presented in the
atlas included possible [N II] emission; no correction has been applied
for this. However, most of the references used to determine absolute
calibrations also included [N II], so the calibrations should be
consistent.
H fluxes are given in units
of ergs s-1 cm-2.
The optical photometry presented here has typical
uncertainties of 0.05 mag. The
H data have a somewhat
larger uncertainty (~ 10%-30%), due to the limited published photometry
available for calibration and to uncertainties in continuum
subtraction. For a few objects we could not locate any existing
published data of suitable accuracy, and these images lack calibrated
zero points. Uncalibrated data are indicated in the tables and figures.
For images which contain multiple sources with published photometry in the same frame (e.g., the Perseus Cluster field), an average calibration was computed and applied to all galaxies in that image including those without existing photometry. Such galaxies have been flagged in Table 4 and have larger photometric uncertainties, since this method does not allow for individual color term corrections. We note that the lack of an absolute calibration does not affect the comparison between the shapes of the surface brightness profiles (Figs. 4b - 22b), or in certain derived photometric parameters such as half-light radii.
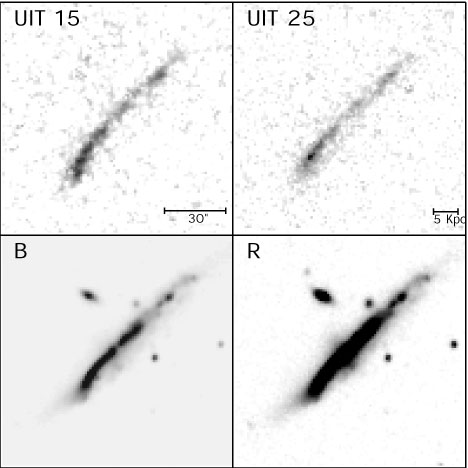
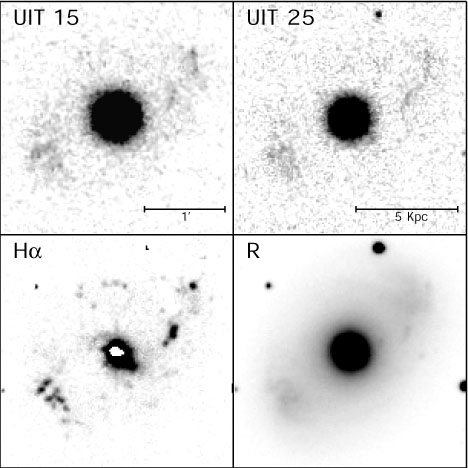
This UV/optical atlas consists of images and associated radial light and
color profiles. In Figures 4a -
22a we present the registered, multiband
images of the primary targets;
Figures 23a -
23b show thumbprints of UIT images for
the secondary targets. Objects are presented in order of increasing
right ascension. Where available, an
H and R-band image
are displayed for comparison to the FUV ("UIT 15") and MUV ("UIT 25")
images. In cases where
H is not available, or the
galaxy does not appear as a source in the FUV image, a B-band
and/or V-band image has been substituted. Images are oriented
north-up, east-left, and all images for a specific galaxy are displayed
with the same spatial scale. The adopted color tables and displayed
intensity ranges have been optimized for each individual galaxy in order
to emphasize extended, low surface brightness UV
structure. Morphological types were obtained from the
NASA/IPAC
Extragalactic Database (NED) and the Third Reference Catalog of Bright
Galaxies
(de Vaucouleurs et
al. 1991,
hereafter RC3).
In Figures 4b -
22b we present azimuthally averaged
radial surface brightness and color profiles for the primary
objects. The FUV, MUV,
H, and R-band
profiles are shown, where available. For objects lacking
H data, B-band
photometry has been substituted. Arrows on the data points, oriented in
either an up or down direction, represent lower and upper limits,
respectively. The
H surface photometry is
presented in magnitudes, defined by -2.5 log10(f),
where f is in units of ergs s-1
cm-2. Surface brightness profiles which are uncalibrated are
flagged in the legend with "NC." Photometric errors, representing 1
standard deviation, are indicated on the profiles, generally for the
outermost points. For the larger galaxies in this sample, scaling of the
profiles in Figures 4b -
22b precludes display of the detailed
structure of the inner light profiles, but these data are available in
Table 9 (see
Appendix B). In most cases, the FWHM of the
seeing disk for the optical data was smaller than the FWHM of the UIT
data; this mismatch can produce spurious color gradients for r
5" in some sources.
For each primary object synthetic aperture photometry was performed using the calibrated, unregistered, artifact-corrected images. The photometry employed concentric fixed elliptical annuli centered on the peak emission determined from the R-band image (where available, or alternatively B band). The location of the central peak was typically in agreement with the position given in the RC3. The width of the annuli ranged from 28" (25 UIT pixels) for the outermost regions of the galaxies having the largest angular size, to a minimum of 3".3 (3 UIT pixels) for the innermost annuli. In order to include any possible extended low surface brightness structure around the objects, the outermost apertures were chosen to lie well beyond the D25 isophotal diameter given in the RC3. The derived light profiles were individually examined to determine the radius for which the surface brightness profile flattened to the background sky.
Aperture parameters were determined by fitting ellipses to the outer R-band (or B-band) isophotes for each object. The derived ellipticity and position angles for a given object were used to photometer all of the available bandpasses. For most objects, the adopted position angle and ellipticity closely agreed with values given in the RC3. Values for these parameters are presented in Table 5.
| OBJECT (1) | l(deg) (2) | b(deg) (3) | FOREGROUND EXTINCTION | D25/2(arcsec) (7) | PA(deg) (8) | b/a (9) | SKY (mag arcsec-2) | |||
| AB (4) | A15 (5) | A25 (6) | µ15 (10) | µ25 (11) | ||||||
| Primary Objects | ||||||||||
| NGC 221... | 121.2 | -22.0 | 0.33 | 0.67 | 0.58 | 261 | 170 | 0.7 | 22.0 | 24.1 |
| NGC 224... | 121.2 | -21.6 | 0.33 | 0.67 | 0.58 | 5704 | 35 | 0.3 | 22.3a | 25.4a |
| NGC 598... | 133.6 | -31.3 | 0.19 | 0.38 | 0.33 | 2119 | 23 | 0.6 | 22.3 | 24.7 |
| NGC 628... | 138.6 | -45.7 | 0.13 | 0.26 | 0.23 | 313 | 25 | 0.9 | 23.9 | 24.5 |
| NGC 1068... | 172.1 | -51.9 | 0.05 | 0.10 | 0.09 | 212 | 70 | 0.9 | 22.4 | 25.3 |
| NGC 1275... | 150.6 | -13.3 | 0.75 | 1.51 | 1.31 | 65 | 110 | 0.8 | 23.3 | 25.4 |
| NGC 1316... | 240.2 | -56.7 | 0.0 | 0.0 | 0.0 | 360 | 50 | 0.7 | 23.4 | 25.1 |
| NGC 1317... | 240.0 | -56.7 | 0.0 | 0.0 | 0.0 | 82 | 78 | 0.9 | 23.5 | 25.3 |
| NGC 1399... | 236.7 | -53.6 | 0.0 | 0.0 | 0.0 | 207 | ... | 1.0 | 23.4 | 25.2 |
| NGC 1404... | 237.0 | -53.6 | 0.0 | 0.0 | 0.0 | 99 | ... | 1.0 | 23.5 | 25.5 |
| NGC 2146... | 135.7 | 24.9 | 0.33 | 0.67 | 0.58 | 180 | 135 | 0.6 | 24.0 | 25.8 |
| NGC 2992... | 249.7 | 28.8 | 0.27 | 0.54 | 0.47 | 106 | 15 | 0.3 | 22.3 | 26.0 |
| NGC 2993... | 249.8 | 28.8 | 0.27 | 0.54 | 0.47 | 40 | 95 | 0.7 | 22.1 | 25.4 |
| NGC 3031... | 142.1 | 40.9 | 0.16 | 0.32 | 0.28 | 806 | 157 | 0.5 | 24.4 | 25.8 |
| NGC 3034... | 141.4 | 40.6 | 0.13 | 0.26 | 0.23 | 336 | 65 | 0.4 | 24.2 | 24.7 |
| UGC 5336... | 142.0 | 41.1 | 0.16 | 0.32 | 0.28 | 75 | ... | 1.0 | 26.3 | 25.3 |
| UGC 6697... | 234.1 | 73.0 | 0.0 | 0.0 | 0.0 | 56 | 137 | 0.2 | 22.5 | 0b
|
| NGC 4151... | 155.1 | 75.1 | 0.0 | 0.0 | 0.0 | 189 | 50 | 0.7 | 21.9 | 27.6 |
| NGC 4321... | 271.1 | 76.9 | 0.06 | 0.12 | 0.10 | 222 | 30 | 0.9 | 20.0 | 21.6 |
| Secondary Objects | ||||||||||
| Mrk 335... | 108.8 | -41.4 | 0.11 | 0.22 | 0.19 | 9 | ... | 1.0 | 21.6 | 25.0 |
| NGC 891... | 140.4 | -17.4 | 0.32 | 0.65 | 0.56 | 404 | 22 | 0.2 | 23.2 | 25.2 |
| NGC 1267... | 150.4 | -13.4 | 0.75 | 1.51 | 1.31 | 33 | ... | 1.0 | 22.7 | 24.8 |
| NGC 1268... | 150.4 | -13.4 | 0.75 | 1.51 | 1.31 | 29 | 56 | 0.7 | 23.1 | 24.9 |
| NGC 1270... | 150.5 | -13.4 | 0.75 | 1.51 | 1.31 | 44 | 15 | 0.8 | 23.0 | 25.1 |
| NGC 1272... | 150.5 | -13.3 | 0.75 | 1.51 | 1.31 | 61 | ... | 1.0 | 23.0 | 25.0 |
| NGC 1273... | 150.5 | -13.3 | 0.75 | 1.51 | 1.31 | 33 | ... | 1.0 | 22.9 | 25.3 |
| UGC 2665... | 150.5 | -13.2 | 0.75 | 1.51 | 1.31 | 31 | 122 | 0.4 | 22.8 | 25.5 |
| NGC 1277... | 150.6 | -13.2 | 0.75 | 1.51 | 1.31 | 29 | ... | 1.0 | 22.9 | 25.1 |
| NGC 1278... | 150.6 | -13.2 | 0.75 | 1.51 | 1.31 | 46 | ... | 1.0 | 22.9 | 25.2 |
| NGC 1282... | 150.7 | -13.3 | 0.75 | 1.51 | 1.31 | 42 | 25 | 0.8 | 23.2 | 25.4 |
| NGC 1396... | 236.7 | -53.7 | 0.0 | 0.0 | 0.0 | 30 | ... | 1.0 | 23.4 | 25.3 |
| NGC 2551... | 141.0 | 32.5 | 0.07 | 0.14 | 0.12 | 50 | 55 | 0.7 | 23.4 | 28.3 |
| NGC 3837... | 234.4 | 72.9 | 0.0 | 0.0 | 0.0 | 19 | ... | 1.0 | 22.6 | 26.5 |
| MCG 3-30-71... | 234.8 | 72.9 | 0.0 | 0.0 | 0.0 | 26 | ... | 1.0 | 23.2 | 26.5 |
| NGC 3842... | 234.3 | 73.0 | 0.0 | 0.0 | 0.0 | 42 | 5 | 0.7 | 23.1 | 25.2 |
| CGCG 97-114... | 235.1 | 73.0 | 0.0 | 0.0 | 0.0 | 3 | ... | 1.0 | 22.6 | 24.6 |
| NGC 4156... | 154.8 | 75.0 | 0.0 | 0.0 | 0.0 | 42 | ... | 1.0 | 21.9 | 26.2 |
| UGC 7188... | 154.7 | 75.2 | 0.0 | 0.0 | 0.0 | 31 | ... | 1.0 | 22.1 | 24.4 |
| NGC 4470... | 287.0 | 70.0 | 0.0 | 0.0 | 0.0 | 39 | 0 | 0.7 | 19.1 | 21.1 |
| NGC 4472... | 286.9 | 70.2 | 0.0 | 0.0 | 0.0 | 306 | 155 | 0.8 | 19.1 | 21.4 |
| NGC 4476... | 283.1 | 74.4 | 0.10 | 0.20 | 0.17 | 51 | 25 | 0.7 | 22.9 | 22.8 |
| NGC 4478... | 283.4 | 74.4 | 0.10 | 0.20 | 0.17 | 57 | 140 | 0.9 | 22.6 | 22.3 |
| NGC 4486... | 283.8 | 74.5 | 0.0 | 0.0 | 0.0 | 249 | ... | 1.0 | 22.3 | 22.1 |
Notes. - Col. (1): Galaxy identification.
Col. (2): Galactic longitude (in units of degrees).
Col. (3): Galactic latitude (in units of degrees).
Col. (4): Foreground extinction in magnitudes in the B
band taken from the
RC3.
All "0" entries are given as zero values in
RC3.
However, as for any value of
AB, there is an ~ 10% uncertainty in the
corresponding UV extinctions.
Col. (5): Foreground extinction in magnitudes in the UIT far-UV
bandpass.
Col. (6): Foreground extinction in magnitudes in the UIT mid-UV
bandpass. Derivation of extinction corrections in the UV bands are
described in
Section 4.5.
Col. (7): Major axis radius at the 25th mag arcsec-2
B-band isophote, obtained from the
RC3,
in units of arcsec.
Col. (8): Position angle adopted for the annular photometry, as
described in Section 4.5. No value is given for
circular annuli.
Col. (9): Minor-to-major axis ratio adopted for the annular photometry,
as described in Section4.5.
Col. (10): Sky background determined for the FUV photometry, as
described in Section4.5. The corresponding
background flux was subtracted from the annular photometry.
Col. (11): Sky background determined for the MUV photometry.
| ||||||||||
Accurate determination of background corrections for the UV photometry is crucial, as the UV background is a function of position in the UIT images and can vary as much as 40% across the image. Background values were determined by taking a sigma-clipped mean value of sky pixels within an irregular polygonal region surrounding each galaxy. The derived backgrounds are presented in Table 5. A detailed discussion of the systematics and origin of the UV sky background as measured from UIT images is given by Waller et al. (1995).
In the case of M31, which completely fills the frame, a background surface brightness of 25.4 mag arcsec-2 was adopted for the MUV image. This value was determined by interpolation of UIT MUV sky backgrounds present at other nearby locations (Waller et al. 1995). However, a similar approach for the FUV images, giving µFUV = 23.3 mag arcsec-2, resulted in an anomalously elevated light profile. A visual inspection of the image frame (Fig. 5a) shows that much of the galaxy away from the central region contains very little extended or diffuse UV emission. Therefore, the minima in the light profile of NGC 224 should be close to the limiting FUV surface brightness of ~ 24.5 mag arcsec-2 (for well-exposed images, as determined from light profiles of other UIT targets). We then forced the dimmest regions in the FUV surface brightness profile (uncorrected for extinction) to equal this limiting magnitude by using a FUV background of 22.3 mag arcsec-2. Although this particular light profile has been adjusted in a somewhat arbitrary manner, the final adopted sky value is consistent with values derived for other UIT frames taken under similar observing conditions (see col. [10], Table 5).
Light from extragalactic sources is affected by foreground dust in the
Milky Way. In Table 5 we list the foreground
extinction values adopted in this paper. These were derived using the
B-band extinctions values, Ab, given in
the
RC3
and the
Cardelli et al. (1989,
hereafter CCM)
Galactic reddening law. The UIT filter functions were convolved with the
CCM
reddening law to derive extinction coefficients in the FUV and MUV
bandpasses. We note that all extinction values in the FUV have intrinsic
errors on the order of ~ 0.1 mag arising from uncertainties in the dust
column along the line of sight. FUV extinctions are determined by
A1500 =
k ×
E(B-V), where
k is the
extinction law coefficient. For the
CCM
law, k1500 = 8.36. Therefore, an uncertainty of
±0.01-0.02 mag in E(B-V), corresponds to an
uncertainty of ~ 0.08-0.12 mag in A1500. Even where
the adopted UV foreground extinction value is 0, residual extinction may
still affect the source. In this Atlas, no corrections for extinction
internal to the galaxies have been applied.
×
E(B-V), where
k is the
extinction law coefficient. For the
CCM
law, k1500 = 8.36. Therefore, an uncertainty of
±0.01-0.02 mag in E(B-V), corresponds to an
uncertainty of ~ 0.08-0.12 mag in A1500. Even where
the adopted UV foreground extinction value is 0, residual extinction may
still affect the source. In this Atlas, no corrections for extinction
internal to the galaxies have been applied.
A complete tabulation of the aperture photometry for each primary object
is given in Appendix B. Total integrated UV
and optical magnitudes for all primary and secondary targets are listed
in Table 6. Both apparent (first line) and
absolute (second line) magnitudes are given for each galaxy. These
magnitudes represent the total flux contained within a radius (col. [2])
at which the surface brightness profile flattens. Where we lacked
optical imagery for a particular filter, a value was taken from
Prugniel &
Heraudeau (1998).
These values are noted in the table and should be used with caution,
since the literature photometry was not derived using the star masks
employed in the atlas photometry. Columns (9)-(12) of
Table 6 list the total UV to optical colors for
each system (line 1). These values were constructed from the total
integrated magnitudes. Column (13) is the ratio of FUV flux (ergs
s-1 cm-2 Å-1) to
H flux (ergs s-1
cm-2). All magnitudes and colors in
Table 6 have been corrected for foreground dust
extinction, using the extinction parameters given in
Table 5. Uncalibrated data in
Table 6 are indicated by footnotes. Associated 1
 photometric uncertainties
are given in parentheses.
photometric uncertainties
are given in parentheses.
| Object (1) | r (2) | m(15)0 M(15)0 (3) | m(25)0 M(25)0 (4) | m(B)0 M(B)0 (5) | m(V)0 M(V)0 (6) | m(R)0 M(R)0 (7) | log10
f(H)0 log10L(H )0(8) | (15-25)0 (9) | (25-R)0 (10) | (B-V)0 (11) | (B-R)0 (12) | (f15/fH)0a (13) |
| Primary Objects | ||||||||||||
| NGC 221... | 86.9 | 12.98 | 11.31 | ... | ... | ... | ... | 1.67 | ... | ... | ... | ... |
| | | -11.43 | -13.10 | ... | ... | ... | ... | (0.08) | ... | ... | ... | ... |
| | | (0.08) | (0.05) | ... | ... | ... | ... | | | | | |
| NGC 224... | 3208 | ...b | ...b | ... | ... | ... | ... | ...b | ... | ... | ... | ... |
| NGC 598... | 2033 | 4.91c | 5.95c | 6.10d | 5.59d | 5.82c | -9.22c | -1.04c | 0.13c | 0.51d | 0.28d | 0.066c |
| | | -19.71c | -18.67c | -18.52d | -19.03d | -18.80c | 16.29c | (0.06) | (0.05) | (0.05) | (0.05) | (0.004) |
| | | (0.06) | (0.05) | (0.05) | (0.05) | (0.05) | (0.02) | | | | | |
| NGC 628... | 349 | 9.43 | 9.90 | 9.89 | 9.36 | 8.97 | -10.80 | -0.47 | 0.93 | 0.53 | 0.92 | 0.039 |
| | | -19.97 | -19.50 | -19.52 | -20.05 | -20.44 | 15.67 | (0.15) | (0.06) | (0.05) | (0.05) | (0.005) |
| | | (0.15) | (0.05) | (0.05) | (0.05) | (0.05) | (0.02) | | | | | |
| NGC 1068... | 264 | 10.34 | 10.29 | 9.80 | 9.03 | 8.22 | -12.67 | 0.05 | 2.07 | 0.77 | 1.58 | 1.255 |
| | | -20.58 | -20.63 | -21.13 | -21.89 | -22.70 | 14.10 | (0.05) | (0.05) | (0.08) | (0.06) | (0.058) |
| | | (0.05) | (0.05) | (0.05) | (0.06) | (0.05) | (0.02) | | | | | |
| NGC 1275... | 89.7 | 11.57 | 12.25 | 11.93 | 11.26 | 10.70 | ... | -0.68 | 1.55 | 0.68 | 1.23 | ... |
| |
| -22.70 | -22.02 | -22.34 | -23.02 | -23.57 | ... | (0.07) | (0.07) | (0.09) | (0.10) | ... |
| | | (0.07) | (0.05) | (0.08) | (0.05) | (0.06) | ... | | | | | |
| NGC 1316... | 281 | 13.97 | 11.94 | 9.81c | 8.87c | 8.31c | NCe | 2.04 | 3.63c | 0.94c | 1.50c | NC |
| | | -17.18 | -19.22 | -21.34c | -22.28c | -22.84c | NC | (0.20) | (0.08) | (0.05) | (0.05) | ... |
| | | (0.19) | (0.07) | (0.05) | (0.05) | (0.05) | ... | | | | | |
| NGC 1317... | 107 | 13.26 | 13.60 | 11.99 | 11.07 | 10.44 | -12.15 | -0.34 | 3.16 | 0.92 | 1.55 | 0.025 |
| | | -17.90 | -17.55 | -19.17 | -20.08 | -20.71 | 14.67 | (0.05) | (0.05) | (0.05) | (0.05) | (0.001) |
| | | (0.05) | (0.05) | (0.05) | (0.05) | (0.05) | (0.02) | | | | | |
| NGC 1399... | 190 | 12.82 | 12.95 | 10.79 | 9.77f | 9.35f | ... | -0.13 | 3.60 | 1.02 | 1.44 | ... |
| | | -18.32 | -18.19 | -20.35 | -21.37f | -21.79f | ... | (0.05) | (0.05) | (0.05) | (0.05) | ... |
| | | (0.05) | (0.05) | (0.05) | (0.05) | (0.05) | ... | | | | | |
| NGC 1404... | 99.6 | 14.00 | 13.43 | ... | 10.19d | ... | ... | 0.56 | ... | ... | ... | ... |
| | | -17.14 | -17.71 | ... | -20.95d | ... | ... | (0.08) | ... | ... | ... | ... |
| | | (0.07) | (0.05) | ... | (0.05) | ... | ... | | | | | |
| NGC 2146... | 291 | ... | 12.59 | 11.13 | 10.38d | 9.89 | -11.11 | ... | 2.70 | 0.75d | 1.24 | ... |
| | | ... | -18.11 | -19.57 | -20.32d | -20.81 | 15.62 | ... | (0.18) | (0.05) | (0.05) | ... |
| | | ... | (0.18) | (0.05) | (0.05) | (0.05) | (0.04) | | | | | |
| NGC 2992... | 74.4 | ... | 14.44 | 12.97 | 12.09 | 11.53 | -11.93 | ... | 2.91 | 0.87 | 1.44 | ... |
| | | ... | -17.86 | -19.34 | -20.21 | -20.78 | 15.12 | ... | (0.15) | (0.05) | (0.05) | ... |
| | | ... | (0.15) | (0.05) | (0.05) | (0.05) | (0.02) | | | | | |
| NGC 2993... | 75.9 | 11.36 | 12.09 | 12.87 | 12.53 | 12.14 | -11.60 | -0.73 | -0.05 | 0.34 | 0.72 | 0.041 |
| | | -20.95 | -20.21 | -19.44 | -19.77 | -20.16 | 15.45 | (0.06) | (0.05) | (0.05) | (0.05) | (0.002) |
| | | (0.05) | (0.05) | (0.05) | (0.05) | (0.05) | (0.02) | | | | | |
| NGC 3031... | 750 | 9.20 | 8.95 | 7.91c | 7.01c,f | 6.55 | -12.46c,f | 0.25 | 2.40 | 0.90c | 1.36c | 2.188c |
| | | -18.58 | -18.83 | -19.88c | -20.77c,f | -21.23 | 13.68c,f | (0.33) | (0.05) | (0.08) | (0.05) | (0.665) |
| | | (0.33) | (0.05) | (0.05) | (0.07) | (0.05) | (0.02) | | | | | |
| NGC 3034... | 529 | ... | 10.64 | 8.88c | 8.14 | 7.54c | -9.82c | ... | 3.10c | 0.74c | 1.33c | ... |
| | | ... | -17.14 | -18.91c | -19.64 | -20.24c | 16.32c | ... | (0.09) | (0.05) | (0.05) | ... |
| | | ... | (0.08) | (0.05) | (0.05) | (0.05) | (0.02) | | | | | |
| UGC 5336... | 99.3 | 13.24 | 13.79 | 14.66c | 14.51d | 14.02 | ... | -0.55 | -0.23 | 0.15d | 0.64c | ... |
| | | -14.54 | -14.00 | -13.12c | -13.27d | -13.76 | ... | (0.51) | (0.15) | (0.08) | (0.09) | ... |
| | | (0.49) | (0.14) | (0.08) | (0.05) | (0.06) | ... | | | | | |
| UGC 6697... | 63.9 | 12.86 | 13.33 | 14.32 | 13.68d | 13.62 | ... | -0.47 | -0.30 | 0.64d | 0.69 | ... |
| | | -21.81 | -21.35 | -20.36 | -20.99d | -21.05 | ... | (0.07) | (0.05) | (0.05) | (0.05) | ... |
| | | (0.06) | (0.05) | (0.05) | (0.05) | (0.05) | ... | | | | | |
| NGC 4151... | 241 | 10.26 | 11.11 | 11.12 | 10.55 | 10.03 | NC | -0.85 | 1.08 | 0.57 | 1.09 | NC |
| | | -20.41 | -19.55 | -19.55 | -20.12 | -20.64 | NC | (0.05) | (0.05) | (0.07) | (0.05) | ... |
| | | (0.05) | (0.05) | (0.05) | (0.05) | (0.05) | ... | | | | | |
| NGC 4321... | 274 | 9.47 | 10.28 | 10.26 | 9.63 | 9.10 | -11.16 | -0.81 | 1.18 | 0.64 | 1.17 | 0.085 |
| | | -21.55 | -20.74 | -20.76 | -21.39 | -21.92 | 15.63 | (0.31) | (0.24) | (0.05) | (0.05) | (0.017) |
| | | (0.20) | (0.24) | (0.05) | (0.05) | (0.05) | (0.03) | | | | | |
| Secondary Objects | ||||||||||||
| Mrk 335... | 24.6 | 11.38 | 12.35 | ... | ... | ... | ... | -0.97 | ... | ... | ... | ... |
| | | -23.73 | -22.76 | ... | ... | ... | ... | (0.05) | ... | ... | ... | ... |
| | | (0.05) | (0.05) | ... | ... | ... | ... | | | | | |
| NGC 891... | 302 | ... | 13.00 | ... | ... | NC | -11.32 | ... | NC | ... | NC | ... |
| | | ... | -16.73 | ... | ... | NC | 15.21 | ... | ... | ... | ... | ... |
| | | ... | (0.23) | ... | ... | ... | (0.02) | | | | | |
| NGC 1267... | 28.7 | ... | 15.80 | 13.59d | 12.61d | ... | ... | ... | ... | 0.98d | ... | ... |
| | | ... | -18.47 | -20.68d | -21.66d | ... | ... | ... | ... | (0.05) | ... | ... |
| | | ... | (0.15) | (0.05) | (0.05) | ... | ... | | | | | |
| NGC 1268... | 28.7 | ... | 15.20 | ... | ... | ... | ... | ... | ... | ... | ... | ... |
| | | ... | -17.96 | ... | ... | ... | ... | ... | ... | ... | ... | ... |
| | | ... | (0.14) | ... | ... | ... | ... | | | | | |
| NGC 1270... | 52.4 | ... | 17.02 | 13.62 | 12.63c | 12.02c | ... | ... | 5.00c | 0.99c | 1.60c | ... |
| | | ... | -17.25 | -20.65 | -21.64c | -22.25c | ... | ... | (0.27) | (0.09) | (0.10) | ... |
| | | ... | (0.26) | (0.08) | (0.05) | (0.06) | ... | | | | | |
| NGC 1272... | 85.3 | ... | 16.84 | 12.70 | 11.60 | 11.05 | ... | ... | 5.80 | 1.10 | 1.65 | ... |
| | | ... | -17.43 | -21.58 | -22.67 | -23.22 | ... | ... | (0.28) | (0.09) | (0.10) | ... |
| | | ... | (0.27) | (0.08) | (0.05) | (0.06) | ... | | | | | |
| NGC 1273... | 48.9 | ... | 17.24 | 13.71 | 12.77 | 12.15 | ... | ... | 5.09 | 0.94 | 1.56 | ... |
| | | ... | -17.03 | -20.56 | -21.51 | -22.12 | ... | ... | (0.26) | (0.09) | (0.10) | ... |
| | | ... | (0.25) | (0.08) | (0.05) | (0.06) | ... | | | | | |
| UGC 2665... | 42.6 | ... | 15.56 | 14.68 | 13.99 | ... | ... | ... | ... | 0.69 | ... | ... |
| | | ... | -19.52 | -20.41 | -21.10 | ... | ... | ... | ... | (0.09) | ... | ... |
| | | ... | (0.10) | (0.08) | (0.05) | ... | ... | | | | | |
| NGC 1277... | 20.6 | ... | 17.34 | 14.14 | 13.15 | 12.60 | ... | ... | 4.75 | 0.99 | 1.55 | ... |
| | | ... | -16.93 | -20.13 | -21.12 | -21.68 | ... | ... | (0.42) | (0.09) | (0.10) | ... |
| | | ... | (0.42) | (0.08) | (0.05) | (0.06 ) | ... | | | | | |
| NGC 1278... | 54.5 | ... | 16.59 | 13.23 | 12.17 | 11.61 | ... | ... | 4.97 | 1.07 | 1.62 | ... |
| | | ... | -17.69 | -21.04 | -22.11 | -22.66 | ... | ... | (0.23) | (0.09) | (0.10) | ... |
| | | ... | (0.23) | (0.08) | (0.05) | (0.06) | ... | | | | | |
| NGC 1282... | 58.4 | ... | 17.14 | 13.36 | 12.44 | 11.88 | ... | ... | 5.26 | 0.92 | 1.48 | ... |
| | | ... | -15.29 | -19.07 | -19.99 | -20.55 | ... | ... | (0.24) | (0.09) | (0.10) | ... |
| | | ... | (0.23) | (0.08) | (0.05) | (0.06) | ... | | | | | |
| NGC 1396... | 23.9 | ... | 17.90 | ... | 14.65d | ... | ... | ... | ... | ... | ... | ... |
| | | ... | -13.24 | ... | -16.49d | ... | ... | ... | ... | ... | ... | ... |
| | | ... | (0.12) | ... | (0.05) | ... | ... | | | | | |
| NGC 2551... | 49.9 | 15.64 | 14.16 | 13.09d | 12.08d | ... | ... | 1.48 | ... | 1.01d | ... | ... |
| | | -16.88 | -18.36 | -19.42d | -20.43d | ... | ... | (0.44) | ... | (0.05) | ... | ... |
| | | (0.44) | (0.06) | (0.05) | (0.05) | ... | ... | | | | | |
| NGC 3837... | 43.5 | ... | 17.57 | 14.38 | 13.39d | 12.98 | ... | ... | 4.59 | 0.99d | 1.40 | ... |
| | | ... | -17.10 | -20.29 | -21.28d | -21.69 | ... | ... | (0.76) | (0.05) | (0.05) | ... |
| | | ... | (0.76) | (0.05) | (0.05) | (0.05) | ... | | | | | |
| MCG 3-30-71... | 26.1 | 14.79 | 15.29 | 15.69 | 15.40d | 15.12 | ... | -0.50 | 0.16 | 0.29d | 0.56 | ... |
| | | -19.28 | -18.78 | -18.38 | -18.66d | -18.94 | ... | (0.25) | (0.16) | (0.05) | (0.05) | ... |
| | | (0.20) | (0.16) | (0.05) | (0.05) | (0.05) | ... | | | | | |
| NGC 3842... | 58.6 | ... | 15.93 | 13.41 | 12.45d | 12.16 | ... | ... | 3.77 | 0.96d | 1.25 | ... |
| | | ... | -18.75 | -21.26 | -22.22d | -22.51 | ... | ... | (0.38) | (0.05) | (0.05) | ... |
| | | ... | (0.38) | (0.05) | (0.05) | (0.05) | ... | | | | | |
| CGCG 97-114... | 8.1 | 15.89 | 16.30 | ... | ... | ... | ... | -0.41 | ... | ... | ... | ... |
| | | -18.78 | -18.37 | ... | ... | ... | ... | (0.25) | ... | ... | ... | ... |
| | | (0.20) | (0.16) | ... | ... | ... | ... | | | | | |
| NGC 4156... | 50.4 | 14.08 | 15.11 | 14.05 | 13.19 | 12.70 | NC | -1.02 | 2.41 | 0.86 | 1.35 | NC |
| | | -20.70 | -19.68 | -20.74 | -21.60 | -22.09 | NC | (0.13) | (0.10) | (0.07) | (0.05) | ... |
| | | (0.09) | (0.09) | (0.05) | (0.05) | (0.05) | ... | | | | | |
| UGC 7188... | 42.0 | 14.12 | 15.86g
| 15.57 | 15.09 | 14.74 | NC | ...g | ...g | 0.48 | 0.83 | NC |
| | | -16.54 | -14.81g
| -15.10 | -15.58 | -15.93 | NC | ... | ... | (0.10) | (0.08) | ... |
| | | (0.09) | (0.26) | (0.07) | (0.07) | (0.05) | ... | | | | | |
| NGC 4470... | 44.5 | ... | 13.29 | 13.17d | 12.63d | 12.17d | ... | ... | 1.12d | 0.54d | 1.00d | ... |
| | | ... | -17.73 | -17.85d | -18.39d | -18.85d | ... | ... | (0.16) | (0.05) | (0.05) | ... |
| | | ... | (0.16) | (0.05) | (0.05) | (0.05) | ... | | | | | |
| NGC 4472... | 308 | ... | 13.68 | 9.43d | 8.46d | ... | ... | ... | ... | 0.97d | ... | ... |
| | | ... | -17.34 | -21.59d | -22.56d | ... | ... | ... | ... | (0.05) | ... | ... |
| | | ... | (0.14) | (0.05) | (0.05) | ... | ... | | | | | |
| NGC 4476... | 53.5 | ... | 14.72 | 13.18d | 12.33d | 11.91d | ... | ... | 2.81d | 0.85d | 1.27d | ... |
| | | ... | -16.30 | -17.84d | -18.69d | -19.11d | ... | ... | (0.21) | (0.05) | (0.05) | ... |
| | | ... | (0.21) | (0.05) | (0.05) | (0.05) | ... | | | | | |
| NGC 4478... | 61.4 | 16.69 | 15.06 | 12.28d | 11.42d | 10.78d | ... | 1.63 | 4.28d | 0.86d | 1.50d | ... |
| | | -14.33 | -15.96 | -18.74d | -19.60d | -20.24d | ... | (0.79) | (0.17) | (0.05) | (0.05) | ... |
| | | (0.78) | (0.17) | (0.05) | (0.05) | (0.05) | ... | | | | | |
| NGC 4486... | 301 | 13.12 | 12.66 | 9.87 | 8.94 | 8.26 | ... | 0.46 | 4.41 | 0.94 | 1.62 | ... |
| | | -17.90 | -18.36 | -21.15 | -22.08 | -22.76 | ... | (0.17) | (0.09) | (0.09) | (0.08) | ... |
| | | (0.15) | (0.08) | (0.07) | (0.05) | (0.05) | ... | | | | | |
Notes. - Col. (1) Galaxy Identification.
Col. (2) Radius (in arcsec) within which the total integrated
magnitudes are measured.
Cols. (3)-(7) First line shows the total apparent magnitudes within the
listed bandpasses as defined in Section 4.5. Second
line shows the total absolute magnitudes, using the adopted distances
given in
Table 3. Photometric errors, which do not
include uncertainties in calibration or in extinction corrections, are
given in parentheses. All magnitudes presented here have been corrected
for foreground galactic extinction using the extinction estimates
listed in Table 5 and the
Cardelli et al. 1989
reddening law. The R-band filter is calibrated on the Cousins
R system.
Col. (8) First line shows
H | ||||||||||||
No integrated magnitudes are quoted for NGC 224 because the two Astro-1 UIT frames contain only a small fraction of the entire object. A small region of NGC 598 (M33) also extends beyond the data frame; however, we attempted to account for the missing flux by assuming azimuthal symmetry in the radial light profiles.
Foreground stars can be non-negligible contributors to large-aperture
flux measures, especially in the optical bands. Prompted by a desire to
compare UV and optical photometry of galaxies free of field star
contamination, we chose to mask out field stars which affect the
photometry. The R-band images were used to determine coordinates
of superposed field stars, and the
H images were used to
distinguish field stars from H II knots within the galaxy (which were
not masked). Masks of optically bright stars which were not UV sources
were not applied to the UIT images. For all filters except
H, the integrated photometry
presented here has been adjusted for galaxy light which had been masked
out, using the surface brightness profile to interpolate the flux within
masked pixels. In the optical images, typically there were many masked
stars. However, due to the complex, "blobby" morphology of
H emission, we felt that
correcting for masked pixels using this approach would have produced too
large a correction. Therefore, no corrections for masked pixels has been
made in the H data. We
emphasize that the photometry presented here cannot be directly compared
to values in the literature without consideration for the effects of
superposed field stars.
4.6. Length Scales and Light Concentration
Quantitative measures of the light distribution in galaxies are valuable as input into models of galaxy evolution and for intercomparison of local and high-redshift systems (e.g., Abraham 1997). We have derived a set of photometric parameters for the primary atlas sample which quantifies the size and intensity of the global light distribution. In Table 7 we list half-light radii for the available bandpasses. These values were computed assuming that the integrated magnitudes given in Table 6 represent the total luminosities of the galaxy. Growth curves (see Appendix B) were interpolated to yield the radius at which the integrated flux equals half of the total flux for that bandpass.
| Object (1) | r1/2(15) (arcsec) (kpc) (2) | r1/2(25) (arcsec) (kpc) (3) | r1/2(B) (arcsec) (kpc) (4) | r1/2(V) (arcsec) (kpc) (5) | r1/2(R) (arcsec) (kpc) (6) | r1/2(H) (arcsec) (kpc) (7) |
| NGC 221... | 20 | 25 | ... | ... | ... | ... |
| | 0.1 | 0.1 | ... | ... | ... | ... |
| NGC 224... | ...a | ...a | ... | ... | ... | ... |
| | ...a | ...a | ... | ... | ... | ... |
| NGC 598... | 830b | 771b | ... | ... | 642b | 819b |
| | 3.4b | 3.1b | ... | ... | 2.6b | 3.3b |
| NGC 628... | 149 | 139 | 119 | 108 | 106 | 152 |
| | 5.5 | 5.1 | 4.4 | 4.0 | 3.9 | 5.6 |
| NGC 1068... | 19 | 27 | 35 | 37 | 32 | 6 |
| | 1.4 | 2.0 | 2.6 | 2.8 | 2.4 | 0.4 |
| NGC 1275... | 17 | 17 | 22 | 24 | 25 | ... |
| | 5.9 | 5.7 | 7.6 | 8.5 | 8.8 | ... |
| NGC 1316... | 29 | 62 | 53b | 52b | 52b | 26 |
| | 2.4 | 5.1 | 4.4b | 4.3b | 4.3b | 2.1 |
| NGC 1317... | 13 | 14 | 24 | 25 | 26 | 12 |
| | 1.1 | 1.2 | 2.0 | 2.0 | 2.1 | 1.0 |
| NGC 1399... | 13 | 22 | 36 | 53c | 43c | ... |
| | 1.1 | 1.8 | 2.9 | 4.3c | 3.6c | ... |
| NGC 1404... | 14 | 21 | ... | ... | ... | ... |
| | 1.1 | 1.7 | ... | ... | ... | ... |
| NGC 2146... | ... | 70 | 75 | ... | 63 | 26 |
| | ... | 4.7 | 5.0 | ... | 4.2 | 1.8 |
| NGC 2992... | ... | 25 | 28 | 26 | 24 | 10 |
| | ... | 3.5 | 3.9 | 3.6 | 3.4 | 1.4 |
| NGC 2993... | 10 | 9 | 11 | 12 | 12 | 5 |
| | 1.4 | 1.3 | 1.5 | 1.7 | 1.6 | 0.7 |
| NGC 3031... | 410 | 375 | 209b | 192b,c | 159 | 380b,c |
| | 7.2 | 6.5 | 3.7b | 3.3b,c | 2.8 | 6.6b,c |
| NGC 3034... | ... | 113 | 107b | 93 | 92b | 72b |
| | ... | 2.0 | 1.9b | 1.6 | 1.6b | 1.3b |
| UGC 5336... | 43 | 43 | 41b | ... | 43 | ... |
| | 0.8 | 0.8 | 0.7b | ... | 0.8 | ... |
| UGC 6697... | 31 | 31 | 23 | ... | 21 | ... |
| | 13 | 13 | 9.5 | ... | 8.8 | ... |
| NGC 4151... | 11 | 7 | 22 | 48 | 36 | 13c |
| | 0.7 | 0.5 | 1.5 | 3.1 | 2.4 | 0.9c |
| NGC 4321... | 96 | 82 | 97 | 94 | 95 | 90 |
| | 7.4 | 6.4 | 7.5 | 7.3 | 7.4 | 69. |
Notes. - Col. (1) Galaxy identification.
Cols. (2)-(7) First line shows the radius (in units of arcsec)
enclosing half the light within the listed bandpass. Second line is the
same as above, but in units of kpc, using adopted distances given in
Table 3.
| ||||||
In Table 8 we present two measures of the light concentration in the primary galaxies. Central surface brightness (cols. [2]-[7]) is defined here as the mean surface brightness within the central one kiloparsec-diameter region of the galaxy. For a few distant systems the adopted physical size corresponded to an angular size which was less than the size of the smallest synthetic aperture; these values are noted in the table. All values in Table 8 have been corrected for foreground extinction, as described previously.
| OBJECT (1) | CENTRAL SURFACE BRIGHTNESS | SURFACE BRIGHTNESS AT r1/2 | ||||||||||
| (µ15)0 (2) | (µ25)0 (3) | (µB)0 (4) | (µV)0 (5) | (µR)0 (6) | (µH)0 (7) | (µ15)0 (8) | (µ25)0 (9) | (µB)0 (10) | (µV)0 (11) | (µR)0 (12) | (µH)0 (13) | |
| NGC 221 | 21.81 | 21.92 | ... | ... | ... | ... | 21.07 | 19.99 | ... | ... | ... | ... |
| NGC 224 | 20.83 | 20.33 | ... | ... | ... | ... | ...a | ...a | ... | ... | ... | ... |
| NGC 598 | 19.90 | 20.75 | ... | ... | 20.14 | -15.20 | 20.89b | 21.80b | ... | ... | 21.29b | -15.61b |
| NGC 628 | 21.18 | 21.40 | 20.31 | 19.55 | 19.08 | -15.63 | 22.15 | 22.51 | 22.16 | 21.43 | 21.00 | -15.92 |
| NGC 1068 | 17.43 | 18.16 | 17.37 | 16.70 | 15.46 | -15.00 | 18.49 | 19.22 | 19.33 | 18.72 | 17.57 | -14.95 |
| NGC 1275 | 17.86c | 18.36c | 18.01c | 17.57c | 17.09c | ... | 19.37 | 20.02 | 20.35 | 19.90 | 19.42 | ... |
| NGC 1316 | 21.50 | 20.31 | 17.50 | 16.48 | 15.88 | NCd | 22.85 | 22.52 | 20.05b | 19.07b | 18.50b | NC |
| NGC 1317 | 21.02 | 21.23 | 18.90 | 17.92 | 17.22 | -14.72 | 20.70 | 21.20 | 20.66 | 19.76 | 19.31 | -14.97 |
| NGC 1399 | 19.48 | 20.32 | 18.43 | 19.21ce | 18.65ce | ... | 20.36 | 21.67 | 20.55 | 20.37 | 19.55 | ... |
| NGC 1404 | 20.71 | 20.73 | ... | ... | ... | ... | 21.59 | 22.01 | ... | ... | ... | ... |
| NGC 2146 | ... | 22.04 | 20.13 | ... | 18.14 | -13.92 | ... | 23.17 | 21.87 | ... | 20.26 | -14.49 |
| NGC 2992 | ... | 21.30 | 19.23 | 18.00 | 17.17 | -13.58 | ... | 22.11 | 20.90 | 19.87 | 19.15 | -14.18 |
| NGC 2993 | 16.92 | 17.63 | 18.26 | 18.03 | 17.69 | -13.53 | 17.85 | 18.55 | 19.57 | 19.51 | 19.05 | -13.64 |
| NGC 3031 | 21.68 | 20.74 | 18.37 | 17.50e | 16.79 | -17.50e | 23.51 | 23.11 | 20.79b | 19.69b | 18.85 | -18.14b |
| NGC 3034 | ... | 21.25 | 19.33 | 18.37 | 17.64 | -13.63 | ... | 21.85 | 19.97b | 18.93 | 18.31b | -13.91b |
| UGC 5336 | 22.97 | 23.69 | 24.47 | ... | 23.93 | ... | 23.38 | 23.96 | 24.69b | ... | 24.20 | ... |
| UGC 6697 | 20.12c | 20.76c | 20.83c | ... | 19.93c | ... | 20.36 | 20.83 | 21.17 | ... | 20.30 | ... |
| NGC 4151 | 16.36 | 16.97 | 17.32 | 17.76 | 16.81 | NC | 16.91 | 16.81 | 19.37 | 20.52 | 19.41 | NC |
| NGC 4321 | 18.51 | 18.85 | 19.06 | 18.35 | 17.78 | -14.53 | 21.15 | 21.67 | 22.01 | 21.27 | 20.77 | -15.79 |
Notes. - Col. (1) Galaxy identification.
Cols. (2)-(5) Central surface brightness (mag arcsec-2) of
the listed bandpass, as defined in Section 4.5.
These values have been corrected for foreground galactic
extinction using the extinction extimates listed in
Table 5 and the
Cardelli et al. 1989
reddening law. The R-band is calibrated on the Cousins-R
system.
Col. (6) H | ||||||||||||
Effective surface brightness, listed in columns (8)-(13), is defined here as the surface brightness of a source within the half-light radius listed in Table 7. These values were determined by the total flux within the half-light radius divided by the corresponding area. Uncalibrated data presented in Table 8 are indicated by footnotes.