


Here we provide examples of deriving reddening and underlying
stellar absorption from emission line spectra. We take as a
examples, the observations of SBS1159+545, SBS1415+437,
and SBS1420+544 as reported in IT98. These three spectra are
all reported with very high accuracy; the brightest lines
are reported with errors of less than one percent. Since the
emission line equivalent widths for all of the Balmer lines
are required as input and since only the emission line equivalent
width for H is reported, we
have had to estimate these
from the relative line strengths and the spectra shown in
figures. The fractional uncertainties in the equivalent widths
were assumed to be twice as large as the fractional uncertainties
reported in the relative intensities.
is reported, we
have had to estimate these
from the relative line strengths and the spectra shown in
figures. The fractional uncertainties in the equivalent widths
were assumed to be twice as large as the fractional uncertainties
reported in the relative intensities.
We used the values reported in
IT98 and calculated C(H) and
aHI for the three
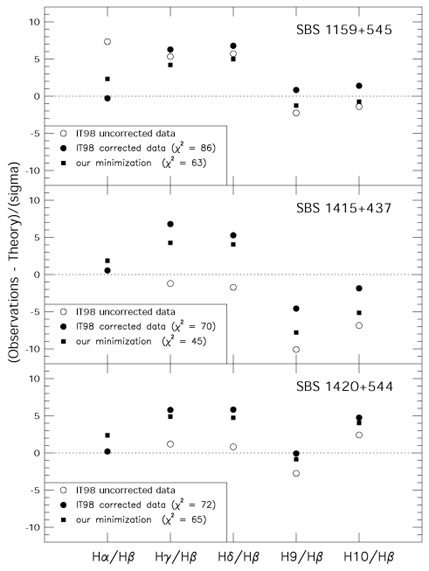
targets. Our results are shown in Figure B-1.
Here we display
the originally observed Balmer line ratios, the corrected ratios
reported in IT98 and our own solutions. There are two important
points to note. First note that the IT98 corrected values for the
H /
H and
H
/
H and
H /
H ratios are several
/
H ratios are several
 away from the theoretical values. In the case of SBS 1159+545,
this is because these ratios were already higher than the theoretical
ratios, and correcting for reddening and underlying absorption only
increases the ratios. In the other two cases, the original ratios
were very close to the theoretical ratios, but correcting the
H
away from the theoretical values. In the case of SBS 1159+545,
this is because these ratios were already higher than the theoretical
ratios, and correcting for reddening and underlying absorption only
increases the ratios. In the other two cases, the original ratios
were very close to the theoretical ratios, but correcting the
H /
H ratio for reddening has
caused these ratios to
exceed their theoretical ratios. Since the deviations from the
theoretical line ratios are large (yielding generally high values of
the
/
H ratio for reddening has
caused these ratios to
exceed their theoretical ratios. Since the deviations from the
theoretical line ratios are large (yielding generally high values of
the  2), we conclude
that the uncertainties
in the reported emission lines are underestimated.
2), we conclude
that the uncertainties
in the reported emission lines are underestimated.
|
Figure B-1. A comparison of the observed
and corrected
hydrogen Balmer emission line ratios for three blue compact galaxies
from the sample of IT98. The open circles show the deviations of
the original observations from the theoretical ratios in terms of the
uncertainties in the final reported corrected values
(the H |
The second point to note in Figure B-1 is the
difference between our
solutions are those of IT98. In all three cases, the IT98 solution
yields very good agreement with theory in the
H /
H
ratio (better than ours) but not as good in the other lines. It would
appear that the weighting scheme used by IT98 favors this line ratio
more than would be called for by the relative errors in the line ratios.