


1.4. Distribution of Matter in the Universe
The task of determining and quantifying the 3-dimensional distribution of extragalactic objects, is not a trivial. Limitations are imposed on us by our position in space-time, and also the fact that we are located in the plane of a dusty spiral galaxy, which means that the light-absorbing interstellar dust will cause the magnitudes and sizes of galaxies to decrease, especially if we observe towards the Galactic plane.
Generally in order to be able to quantify the geometry and topology of the large-scale structure of the Universe and to discriminate between the competing scenarios of structure formation, two at least issues should be addressed:
(a) The quantification, in an objective manner, of the observed structure on large scales. For this we need to observe the positions and redshifts of galaxies tracing large-volumes, large enough to be considered a fair sample of the Universe. If not we can be influenced by local anomalies (like a local attractor or a local underdense region) and thus the interpretation of our results could lead us to erroneous conclusions. Today there are large samples available, complete to some apparent magnitude limit which are deep enough for volume-limited samples to be extracted from them (for example the PSCZ, ORS, LAS CAMPANAS, APM, SSRS, 2dF, SDSS catalogues).
(b) The application of well defined and easily applicable statistics, which are able to distinguish between the different theoretical scenarios of structure formation and to compare between these scenarios and the observed topology and geometry of the large-scale structure of the Universe.
Of historical interest are the first attempts to quantify the
distribution of galaxies by Bok and Mowbray (in the mid 1930s). They
compared the variance of galaxy counts N with that expected from a
Poisson distribution (ie, compared <N>1/2 with

 [1 / M
 (Ni -
<N>)2]1/2,
where M is the number of fields) and concluded that
>>
<N>1/2 an
indication that galaxies cluster. More sophisticated statistics
appear in
the mid-50's when the large Lick galaxy counting project started giving
its first results (cf.
[114]).
Through the years a wide variety of statistical
techniques have been developed in order to study the geometry and
topology of the distribution of matter on large-scales (for reviews see
[22]
[34]).
(Ni -
<N>)2]1/2,
where M is the number of fields) and concluded that
>>
<N>1/2 an
indication that galaxies cluster. More sophisticated statistics
appear in
the mid-50's when the large Lick galaxy counting project started giving
its first results (cf.
[114]).
Through the years a wide variety of statistical
techniques have been developed in order to study the geometry and
topology of the distribution of matter on large-scales (for reviews see
[22]
[34]).
Galaxies: Galaxies are the basic units of the distribution of matter in the universe. They are conglomerations of stars, dust and gas having typical sizes of a few kpc. Only recently, in the 1920s, was it realized that the fuzzy nebulae, that we now know to be galaxies, were not part of the Milky-Way. There appear to be many different types of galaxies, having different shapes, amounts of gas and dust, as well as star-forming regions. Many attempts have been made to produce a reliable classification scheme that bears relation to physical quantities. Galaxies come into three main categories: ellipticals, spirals and irregulars, in which the basic difference, as their names imply, is their apparent shape. However, further subdivision is essential in order to classify reliably the large variety of galaxies.
The first attempt to classify galaxies was that of Hubble in 1926. His principal morphological classification was provided by the "tuning-fork" diagram, in which the position of a galaxy was determined by the size of its nucleus and on the spiral arm tilt. For historical reasons, galaxies at the left of the diagram are called "early types" while at the right "late types". Although this diagram was produced on the basis of appearance there seem to be a link between morphology and galaxy evolution since the integrated colours and spectral types monotonically increase from left to right ([178] and references therein). The fraction of the different galaxy types is: ~ 10% ellipticals (E), ~ 20% SOs, ~ 65% spirals (S) and ~ 5% irregulars (Irr).
The spiral galaxies consist of three components: disk, bulge and halo. The disk is very thin (a few hundred pc thick). The surface brightness of stars in a typical disk falls exponentially with radius:
| (33) |
where b is the scale-length of the disk (typically ~ 4 kpc). The spiral structure is thought to be the result of rotating density waves which produce shocks in the gas-rich disk which leads to star formation.
The elliptical galaxies however, are ellipsoidal systems with an old population of stars and very little gas. They have a de Vaucouleurs luminosity distribution:

| (34) |
where re is the effective radius enclosing half
of the total light. Therefore
I(r) falls off more slowly than r-2 for
r < re and more rapidly for r >
re
(this formula also fits the bulges of SOs and spirals). The mass of
elliptical galaxies can vary widely; from dwarfs with M ~
107
M to
supergiants with M ~ 1012
M
to
supergiants with M ~ 1012
M
Groups & Clusters of Galaxies: Galaxy clusters occupy a
special position in the hierarchy of cosmic structures in many respects.
Being the largest bound structures in the universe, they contain
hundreds of galaxies, large amounts of Dark Matter (DM) and hot X-ray
emitting gas, and thus can be detected at large redshifts. Therefore, they
appear to be ideal tools for studying large-scale structure, testing
theories of structure formation and extracting invaluable cosmological
information (see recent reviews
[24],
[5])
Groups of galaxies are typically systems that contain
 10 -20 galaxies
(for a recent review see
[105]).
10 -20 galaxies
(for a recent review see
[105]).
There are several classification schemes for clusters. A simple and clear-cut one is between regular and irregular clusters.
 103 / Mpc3), a small fraction of spiral
galaxies ( 20%),
high velocity dispersion
(~ 103 km/sec) and
high X-ray luminosity. The high velocity dispersion as well as
the smooth structure is considered to be evidence that these
clusters are in virial equilibrium (relaxed). About 50% of all
clusters are regulars.
103 / Mpc3), a small fraction of spiral
galaxies ( 20%),
high velocity dispersion
(~ 103 km/sec) and
high X-ray luminosity. The high velocity dispersion as well as
the smooth structure is considered to be evidence that these
clusters are in virial equilibrium (relaxed). About 50% of all
clusters are regulars.
 40%).
40%).
Another distinct class of clusters is those having a central very bright
galaxy (BCG or cD's). The BCG galaxies are giant ellipticals, some with
multiple nuclei (cD's) and masses M
1012
M. There
are different
views regarding their formation history; one advocates that they form by
"galactic cannibalism" where dynamical friction causes cluster galaxies
to spiral towards the cluster core and then strong tidal effects take place
(cf. [101],
[9]),
the other advocates that they form at special locations,
which are the kernels around which clusters will eventually form by
anisotropic accretion of matter (cf.
[184]
and references therein). Furthermore:
 ~ 0.5 and there is
evidence that clusters are more prolate-like
(cf. [12]).
~ 0.5 and there is
evidence that clusters are more prolate-like
(cf. [12]).
For large-scale clustering, dynamical and cosmographical studies, it is extremely important to compile large, whole-sky catalogues of groups and clusters. One of the first and extensively studied such catalogue is the ABELL/ACO catalogue [1], which was based on an eyeball selection procedure from sky survey plates. This all-sky sample contains 4073 rich clusters, nominally complete to a redshift z = 0.2. Its obvious limitations, due to the eyeball selection procedure, were superseded by the objectively selected APM clusters ([42]) which were based on the APM galaxy catalogue containing 4 × 10⁶ galaxies ([96]). This cluster catalogue covers latitudes b < -35° and contains 950 clusters, typically poorer than the ABELL/ACO one's. Furthermore, with the ROSAT whole-sky X-ray survey it was possible to construct X-ray selected cluster catalogues (cf. [51]), which suffer less from projection effects, which can produce phantom clusters. For example the REFLEX X-ray cluster sample contains ~ 450 clusters ([21]).
Superclusters, Filaments & Voids: Superclusters are aggregates of clusters, groups and galaxies. They are the largest, isolated, but dynamically un-relaxed due to their size, objects in the large scale distribution of matter and thus they are ideal probes of the initial conditions that gave rise to them. This fact is because typical peculiar velocities of clusters are vpec ~ 103 km/sec and therefore in a Hubble time (1 / H0) they can move no more than ~ 10 h-1 Mpc, which is substantially smaller than the scale of a typical supercluster. Superclusters can be identified in 3-D catalogues of clusters but also in 2-D projections of galaxy distributions. Regions of high density in clusters can be identified also on the APM galaxy map.
The large scale clustering pattern of galaxies is expected to be characterized by a filamentary and sheet-like distribution (cf. [194], [55], [179]). Indeed many authors have been finding that the vast majority of the superclusters are flattened with a predominance of filament-like shapes (cf. [13] and references therein). Figure 3 shows the 2-dimensional projection of a filamentary supercluster containing 5 APM clusters.
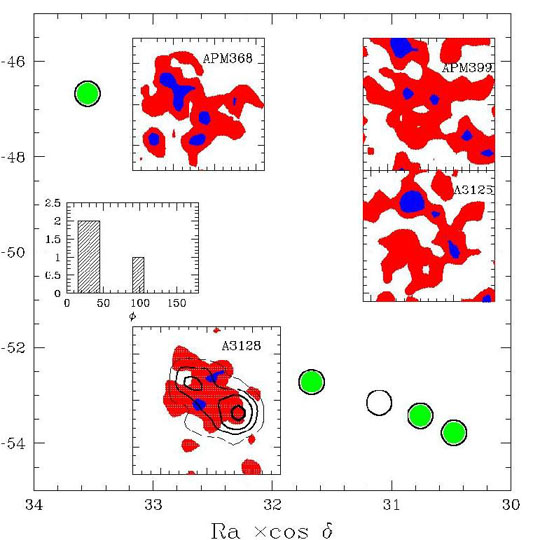
|
Figure 3. (Included separately as a JPG image) An example of a filamentary supercluster: The 2D distribution of APM clusters members. The inserted plots show the smooth 2D galaxy density map of some of the cluster members. For the case of A3128 we overlay the X-ray emission contour plots. The cluster's elongation along the filamentary supercluster is evident. |
Superclusters are not centrally condensed objects (like clusters) and their typical size is ~ 30 -50 h-1 Mpc. However larger structures, with a length ~ 200 h-1 Mpc, may exist (cf. [176] and references therein). Detailed studies have shown that elongated bridges (~ 30 h-1 Mpc) of galaxies have been found to connect rich clusters. Since wide-angle three-dimensional surveys became available, the filamentary distribution of galaxies has been a constantly observed feature. Even the original CFA survey (cf. [72]) showed networks of filaments mostly connecting rich clusters of galaxies and large voids (cf. [116]), a fact which has been confirmed by all the recent surveys (SSRS, ORS, PSCZ etc). Voids are regions of density well below the average value. In all deep radial-velocity surveys, the velocity distribution shows striking empty regions were no (or very few) galaxies exist. It is an extremely difficult task to identify voids in 2-D projections of galaxy distributions since the projection will tend to smooth-out any such structure. An extremely interesting question, relevant to theories of structure formation, is whether the voids are empty of luminous matter or empty of all matter.