


4.5. Optical Selections of Distant Galaxies: "Photo-z's" and
Ly Emission Lines
The case for the use of photometric redshifts - that is, redshifts based upon colors in 2 or (likely) more wave bands - has gradually strengthened since the mid-1990s. Most critically, we now expect fair precision from photometric redshifts and few catastrophic failures.
Stern & Spinrad
(1999)
compare spectroscopic and photometric
redshifts in the HDF. The photometric redshifts are from the Stony
Brook group
(Fernandez-Soto, Lanzetta
& Yahil 1999),
and are
determined by fitting the observed galaxy colors (long wavelengths
only for really distant candidates) with redshifted spectral
templates. These templates may be empirical, synthetic, or a hybrid.
A second approach
(Connolly et al.
1995)
is purely empirical - having
already a relationship between previously-observed galaxy redshifts
and the observed total magnitudes (m) with color information (C) to
boot. Then a derived redshift can be found from the multi-dimensional
(m,C) pairs, used for training. More detail on these "template
fits" can be found in the Stern and Spinrad review. Comparisons
between photometric and spectroscopic determination in the HDF yield
residuals typically around 0.1 for
 z at almost
all redshifts.
z at almost
all redshifts.
Naturally the most important usage of such photometric redshifts is at very faint levels (m > 26.5). These numerous faint galaxies are well beyond the capabilities of 10-m class telescopes for spectroscopic redshifts. The danger here is that galaxies marginally detected in the red-optical I,z bands and perhaps also in J, H, K [1.2, 1.6, 2.2µm] can feign very large redshifts if their signal is just a noise incursion at I or z bands, slightly below the 1 µm observational limit of silicon-based CCDs. Since this topic is close to the kernel of this review, we note that Lanzetta et al. (1999) give some examples of faint, red photometric-z cases of difficult S/N. Their redshifts could exceed 6. Almost all of these ambiguous but potentially exciting cases have yet to be resolved. I speculate that better IR photometry (perhaps using the rejuvenated NICMOS camera on HST) would help in resolving that situation and perhaps suggest targets for future generations of near-IR spectrographs.
There is also a systematic problem at some level with color/redshift degeneracies; blue galaxies in general may show similar colors over a substantial intermediate z range. Prior information like the galaxy apparent magnitude can help decisively. This "Bayesian" procedure is illustrated by Benitez & Broadhurst (1999) for the HDF(N).
My personal recent experience with "I-drops" (implying a galaxy with
only detectable flux at wavelengths above the I band,

 8500 Å at the red
edge) is that many of the spectroscopic
candidates (15 to 20 targets per slitmassk) are very difficult due to
their faintness (z ~ 25-26 mag) at longer wavelengths. A few also
turn out to be low-luminosity galactic stars; these late M, L, and T
class dwarfs turn up rather frequently. Since many of the candidates
come from ground-based imaging, their image structure is not a very
discriminating way to separate stars from QSOs from galaxies.
8500 Å at the red
edge) is that many of the spectroscopic
candidates (15 to 20 targets per slitmassk) are very difficult due to
their faintness (z ~ 25-26 mag) at longer wavelengths. A few also
turn out to be low-luminosity galactic stars; these late M, L, and T
class dwarfs turn up rather frequently. Since many of the candidates
come from ground-based imaging, their image structure is not a very
discriminating way to separate stars from QSOs from galaxies.
Most of the I-drops show a marginally detected red-color continuum,
and thus add little to our initial appraisal. It turns out that
approximately a quarter of the I-drops do eventually yield a redshift;
about a third of these with the continuum discontinuity at
Ly
(0 1216 - the
Ly "forest"). Two-thirds
of the spectroscopically detected I-drop systems (with eventual redshifts)
have a noticeable to strong
Ly emission line. That
usually yields
an unambiguous redshift, as the reader can see with the illustrations
in Weymann et al.
(1998)
and Fig. 4, here, by Spinrad, Stern,
Dawson, Filippenko, and the GOODS team (z = 5.83).
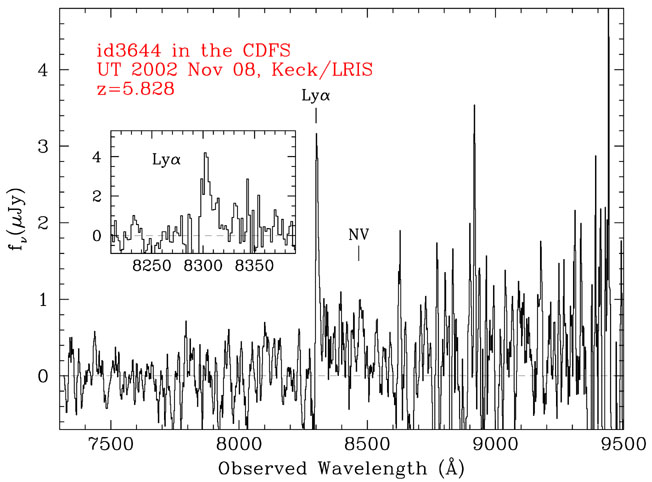 |
Figure 4. A recent Keck spectrogram of a
color-selected (I-drop) faint galaxy. The strong
Ly |
The pairing of a red continuum color, a continuum discontinuity, and a
fairly strong emission line usually signifies a robust
Ly redshift. The
multiple-criteria spectroscopic technique has been
successful to at least z = 5.8 and probably to z =
6.57. It should eventually be pushed to z ~ 9 with the
Ly line at (rest) 12l6
Å, right in the middle of the conventional near-IR J-band. Right now
that is too technically difficult.
As these pages were being written, two preprints crossed our desk. In
the first,
Lehnert & Bremer
(2003)
discovered 6 galaxies at
4.8  z
5.8. These galaxies were
selected as photometric "R-drops" -
that is, with little flux in the R-band and a flat spectrum at longer
wavelengths. Follow-up spectroscopy with the VLT yielded accurate
redshifts for these 6, with fairly strong
Ly emission. Their
largest redshift was z = 5.869 (see
Table 3 in
Section 1.4.7).
z
5.8. These galaxies were
selected as photometric "R-drops" -
that is, with little flux in the R-band and a flat spectrum at longer
wavelengths. Follow-up spectroscopy with the VLT yielded accurate
redshifts for these 6, with fairly strong
Ly emission. Their
largest redshift was z = 5.869 (see
Table 3 in
Section 1.4.7).
The second very timely contribution, by
Kodaira et al.
(2003) (a
Subaru telescope team), used deep narrow-band near-IR images to locate
potentially very distant
Ly galaxies. The group
also obtained a few
spectra which lead to two fairly certain identifications. One line,
with a symmetric line shape, is assumed to be
Ly and in the other
case it appears to be satisfactorily asymmetric, hence reliably
Ly (see
Section 1.4.6 for discussion of this
point). The best
spectrum is of SDFJ 132418.3 at z = 6.578. That would make this
Ly galaxy the largest
redshift of any individual system measured to
date. The redshift is only slightly greater than that of HCM 6 A
(z = 6.56) by
Hu et
al.(2002), and
Hu, Cowie & McMahon
(2002).
These very contemporary detections of galaxies beyond the
"QSO-limit" of z = 6.4 show us that UV emission from galaxies is
still present at the "tail" of the "dark ages". A future
space-desideratum will be the galaxy morphology in the
Ly line. We are
interested in any extended neutral gas about the galaxy
- via the scattered
Ly emission from the
central ionizing region
(Haiman 2002
and references therein).
When the luminosity function of
Ly emitters is extended
to z ~ 6.5 (fainter galaxies have to be included) we should be
able to
extend the SFR density to that great distance. A sample of the
near-constancy of the SFR density from z ~ 2 to z ~ 5 is
illustrated in Fig 5 (from
Iwata et al. 2003). The galaxies going
into the computation of the SFR density are photometrically selected,
using the top of the UV-luminosity function
(MUV -5 logh < -20). Interestingly, an
attempt by D. Stern and the author to
utilize serendipitously discovered
Ly emitters at z
~ 5 yields
a SFR density slightly higher than that of the z ~ 5 Iwata point
in Fig. 5 (with considerable uncertainty). We
view this as a possible
coincidence, as these two methodologies may be sampling different
populations. It is somewhat surprising that the relatively slight
decline of the SFR density, noted by
Iwata et al.
(2003) should be
maintained to z ~ 5. At that redshift the detected objects are
effectively sub-galactic in size and probably rather modest in
mass. At least temporarily, their M/L ratios must be quite low. Will
that be true of most small sub-galactic systems?
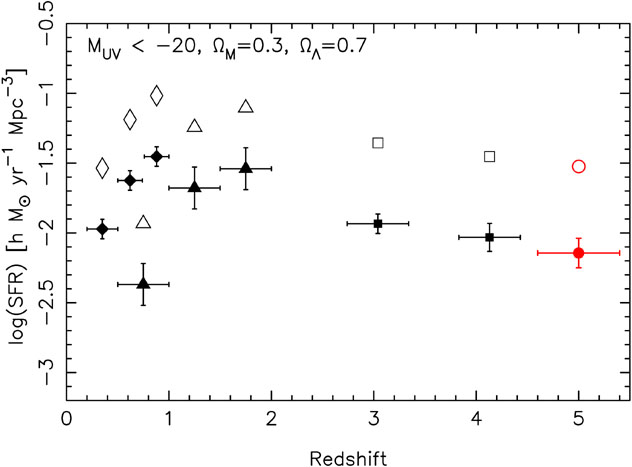 |
Figure 5. Star-formation rate density as a function of redshift based on the UV-luminosity function with a magnitude limit MUV < -20. Triangles and diamonds are from Connolly et al. (1997) and Lilly et al. (1996), respectively. Squares represent data from Steidel et al. (1999) at <z> ~ 3 and and 4. The circle is the data of Iwata et al. (2003) at z = 5. Filled symbols indicate values without correction for dust extinction. Dust extinction was corrected following the prescription of Calzetti et al. (2000) with E(B - V) = 0.15 for all data points. Dust-corrected values are denoted by open symbols. Plot courtesy of I. Iwata. |