


4.6. Details on the
Ly Emission Line in Very
Distant Galaxies
Emission Line in Very
Distant Galaxies
The classic proposal by
Partridge & Peebles
(1967)
that the Ly emission
line might carry a fair fraction of the escaping bolometric
luminosity of a young-star-rich galaxy is now testable. The review by
Pritchet (1994)
is also strongly recommended. Of course
these early predictions did not reflect the possible presence of dust.
Since the 1990s various searches have been initiated for
Ly-emitting
galaxies at large redshifts. Initially all of these searches led to
negative results (eg,
Thompson & Djorgovski
1995).
However, deeper photometric and spectroscopic searches of the last 6-7
years have yielded a modest number of "safe"
Ly emitters - often (at
the largest z's) the line being the only measurable spectral
feature. The peak flux from a distant
Ly emission line galaxy can
often exceed the (redward) continuum level by a factor greater than
10! Of course the line from a faint system still has to compete with
the strong telluric sky emission bands of OH and
O2. Space-spectra
won't deal with such a bright near-IR sky, and that will be advantageous.
Successful Ly searches
include
Cowie et al. (1998);
Hu et al. (1998),
Pascarelle et al. (1998),
Hu et al. (1999),
Steidel et al. (2000),
Kudritski et al.
(2000),
Fynbo, Möller, and
Thomsen, (2001).
There are three modes of
Ly detection used with
success in the past
few years. They are narrow-band photometric excesses at fixed
wavelengths (redshifts), a
Ly forest (Lyman breaks
in the continua)
plus emission at the line, and serendipitous or fortuitous detections
on multi-slit spectrograms. The issues we may face for each/all of the
sub-types include the emission line strength and shape, the luminosity
function of Ly emitters
(and their surface densities), the effect
of widespread neutral gas and dust, and the termination of the "dark
ages" before or during the re-ionization epoch. Many of these topics
have been addressed recently by
Stern & Spinrad
(1999);
Rhoads et al.
(2003);
Ellis et al.
(2001);
Hu et al. (1999);
Hu et al. (2002a),
and in a predictive manner by
Stiavelli (2002).
I suggest a few specific points where new observations and
interpretations may be of substantial interest. For example, we'd like
to confirm or deny that strong emission line
Ly galaxies (z
 4) obey the same luminosity
function distribution as do
photometrically selected Lyman break systems at z = 3 and
z = 4 (cf.
Steidel et al.
1999;
Giavalisco 2002).
4) obey the same luminosity
function distribution as do
photometrically selected Lyman break systems at z = 3 and
z = 4 (cf.
Steidel et al.
1999;
Giavalisco 2002).
The difficulty in a present-sample comparison between Lyman break
galaxies and Ly emitters
is that (at high luminosities, at least)
only a modest fraction of Lyman break (continuum selected) galaxies
have strong Ly emission
lines (W0 > 20 Å, say). Among the
Ly-emitting systems
(narrow-band or serendipitous detections) many
candidates have very faint continua and would be missed in normal
broad-band photometry. This latter bias is stressed by
Fynbo et al.
(2001).
Indeed,
Rhoads et al.
(2003)
found that if they summarized the line/continuum ratio in
Ly galaxies, the
equivalent widths occasionally "rose" to
W 0
1000 Å but more
frequently to 190 Å. 60% of the
Ly emitters studied by
Malhotra & Rhoads
(2002)
had observed equivalent widths (hereafter EW) > 240 Å. For
Ly-break systems,
Shapley et al.
(2001)
find their 60th-percentile line to be a marginally-detectable 20 Å
EW. The Shapley galaxies are at a slightly lower redshift; that
difference is not critical.
0
1000 Å but more
frequently to 190 Å. 60% of the
Ly emitters studied by
Malhotra & Rhoads
(2002)
had observed equivalent widths (hereafter EW) > 240 Å. For
Ly-break systems,
Shapley et al.
(2001)
find their 60th-percentile line to be a marginally-detectable 20 Å
EW. The Shapley galaxies are at a slightly lower redshift; that
difference is not critical.
If the above trend of lower-continuum-luminosity galaxies (z > 4)
having stronger
Ly-emission were to
continue, we might diagnose this
systematic as a trend toward lower metallicities for lower masses. But
there are other possibilities; the
Ly-emission line may as
easily depend upon physical outflows (galactic winds), which in turn could
have some total mass-dependence (or merger timing).
To get some idea as to the evolution of the luminosity function of
young galaxies, we can compare the surface densities of distant galaxies.
Pritchet (1994)
made a first approximation to this. We utilize the
Steidel et al.
(1999)
luminosity function zero point, and the "predictions" by
Lanzetta et al.
(1999)
and Stern & Spinrad
(1999)
for a constant (with z) luminosity function. The cumulative surface
density of identified z
4.5 galaxies in the HDF(N)
is about 1.5 /  '. These
galaxies constitute a sample of continuum
galaxies (photo-zs) and emission line galaxies with
I814
'. These
galaxies constitute a sample of continuum
galaxies (photo-zs) and emission line galaxies with
I814  26.5. This is very close to the "prediction" of the Lanzetta
(unevolved) surface density (also see
Ouchi et al.
2002).
26.5. This is very close to the "prediction" of the Lanzetta
(unevolved) surface density (also see
Ouchi et al.
2002).
The Lanzetta (1999)
surface density curves do suggest a drop in
the faint galaxy surface densities for the extreme case, z
6;
that is not surprising at about
I814 = 26. Still at slightly fainter
magnitude levels a measure of the z
6.0 density by
broad-band/narrow-band photometry may be a viable check on the
luminosity function zero point and its shape
(Lehnert & Bremer
2003).
What is the best physical interpretation of the very large EWs of
Ly often measured for
galaxies at z > 3?
The Ly-emitting galaxies
with line EW in excess of 200 Å (rest-frame)
(Malhotra & Rhoads
2002)
are difficult to explain with a
conventional O-B star mass function and ionizing spectra that are
similar to those anticipated in extant solar-abundance models. The
models rarely (and temporally) exhibit
W0
150 Å (e.g.,
Charlot & Fall 1993).
To decrease the observed
Ly EW would be
easy; as the dominant resonance line it is scattered frequently, and
the resulting "random spatial walk" at the center of this line,
coupled by small amounts of dust, can easily and drastically reduce
the emission measure. It would, of course, also depend on the geometry.
To obtain a higher EW and/or higher flux in
Ly, one can call upon
three scenarios:
(a) A "tilted" mass function, with more O stars than found in local HII regions, as an ad hoc premise.
(b) We can also reduce the heavy element abundances in our models, and
this allows an increase in the number of ionizing photons per O
star. A recent paper by
Schaerer (2002)
considers the temporal
evolution of the Ly line
from model stellar populations ranging
down from solar metal-abundances to very low metallicities (below the
abundance level of the most metal-poor stars and gas in relatively
nearby star-forming systems). We amplify this discussion below.
(c) Finally, sometimes a strong
Ly emission line is the
signature of an AGN. However, "real" AGN spectra, from QSOs down to
modest-luminosity accretions, usually produce a broader
Ly emission
line ( v
1000 km s-1)
than seen in normal galaxies
(v ~ 500 km
s-1).
They usually, but not always, also show C IV
(moderately broad) 1549 Å. So most of the narrow-line
Ly galaxies must have a
line powered by the UV flux from OB stars. This
is confirmed by the lack of hard X-ray flux in LALA galaxies at
z
v
1000 km s-1)
than seen in normal galaxies
(v ~ 500 km
s-1).
They usually, but not always, also show C IV
(moderately broad) 1549 Å. So most of the narrow-line
Ly galaxies must have a
line powered by the UV flux from OB stars. This
is confirmed by the lack of hard X-ray flux in LALA galaxies at
z  4.5
(Malhotra et al.
2003),
indicating they are not obscured AGN.
4.5
(Malhotra et al.
2003),
indicating they are not obscured AGN.
The previously-mentioned Schaerer paper
(Schaerer 2003)
predicts EW of ~ 240-350 Å for metallicities down to
Z = 4 × 10⁻⁴ (down from solar by a factor of ~ 50
times).
Stiavelli (2002)
shows even larger EW for
Ly in metal-poor OB
stars. Conceivably the initial stellar mass function (IMF) could also
vary and be itself slanted toward higher masses because of the lower
abundances. So the pairing of low abundance and a structure favoring
massive O stars might allow EW to match most of the
Ly galaxies selected by
Malhotra & Rhoads
(2002)
and by Rhoads et
al. (2003).
An almost-practical spectroscopic test of this idea can be made by
examining the UV HeII transition at
01640
Å. This line is
much weaker than Ly in
star-forming populations - with EW ~ 5
Å anticipated at low abundances of the metals. At higher abundances
(near solar) it will be even weaker. Thus higher S/N spectrograms will
be required in practice to use this He II feature
in Ly "test galaxies".
The shape of the Ly
emission line in distant star-forming galaxies
is peculiar and may turn out to be an interesting guide to the
circumgalactic medium as well as to galaxian winds or sporadic outflows.
The asymmetry of the Ly
line has been noted by
Kunth et al.
(1998)
and Pettini et
al. (2001);
it is also mentioned by
Stern & Spinrad
(1999).
We have utilized the broad red wing of the
Ly line and its
sharp ISM/IGM cutoff on the blue side as a secondary criterion for
assuming a single strong emission line is to be identified as
Ly. This is opposed to
the profile of the [O II] ]3727 doublet -
unresolved in most lower-spectral-purity observations of faint
objects. Recent work by E. Landes, S. Dawson, and the author has
compared a spectal asymmetry index (a lambda-space ratio) for ten
strong Ly emission
lines; this particular index is small for a
symmetric line and large for a red winged emission. Out of a sample
of seven medium-resolution spectra of galaxies with a "solid"
[O II] identification (z = 1.0) the
asymmetry index averages 0.9 ± 0.1, while the 10 bonafide
Ly galaxies, with
<z>  4
display a larger range of index, from 1.0 to 2.3,
with none less than unity. Seven of the
Ly systems are clearly
asymmetric with a noticeable red wing (see Fig. 6).
4
display a larger range of index, from 1.0 to 2.3,
with none less than unity. Seven of the
Ly systems are clearly
asymmetric with a noticeable red wing (see Fig. 6).
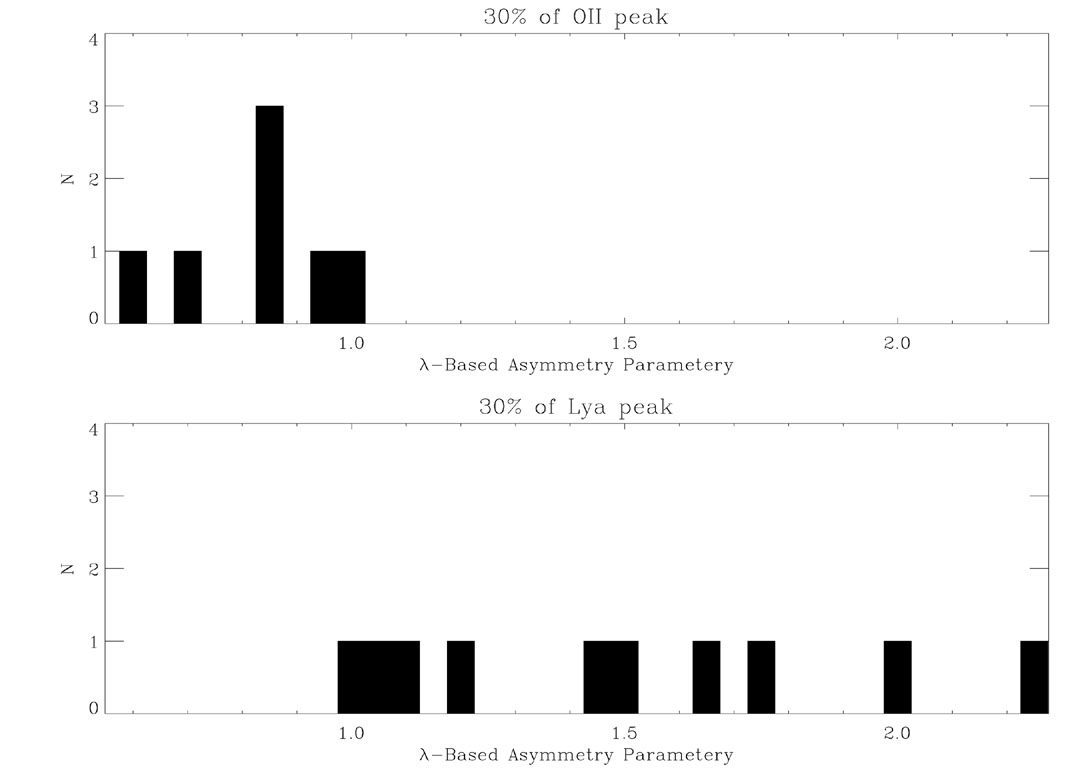 |
Figure 6. The
Ly |
The Ly line is usually
steeply declining on its blue side; we'll
soon come back to this observation. So deciding whether an emission
line is [O II] at a modest z or
Ly at a large z,
can often be helped by measuring the asymmetry. Of course a
Ly (bigger redshift)
decision based upon a large line asymmetry index becomes a sufficient,
but not necessary condition for claiming the
Ly identification.
The astrophysics behind the red wing of
Ly has been well expounded
by Tenorio-Tagle et
al. (1999),
Ahn, Lee & Lee (2002),
and Dawson et al.
(2002).
The scenario here is a mini-galaxy scale outflow of
neutral and partly ionized matter; the blueward velocity component
being absorbed by external and expanding neutral H gas between us and
the outflow. The backscattered component can be sufficiently
redshifted off of the receeding wind, and hence avoid immediate
absorption. This will impose a broadened red wing to the
Ly line.
On the blue side of
Ly we have a rapid
decrease in intensity, a very
sharp cutoff to the galaxy emission line at a slightly smaller
redshift. The actual galaxy systemic velocity is likely to be near but
blueward of the line peak, rather than its bisector at about half of
maximum intensity.
In any case the
Ly H absorption can take
place in neutral
circumgalactic gas, and in putative cluster gas, and also, at slightly
lower redshift, neutral H clouds in the IGM - the well-studied
Ly forest.
One interesting semi-quantitative aspect of the blue side cutoff is
the difference we have noticed between the blue edge of
Ly in QSO
spectra and that of the normal distant galaxies, highlighted in this
review (see Fig. 7). A new type of "proximity
effect" seems in place, in the sense that the galaxy
Ly profile on the short
wavelength side is extremely steep, going from the line peak to near
zero intensity in
v1
= 100 km s-1, on our few echelle (higher
spectral resolution) observations of the brightest distant systems (in
their Ly line). The
profile on the blue side of the strong emission
line in QSO spectra (also z > 4) is moderately steep, but has a
typical
v2
800 km s-1,
but often > 1000 km s-1.
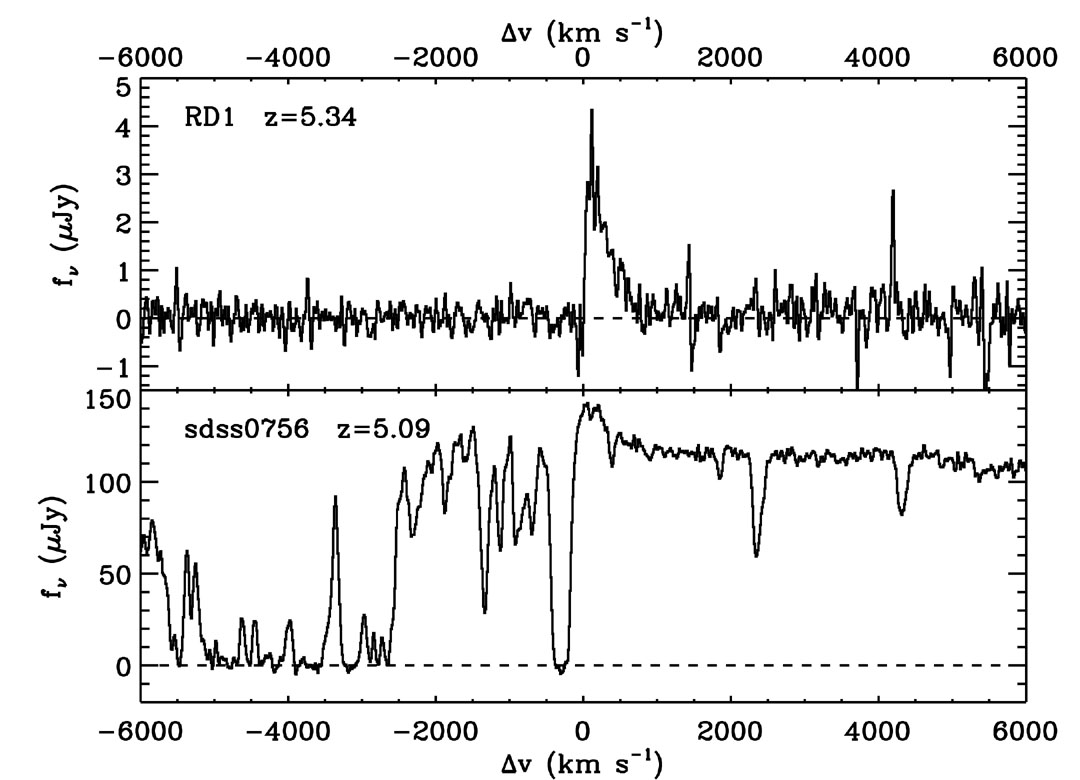 |
Figure 7. The steepness of the ultraviolet
side of the Ly |
Our interpretation of this systematic difference between UV-luminous
QSOs and UV-fainter galaxies is straightforward. In proximity to the
luminous ultraviolet radiation field of the QSOs H is very thoroughly
ionized and thus doesn't absorb
Ly photons at small
v. On
the other hand, a galaxy's UV ionizing radiation may not escape (or
fully escape - see
Dawson et al.
2002).
Thus the rapid decline on the
blue side of Ly may
simply augur the existence of neutral gas in
the circumgalactic environment near the galaxy. The effect may
increase with redshift, but this is not yet well documented. This
trend is potentially of interest in our present and future attempts to
document the degree of IGM ionization near active objects and also on
a diffuse, larger scale. Our coverage in redshift implies that we are
looking back close to the re-ionization redshift, between z = 6 and
z = 20, apparently.