Copyright © 1997 by Annual Reviews. All rights reserved
| Annu. Rev. Astron. Astrophys. 1997. 35:
101-136 Copyright © 1997 by Annual Reviews. All rights reserved |


3.3. Situations Where the Second Malmquist Bias Is Important
A simple way to see the second kind of Malmquist bias in action is to take the sample above, calculate log H for each galaxy, and plot log H against redshift. As demonstrated in several studies during the last twenty or so years, log H stays first roughly constant and then starts to increase. So clear and dramatic is this phenomenon, and also so much expected from simple reasoning as due to bias, that it is appropriate to repeat the words of Tammann et al (1980): "If an author finds Ho to increase with distance he proves in the first place only one thing, i.e., he has neglected the Malmquist effect! This suspicion remains until he has proved the contrary." To this statement, one should add that here "distance" means the true distance or at least a true relative distance (e.g. redshift in the case of the Hubble law). If "distance" is the measured or inferred distance, Ho does not necessarily change with the distance, though it may have a wrong average value - we have come back to the first kind of bias. This also serves as a warning that simple comparison of the "linearity" of photometric distances from two methods may hide a common bias, as seen in the comparisons of two or more distances by separate indicators discussed by de Vaucouleurs (1979). Each of the indicators suffers the same type of bias properties.
It seems that Behr (1951) was the first to point out, after comparison of the width of the Local Group luminosity function to that of the field galaxies, that application of the standard candle method may lead to systematically short distances at large true distances. As we discussed above, this idea was transformed into a quantitative model by Scott (1957) for the selection of brightest cluster galaxies. It was then reinvented by Sandage & Tammann (1975a), Teerikorpi (1975a, b), in connection with concrete field samples of spiral galaxies with van den Bergh's (1960a, b) luminosity classes. The basic reasoning is illustrated by the formula that connects the derived distance modulus to apparent magnitude, the assumed standard absolute magnitude Mp, and to the magnitude limit mlim:
 |
(10) |
Clearly, there is a maximum derived distance µmax
= mlim - Mp. However, because the standard candle
actually has a dispersion
 in absolute magnitude,
some galaxies can be seen from true distances beyond
µmax that necessarily become underestimated.
in absolute magnitude,
some galaxies can be seen from true distances beyond
µmax that necessarily become underestimated.
Under the assumption of a gaussian luminosity function
G(Mp, )
and a sharp magnitude limit mlim, it is a straightforward
task to calculate the magnitude of the second Malmquist bias
<µ> - µtrue at each true
distance modulus
(Teerikorpi 1975b,
Sandage 1994a),
or how much <log H>
will increase due to the magnitude limit cutting galaxies away from the
fainter
wing of the luminosity function. Such an analytical calculation needs the
correct distance scale and the relevant dispersion
as input, which restricts its application in practice. However, it gives
the general behavior of the bias, which is quite similar to the observed
behavior of <log H> vs kinematic distance, and forms the basis for
recognition and correction methods that are independent of Ho
(Section 4).
A fundamental property of the theoretical bias curves is that the curves for standard candles with different means, Mp, will show a shift along the axis of true distance (redshift) (see Figure 1a). This, in the first place, led to the recognition of the bias by Teerikorpi (1975a), where different van den Bergh's luminosity classes were inspected, and by analogy, to the proposal that de Vaucouleurs's parabolic velocity-distance relation (de Vaucouleurs 1972) was caused by a related effect.
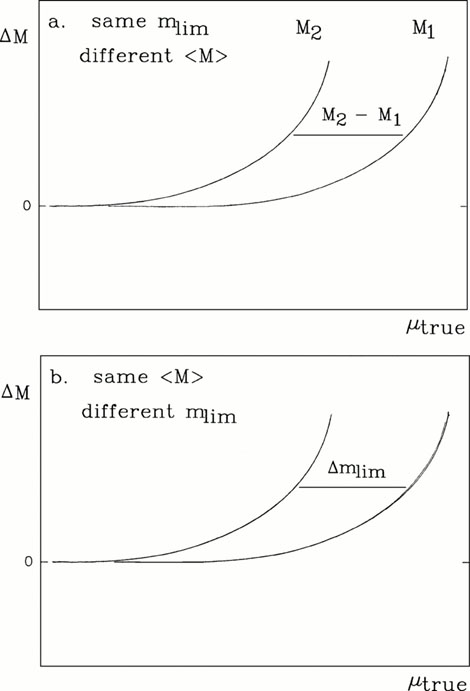 |
Figure 1. Illustrations of how the bias
|
An earlier example of the second Malmquist bias at work, is found in Hawkins (1962), where the composite Hubble diagram for field galaxies (using the magnitudes as distance indicators) was interpreted as supporting the quadratic law z = k . r2. This was suggested to be expected from the gravitational redshift in a static uniform universe, contrary to the linear law expected for the expansion redshift in a homogeneous and isotropic universe, described by the Robertson-Walker line element (Robertson 1955). If written formally as a velocity law, the quadratic law assumes the form log H = 0.5log V + const, which roughly describes the run of the data points between the unbiased region (log H = 0 . log V + const) and the strongly biased one (log H = 1.0 . log V + const). One sometimes sees, though not quite appropriately, "Lundmark's law" mentioned in connection with the quadratic law. True, Lundmark (1924, 1925) produced the first diagram where a dependence between redshift and distance was discernable, and he suggested the representation z = a + b . r - c . r2. In Lundmark's formal solution, the negative quadratic term does not seem to be related to any selection or other real effect - the scatter from galaxy diameters as distance indicator was large, and he might have easily suggested a linear law. Perhaps he was motivated by the interesting prediction that redshifts have a maximum value (3000 km/s), which was soon to be contradicted by Humason's measurements.
A special case of the second kind of Malmquist bias is related to Kapteyn's Problem I and sometimes called cluster population incompleteness bias. Here the galaxies are at the same true distance, and the bias in the derived distance modulus is caused and calculated similarly as above. This bias makes the distances to clusters of galaxies, calculated by the TF method, progressively too short, and as it does for field galaxies, making log H increase with true distance. Assertions in literature (e.g. Aaronson et al 1980 de Vaucouleurs & Corwin 1985, Bothun et al 1992) have stated that there is no Malmquist bias in clusters (because the galaxies in clusters have no volume effect like the field galaxies), implying that one may utilize the TF method without bias. However, there were indications in the 1980s that the clusters, in comparison with Malmquist corrected field galaxies, give Ho values that are too large, which led to recognition of the cluster incompleteness bias by Teerikorpi (1987), Bottinelli et al (1987), Kraan-Korteweg et al (1988).
 M in the average
magnitudes of standard candles depends on true distance modulus
µtrue: a. When the limiting magnitude
mlim is fixed, the bias curves are simply shifted by
M2 - M1 . b. Increasing
mlim shifts the
bias curve of a single standard candle class by
M in the average
magnitudes of standard candles depends on true distance modulus
µtrue: a. When the limiting magnitude
mlim is fixed, the bias curves are simply shifted by
M2 - M1 . b. Increasing
mlim shifts the
bias curve of a single standard candle class by