


Thanks to deep and medium-deep Chandra and XMM-Newton surveys (Giacconi et al. 2002; Alexander et al. 2003; Hasinger et al. 2001), it is now possible to search for obscured AGN at much larger distances. The determination of the intrinsic column density requires that the source redshift be known. Extensive campaigns of optical identifications have started to produce sizable samples of spectroscopically identified sources (Barger et al. 2002, 2003; Mainieri et al. 2002; Szokoly et al. 2004).
Most of the hard X-ray selected sources are obscured by column
densities 1021 < NH < 1023
cm-2, with unabsorbed hard X-ray
luminosities in the range
1042 -1044 ergs s-1. These values
are typical of Compton thin Seyfert galaxies in the nearby universe.
Obscured AGN with quasar-like luminosities and column densities
extending to the Compton thick regime are foreseen by the synthesis
models of the XRB based on the AGN unified scheme
(Section 3).
Although it has been predicted
(Fabian, Wilman, &
Crawford 2002)
that deep (of order a million seconds) Chandra exposures
should detect several tens of distant, optically faint, Compton thick
quasars, the observational evidence for such sources is rather
scanty. Indeed, only a handful of obscured sources with quasar
luminosities (LX > 1044 ergs
s-1) have been discovered so far (e.g.,
Stern et al. 2002),
with only a marginal indication of column densities in excess of
1024 cm-2 in a few objects
(Norman et al. 2002;
Wilman et al. 2003).
The low signal-to-noise X-ray spectrum of the
high redshift (z = 3.7) quasar Chandra Deep Field-South-202
(CDF-S-202) can be equally well fitted by a transmission model with
NH  8 × 1023 cm-2 and by a reflection
dominated continuum implying a heavily Compton thick source
(Norman et al. 2002).
In both cases, the iron line EW is of order
1 keV, though the detection is significant only at the
2
8 × 1023 cm-2 and by a reflection
dominated continuum implying a heavily Compton thick source
(Norman et al. 2002).
In both cases, the iron line EW is of order
1 keV, though the detection is significant only at the
2 level. The optical spectrum is dominated by narrow lines with an
average FWHM of order 1500 km s-1 and no continuum,
as expected for a type II quasar.
level. The optical spectrum is dominated by narrow lines with an
average FWHM of order 1500 km s-1 and no continuum,
as expected for a type II quasar.
Detections of Compton thick sources with quasar luminosities
also have been reported from X-ray observations of
hyperluminous infrared galaxies (HyLIRGs). The power source
responsible for an observed rest-frame 1 - 1000 µm luminosity
in excess of 1013
L in these
objects is thought
to be a mixture of obscured star formation and AGN activity.
in these
objects is thought
to be a mixture of obscured star formation and AGN activity.
The best evidence for a deeply buried
(NH  5
× 1024 cm-2), luminous quasar
(L10-100 keV
1.7 ×
1046 ergs s-1)
comes from broadband BeppoSAX observations to ~ 100 keV
of the HyLIRG IRAS 09104+4109, the most luminous
object in the universe at z < 0.5
(Franceschini et
al. 2000).
Unfortunately, the BeppoSAX sensitivity above 10 keV
does not allow other deeply buried HyLIRGs to be detected in
this way. However, more sensitive XMM-Newton observations
below 8 - 10 keV provide some indirect evidence of Compton thick
obscuration in two additional X-ray luminous HyLIRGs
(Wilman et al. 2003).
5
× 1024 cm-2), luminous quasar
(L10-100 keV
1.7 ×
1046 ergs s-1)
comes from broadband BeppoSAX observations to ~ 100 keV
of the HyLIRG IRAS 09104+4109, the most luminous
object in the universe at z < 0.5
(Franceschini et
al. 2000).
Unfortunately, the BeppoSAX sensitivity above 10 keV
does not allow other deeply buried HyLIRGs to be detected in
this way. However, more sensitive XMM-Newton observations
below 8 - 10 keV provide some indirect evidence of Compton thick
obscuration in two additional X-ray luminous HyLIRGs
(Wilman et al. 2003).
Despite the above results that indicate that Compton thick quasars do indeed exist, the present observations suggest that their relative fraction among the obscured AGN population at high redshifts is likely to be much lower than in the nearby universe.
The disagreement between optical and X-ray classifications (already discussed in Section 2) may be responsible for the difficulties encountered in the search for, and classification of, distant obscured sources. Indeed, one of the most surprising findings of the Chandra and XMM-Newton surveys is the discovery of a sizable number of relatively bright X-ray sources spectroscopically identified with early-type "normal" galaxies without any obvious signatures of nuclear activity in their optical spectra (Mushotzky et al. 2000; Fiore et al. 2000; Barger et al. 2001a, b; Hornschemeier et al. 2001; Giacconi et al. 2001) It should be pointed out that the presence of relatively bright X-ray sources in the nuclei of optically dull galaxies was first recognized by Einstein observations (Elvis et al. 1981). The very nature of X-ray Bright Optically Normal Galaxies (hereafter, XBONG) is still a matter of debate. Multiwavelength observations of a small sample of 10 "bona fide" sources belonging to this class were discussed by Comastri et al. (2002a). The high X-ray luminosities and the relative ratios between X-ray, optical, and radio fluxes strongly suggest that nuclear activity is present in almost all the XBONG. A detailed investigation of what can be considered the prototype of this class of object (P3; Comastri et al. 2002b) indicates that a heavily obscured (possibly Compton thick) AGN is the most likely explanation. Further evidences favouring the Compton thick absorption have been presented by Comastri et al. (2003).
However, such a possibility is not unique, and alternative solutions could still be viable. For example, the broadband properties of two XBONG discussed by Brusa et al. (2003) are more consistent with those of a BL Lacertae object and a small group of galaxies, respectively. It also has been pointed out (Moran, Filippenko, & Chornock 2002; see also Moran, this volume) that optical spectroscopy sometimes can be inefficient in revealing the presence of an AGN, especially at faint fluxes, when only low quality optical spectra are in hand. The nuclear emission lines easily could be diluted by the host galaxy starlight. Indeed, AGN features in the optical band were found in three bright candidate XBONG, serendipitously discovered by XMM-Newton (Severgnini et al. 2003), thanks to high signal-to-noise ratio spectroscopic observations that were able to separate the nuclear spectrum from that of the host galaxy. The X-ray and optical properties could then be explained by moderately luminous (LX ~ 1042-43 ergs s-1), mildly obscured (NH ~ 1022 cm-2) AGN hosted by luminous galaxies. While it is almost certain that XBONG are powered by accretion onto a supermassive black hole, it remains to be proved that Compton thick absorption is ubiquitous among these sources.
High redshift Compton thick AGN could be hiding among the relatively large number of X-ray sources that have remained so far unidentified due to their extremely faint optical counterparts. The ratio between X-ray flux and optical magnitude (defined as log FX / Fopt = log FX + 5.5 + R/2.5, see Maccacaro et al. 1988; Barger et al. 2002; McHardy et al. 2003) is considered to be a fairly reliable indicator of the X-ray source classification. Indeed, the distribution of FX / Fopt values of most of the spectroscopically identified X-ray selected AGN from ROSAT (Hasinger et al. 1998), ASCA (Akiyama et al. 2003), Chandra (Giacconi et al. 2001) and XMM-Newton (Mainieri et al. 2002; Fiore et al. 2003) surveys fall within -1 < log FX / Fopt < 1.
A sizable fraction (of order 20%) of hard X-ray selected sources are characterized by log FX / Fopt > 1 (Fig. 6). Obscured accretion seems to provide the most likely explanation for high FX / Fopt values. Such a possibility was confirmed by deep VLT spectroscopy of a few X-ray bright sources that turned out to be high redshift, type II AGN (Fiore et al. 2003). It has been further suggested (Comastri et al. 2003) that high, and even extreme, values of log FX / Fopt could be easily reproduced by shifting the broadband spectral energy distribution (SED), including the host galaxy starlight, of prototype Compton thick sources (i.e., NGC 6240 and IRAS 09104+4109) over a range of redshifts (z = 0.5 - 1.5). This range should be considered indicative, as the optically faintest sources, especially those not detected in the R band images, could be at greater distances. The combined effect of the K-corrections on the observed optical and hard X-ray fluxes due to the very shape of the NGC 6240 SED (Fig. 7) is responsible for the non-linear behavior of the FX / Fopt ratio as a function of redshift.
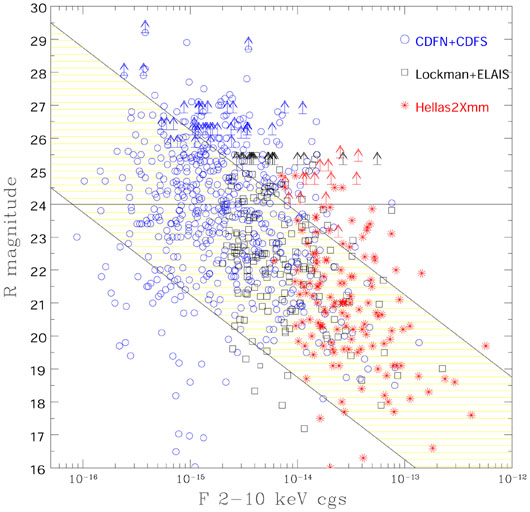 |
Figure 6. Optical R magnitude vs. 2 - 10 keV flux for hard X-ray selected sources in deep Chandra and medium deep XMM-Newton surveys (labeled). |
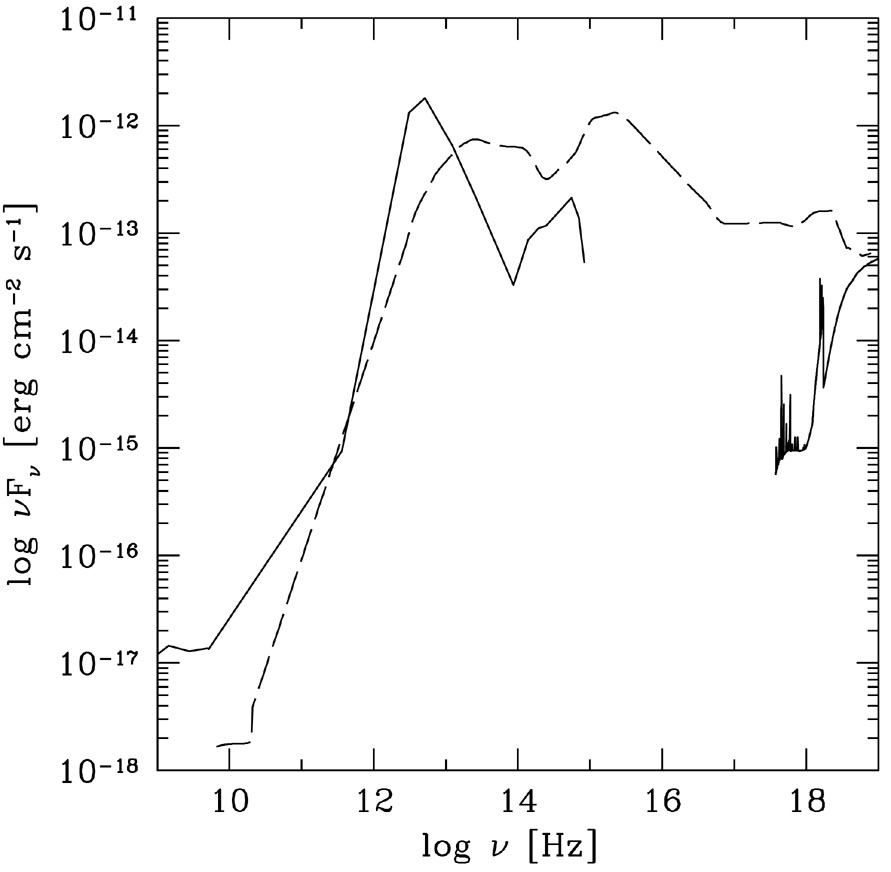 |
Figure 7. Spectral energy distribution of NGC 6240 (continuous line) and of the average spectrum of radio-quiet quasars (Elvis et al. 1994; dashed line) showing a significantly different behavior at both UV/optical and X-ray frequencies. |
In order to establish whether the high values of X-ray to optical
flux ratios are due to Compton thick obscuration, good quality
X-ray spectra are needed to search for the characteristic
absorption and reflection features of thick matter.
In particular, the detection of a strong redshifted iron
K line would provide
strong evidence for Compton thick gas
and, most importantly, would allow a reliable redshift measurement
to be obtained for objects with optical magnitudes
beyond the spectroscopic limit of large optical telescopes.
Unfortunately, the X-ray counting statistics, even in the deep
Chandra fields, are not such that they can properly address
this issue, possibly explaining the small fraction (~ 7%)
of CDF-N sources showing iron
K emission lines
(Bauer et al. 2003).
line would provide
strong evidence for Compton thick gas
and, most importantly, would allow a reliable redshift measurement
to be obtained for objects with optical magnitudes
beyond the spectroscopic limit of large optical telescopes.
Unfortunately, the X-ray counting statistics, even in the deep
Chandra fields, are not such that they can properly address
this issue, possibly explaining the small fraction (~ 7%)
of CDF-N sources showing iron
K emission lines
(Bauer et al. 2003).
A systematic search for strong (EW ~ 1 - 2 keV), redshifted iron lines among relatively faint (F2-10 keV ~ 10-15 ergs cm-2 s-1) hard X-ray sources would require extremely deep (of order 10 Ms) Chandra observations (Fig. 8). These are not limited, at least in the inner part of the detector, by source confusion, thanks to the good point spread function (PSF).
 |
Figure 8. Simulated spectrum of a
reflection dominated
F2-10 keV ~ 10-15 ergs cm-2
s-1 source at z = 1.5, as would be seen with an
ultradeep 10 Ms Chandra
observation. Input parameters are a flat power law with
|
The fraction of X-ray sources versus intrinsic column density predicted by current synthesis models is shown in Figure 9. The relative number of sources with column densities larger than 1024 cm-2 starts to increase below fluxes of order 10-15 ergs cm-2 s-1, reaching a fraction of order 10% of the entire X-ray source population around the limit of the deepest Chandra survey (F2-10 keV ~ 2 × 10-16 ergs cm-2 s-1). A similar fraction is also predicted by the Ueda et al. (2004) model, which is based on quite different prescriptions for the evolution of the luminosity function.
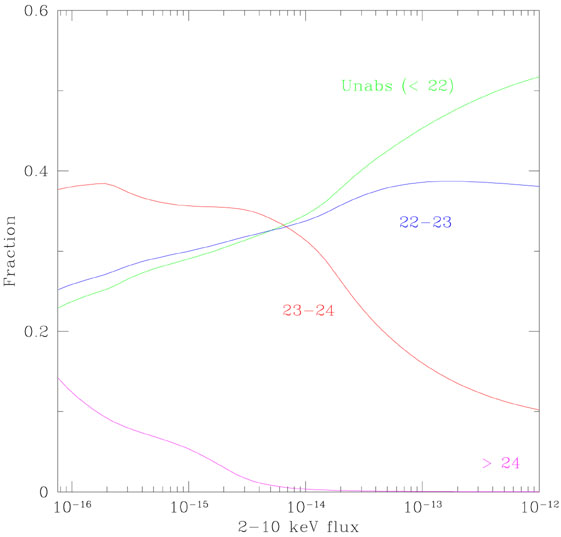 |
Figure 9. Relative fraction of sources with different column densities (labeled) vs. X-ray flux. |
The small area covered with good spatial resolution by a single ACIS field would imply that at least a few pointings are needed to collect a sizable number of sources for statistical investigations. Such a project, although technically feasible, appears to be extremely challenging in terms of observing time. The search for Compton thick AGN through an X-ray selection based on the detection of a strong iron line appears to be rather inefficient and probably not worth pursuing.
 =1
plus an iron line with an observed EW of 600 eV. The line feature
is clearly seen in the residuals (bottom panel) of a single power
law fit.
=1
plus an iron line with an observed EW of 600 eV. The line feature
is clearly seen in the residuals (bottom panel) of a single power
law fit.