


3.4. Stellar Populations and radial distributions
The stellar content of the outer region of M 33 is poorly explored. It is interesting to investigate if the different kind of stars identified in our CMDs share the same spatial distribution. To check this point we defined three selection boxes that are depicted in the F1 CMD shown in Fig. 7. Note that the boxes are defined in a range of magnitude in which incompleteness effects should be weak or negligible (MI < - 3.0, e.g. more than 2 mag above the limiting magnitude) and cover similar magnitude ranges.
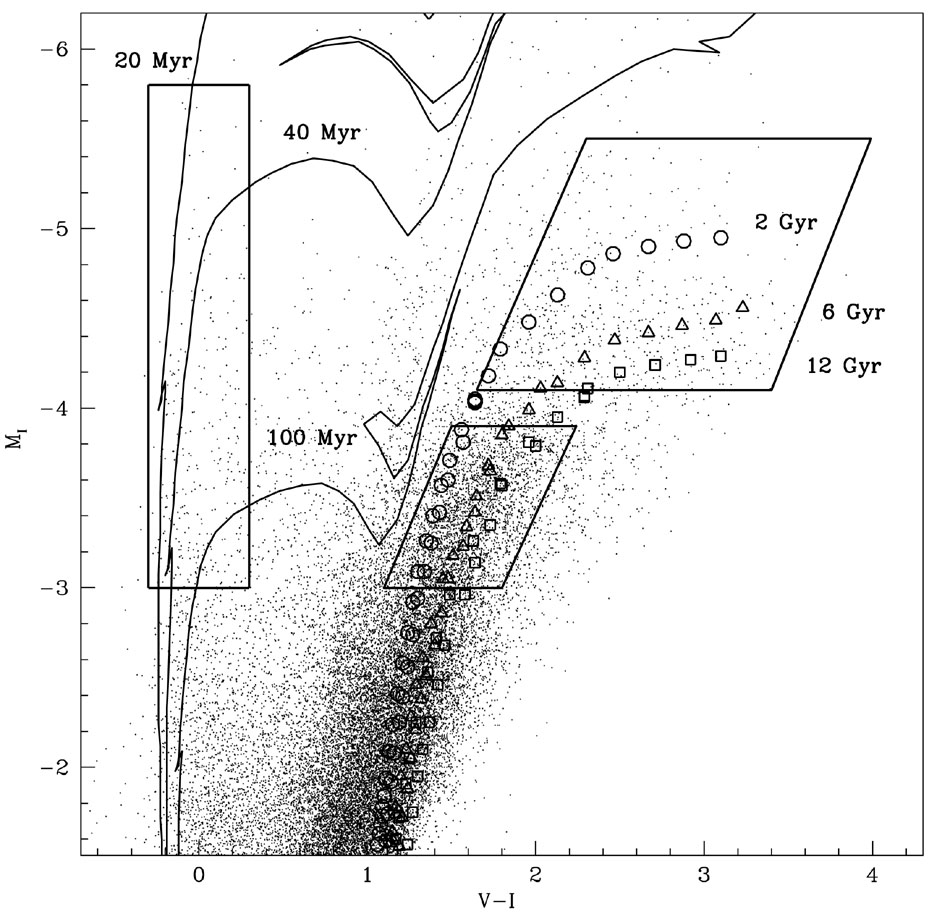 |
Figure 7. Description of the adopted selection boxes. The box around V - I = 0.0 selects a sample of young MS stars, the large box above the TRGB selects AGB stars, the small box below the TRGB selects RGB stars. The continuous lines are isochrones of solar metallicity, the open symbols are isochrones at [M / H] = - 0.7, from the set by Girardi et al. (2000). The ages are reported in the plot. The small dots are the observed stars of F1. |
As a guideline, we have superimposed three isochrones of solar
metallicity and age = 20, 40, 100 Myr (continuous lines) and three
isochrones with [M / H] = - 0.7
and age = 2, 6, 12 Gyr (empty symbols) from the set by
Girardi et
al. (2000). The
bluest box samples the upper MS, e.g. young stars with age
 100 Myr. The
large box above the TRGB samples the bright AGB stars, the smaller box
samples the brightest RGB stars. Both kinds of tracers are associated
with intermediate
to old age stars, but are not necessarily linked thogether. In
particular, bright RGB stars trace populations older than 1 - 2 gyr
(see Salaris, Cassisi
& Weiss, 2002, and references therein).
In the following, R must be intended as the projected angular distance
from the center of the galaxy.
100 Myr. The
large box above the TRGB samples the bright AGB stars, the smaller box
samples the brightest RGB stars. Both kinds of tracers are associated
with intermediate
to old age stars, but are not necessarily linked thogether. In
particular, bright RGB stars trace populations older than 1 - 2 gyr
(see Salaris, Cassisi
& Weiss, 2002, and references therein).
In the following, R must be intended as the projected angular distance
from the center of the galaxy.
In the upper panels of Fig. 8 the adopted
selection boxes are superposed on the
CMDs of F1 (left panel) and F2 (right panel). The lower panels of
Fig. 8 show
the cumulative radial distributions of the stars falling in the boxes in the
two different fields. In the radial range covered by F1 the distributions of
RGB and AGB stars are indistinguishable. On the other hand, MS stars appear
much more centrally concentrated since their distribution seems to end
at R ~ 17' -18', e.g. around 2 disc scale-lengths
(Van den Bergh, 1991).
According to a Kolmogorov-Smirnov test, the probability that the MS and
RGB samples are drawn from the same parent population is P
0.04%. This suggests that the
RGB and AGB stars are not associated with the young disc component
traced by MS
stars. At least a (significant) fraction of them should belong to a more
extended galactic component.
 |
Figure 8. Upper panels: the selection boxes described in Fig. 7 are superposed on the CMDs of F1 (left) and F2 (right). The corresponding cumulative radial distributions are displayed in the lower panels. |
The radial distribution of MS stars is not reported in the lower right
panel of
Fig. 8 since, in agreement with the above
conclusion, F2 is virtually devoid of stars populating the MS box. It is
surprising to note that in this field, AGB stars appear to follow a
significantly different distribution with respect to
RGB stars. The distribution of AGB stars is less centrally concentrated
and it is quite similar to uniform distribution on the sky. The latter
fact would be naturally explained if the AGB sample of F2 would be
dominated by foreground contamination (see also
Davidge, 2003).
According to the predictions of the Galactic model by
Robin et al. (2003)
this seems to be the actual case. The model
predicts that the number of Galactic stars falling in the AGB box is 48,
less than compared to the 61 actually observed. Hence
 80 % of the putative
AGB stars in F2 are likely foreground stars. The impact is much smaller
on the F1 stars where
584 stars are observed in the AGB box, hence the fraction of foreground
contaminants is < 10 %. On the other hand the expected number of
foreground stars falling in the RGB box is ~ 4, e.g. negligible in both
fields.
80 % of the putative
AGB stars in F2 are likely foreground stars. The impact is much smaller
on the F1 stars where
584 stars are observed in the AGB box, hence the fraction of foreground
contaminants is < 10 %. On the other hand the expected number of
foreground stars falling in the RGB box is ~ 4, e.g. negligible in both
fields.
Therefore, the difference of radial distribution shown in the lower right
panel of Fig. 8 is completely spurious. On the
other hand, if we consider star
counts and take into account the corrections for foreground
contamination, it
turns out that while the number of RGB stars drops by a factor
27
going from F1 to F2, the number of AGB stars decreases by a larger factor,
42. This suggests that
RGB stars may follow a more extended
distribution with respect to AGB stars at large radii.
All the above considerations seem to indicate that populations of different characteristic ages follow different distributions on the sampled scales, the older stars having more extended distributions. This is suggestive of the presence of a weak "classical" old halo component in M 33. The only previous indication in this sense (from field stars) is provided by the discovery of a few candidate RR Lyrae variables by Pritchet (1988), while all other hints of the existence of an old spheroidal stellar component come from the study of globular clusters (Sarajedini et al., 2000; Schommer et al., 1991). Note, however, that an extended and old disc component is also compatible with our observations (see T04).
In the upper panel of Fig. 9 we report the
radial profiles of RGB and MS stars
over the range(s) sampled by the present study. The MS profile is reasonably
reproduced by an exponential law with scale-length h = 9.2' up to
R 17', in
agreement with the results by
Kent (1987).
However, at R = 19' the sharp drop of the density already
observed and discussed in
Fig. 8 is clearly evident. On the other hand the
RGB profile is well fitted by an exponential law with
h = 4.9' over the whole radial range sampled by
F1. The density of RGB stars falls significantly below the adopted
exponential profile in F2, suggesting a break in the observed profile in
the range
20'  R
25'. In our view,
the most interesting
result of this comparison is that, even ignoring the observed density
cut-offs, the RGB and MS distributions do have significantly different
profiles, again suggesting a different origin.
R
25'. In our view,
the most interesting
result of this comparison is that, even ignoring the observed density
cut-offs, the RGB and MS distributions do have significantly different
profiles, again suggesting a different origin.
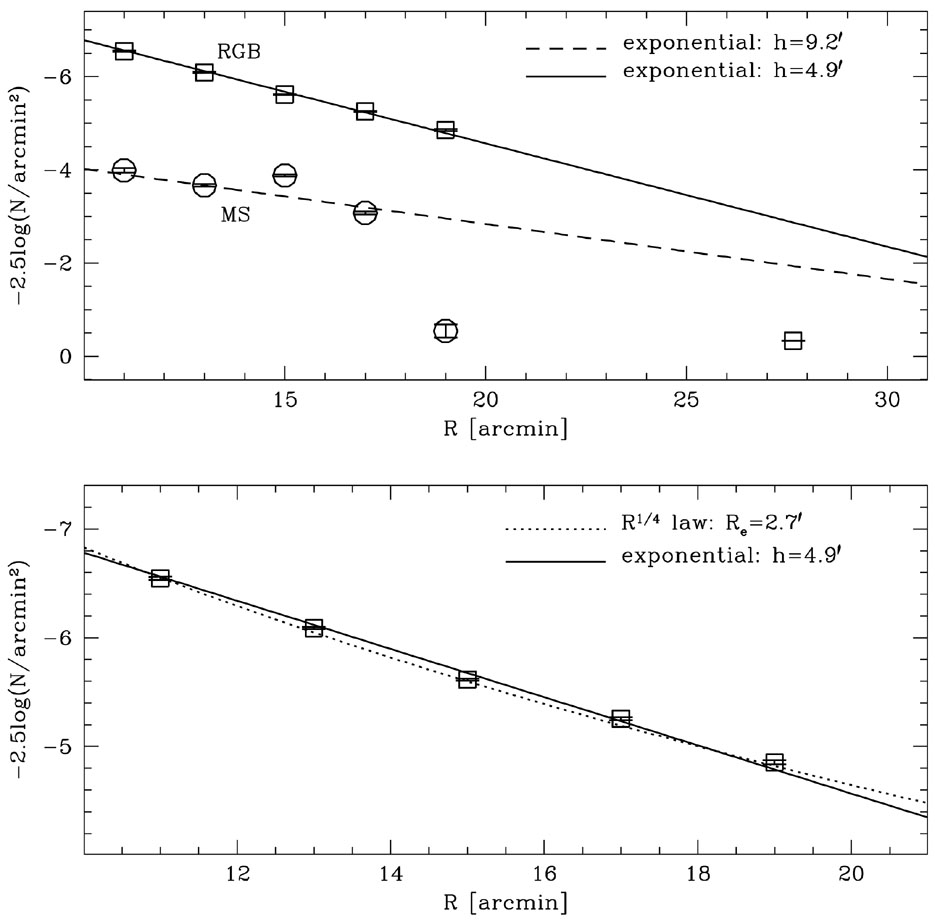 |
Figure 9. Upper panel: stellar density
profiles for MS (open circles) and
RGB stars (open squares) compared with two different exponential laws.
All the estimates with
R |
The lower panel of Fig. 9 shows that in the
radial range covered by F1
(10' R
20') the observed density
profile of RGB stars is
equally well fitted by the exponential law described above and by a
R1/4 law having effective radius
Re = 2.7' (in fact, the
R1/4 law provides a marginally better fit with respect
to the exponential). It is interesting to note that the same
R1/4 law was
found to provide a good fit also to the central bulge of M 33
(Boulesteix et al.,
1980;
Bothun, 1992),
suggesting a possible connection between the bulge and
the putative halo component (but see
Stephens & Frogel,
2002,
for a detailed decomposition of the inner profile). While suggestive,
the above result is limited to the considered radial range
(10' R
20') where the contribution
of disc stars to the RGB
population may be low. To correctly disentangle the contribution of the
disc from that of the more extended component identified here, a complete
sampling of the density profile from the center to the outskirts of the
galaxy is needed, e.g. covering also the regions in which the surface
brightness should be dominated by the exponential disc. This kind of
analysis is clearly beyond the reach of the present study.