


3.3. Metallicity
We derive the Metallicity Distributions (MD) of the studied fields from the Color and Magnitude distribution of RGB stars (transformed to the absolute (V - I)0 vs. MI plane adopting the reddening and distance modulus described above) by interpolation on a grid of RGB ridgelines of template globular clusters, adopting the same scheme as Bellazzini et al. (2003). Essentially the same approach is adopted also by T04. The MDs are obtained in different metallicity scales, e.g. the ZW scale, the scale by Carretta & Gratton (1997, hereafter CG) and the global metallicity scale described in Ferraro et al. (1999), to make the comparison with other studies easier. While the individual photometric metallicities provided by the adopted procedure may be quite uncertain, the overall metallicity distribution and its average properties are sufficiently well characterized to provide interesting insights into the stellar population under analysis and it has been widely used, in recent years, in the study of resolved galaxies (see Bellazzini et al., 2003, for details, discussion and references). The color distribution of RGB stars should depend - to a lesser extent - also on the age distribution of the underlying population. T04 studied this problem in the case of M 33 by mean of synthetic CMDs drawn from theoretical evolutionary tracks and concluded that "...the ages of the RGB stars are not likely to significantly affect the derived MDs...". They estimate that the maximum expected shift of the peak of the MDs is of the order of 0.1-0.2 dex. Finally, the young MS population observed in F1 - and not in F2 - cannot affect the comparison between the MDs of the two fields since their evolved counterparts should be negligible in number and do not fall in the selection box we adopt to obtain MDs (see Fig. 5 and 7, below). When dealing with photometric metallicities it should be kept in mind that the underlying age distribution may affect the derived MDs.
In Fig. 5 a direct comparison between the observed RGBs of F1 and F2 and the adopted template ridge lines is presented. It is immediately clear that the large majority of M 33 RGB stars (in both fields) are enclosed within the ridge lines of M 5 ([Fe / H]CG = - 1.11; [M / H] = - 0.90) and of 47 Tuc ([Fe / H]CG = - 0.70; [M / H] = - 0.60). In the CMD of F2 an anomalous clustering of stars can be noted around the ridge line of NGC 6553 ([Fe / H]CG = - 0.16; [M / H] = - 0.06) that has no counterpart in the CMD of F1. However, as can be appreciated from Fig. 3, such red stars are just above the limiting magnitude at their color. For this reason we will not discuss in detail this feature in the following. Deeper photometry is needed to firmly assess the possible presence of an excess of very red RGB stars in this region.
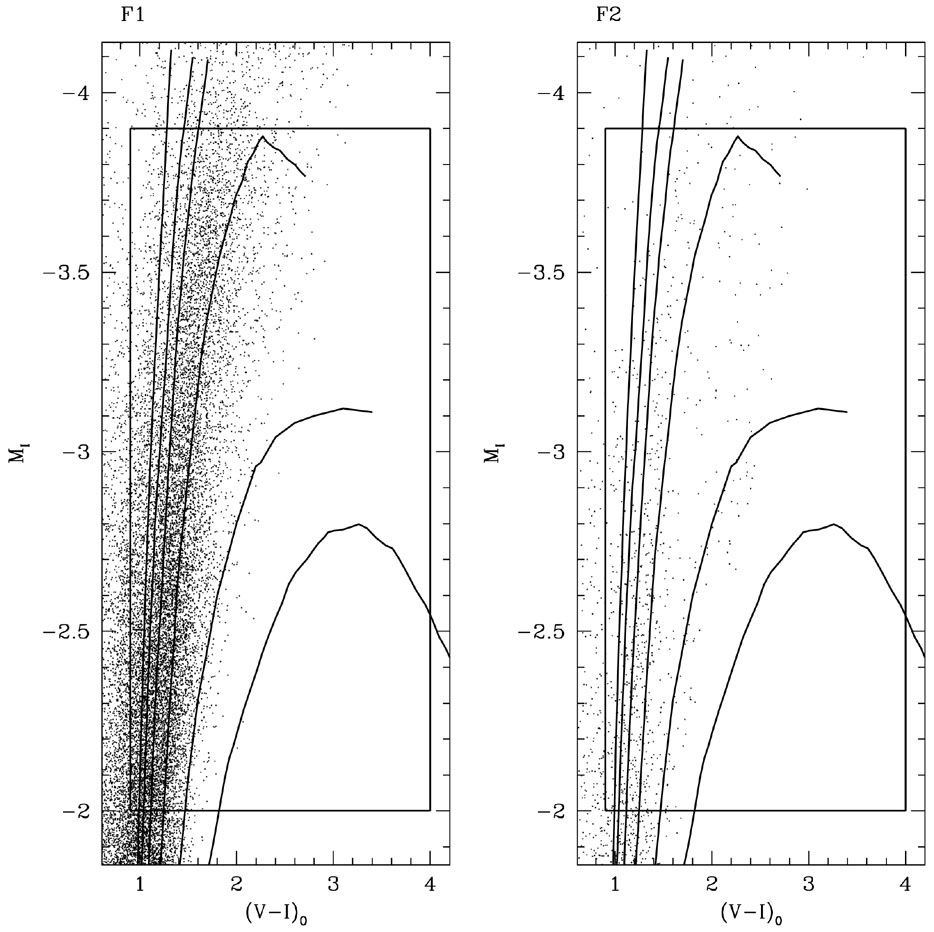 |
Figure 5. The CMDs of the RGB stars in F1 (left panel) and F2 (right panel) are compared to the grid of RGB ridge lines of template globular clusters we adopted to derive the metallicity distributions. From blue to red, the template clusters are: M 92, M 13, M 5, 47 Tuc, NGC 6553 and NGC 6528. The thick box encloses the RGB stars actually selected for the derivation of the metallicity distribution (see Bellazzini et al., 2003, for details). |
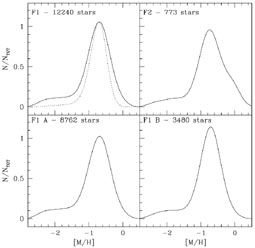
In Fig. 6 we present the MDs (in the form of
generalized histograms) as a function
of the global metallicity for F1 (upper left panel) and F2 (upper right
panel).
To study in finer detail the radial behavior of he MD we split F1 in
two subregions (A and B) of similar area. In particular F1 A contains
all the F1 stars less distant than
15' from the center of M 33, while the F1 stars
with r
Figure 6. Metallicity Distributions
(continuous lines) of the F1 field as a
whole (upper left panel), of F2 (upper right panel), of the inner part of
F1 (10'
The MD of all the considered fields shows a strong
peak at [M / H]
The bell-shaped curve plotted as a dotted line in
the upper left panel
of Fig. 6 displays the response of the adopted
interpolation scheme to a Simple
Stellar Population (SSP, i.e. a population of stars having the same age
and chemical composition,
Renzini & Fusi
Pecci, 1988)
observed under the same conditions as our real
data. It has been obtained adopting, as input for the interpolation,
a synthetic RGB population whose color width is entirely due to the
photometric
errors. The I magnitude of the "synthetic" stars is extracted from the
observed RGB luminosity function, the V-I color is obtained from the average
ridge line of the observed RGB plus a photometric error drawn at random
from a Gaussian distribution having
To obtain the true
width of the underlying MD the described "instrumental response" should be
deconvolved from the observed MD (continuous line). The main peak of the
observed MD is well fitted by a Gaussian distribution with
By comparison with ridge lines of template
globular clusters,
Mould & Kristian
(1986)
estimated < [Fe / H]ZW >
Assuming the same distance modulus as
Mould & Kristian
(1986),
Kim et al. (2002)
obtain -0.61
Kim et al. (2002)
found a weak radial gradient in the mean metallicity (0.2
dex) in the range
1
The weak shoulder at
[M / H] ~ - 0.2 in the MD of F2 is due to the
handful of red stars around the ridge line of NGC 6553 discussed
above, hence, at the present stage, cannot be trusted as a real feature
of the MD (but it deserves further investigation).
Table 2. Distance Modulus,
median Metallicity
and standard deviations in different metallicity scales, and
with different assumptions on the reddening. Note that the median and the
mean metallicity are nearly coincident in all the considered
cases.
 15' are assigned
to F1 B. The MDs of F1 A and F1 B are plotted in the lower left and
lower right panels of Fig. 6, respectively.
Note that if we exclude from the interpolation the stars with
MI - 2.5,
i.e. in the range where the sensitivity of color to metallicity is lower,
the obtained MDs are unchanged. This experiment also demonstrates that the
derived MD are not sensitive to the effect of incompleteness, as expected.
The average properties of all the considered MDs are summarized in
Table 2, for two different assumptions of E(B-V).
There are a number of considerations emerging from the inspection of
Fig. 6 and Table 2:
15' are assigned
to F1 B. The MDs of F1 A and F1 B are plotted in the lower left and
lower right panels of Fig. 6, respectively.
Note that if we exclude from the interpolation the stars with
MI - 2.5,
i.e. in the range where the sensitivity of color to metallicity is lower,
the obtained MDs are unchanged. This experiment also demonstrates that the
derived MD are not sensitive to the effect of incompleteness, as expected.
The average properties of all the considered MDs are summarized in
Table 2, for two different assumptions of E(B-V).
There are a number of considerations emerging from the inspection of
Fig. 6 and Table 2:
 R
15'; F1 A, lower
left panel) and of the outer part of the same field (15'
R
20';
F1 B, lower right panel). The dotted line in the upper left panel shows the
instrumental response of the method, the MD that would be obtained if the
width of the RGB was entirely due to the photometric errors.
R
15'; F1 A, lower
left panel) and of the outer part of the same field (15'
R
20';
F1 B, lower right panel). The dotted line in the upper left panel shows the
instrumental response of the method, the MD that would be obtained if the
width of the RGB was entirely due to the photometric errors.
 - 0.7. This justifies
our assumption of the median metallicity as the
characteristic value of the dominant population in our determination of
the TRGB distance. A sparsely populated tail of metal-poor stars extending
to [M / H] < - 2.0 is also
present in all the presented MDs. This general similarity over large
areas of
the galaxy (F1 covers a range of galactocentric distances from ~ 2.4 Kpc
to ~ 5 Kpc, F2 from ~ 5.5 Kpc to ~ 8.2 Kpc) is in agreement with
the results by
Kim et al. (2002)
and is reminiscent of what is observed in M 31
(Bellazzini et al.,
2003).
Our MDs are very similar to those obtained by T04.
- 0.7. This justifies
our assumption of the median metallicity as the
characteristic value of the dominant population in our determination of
the TRGB distance. A sparsely populated tail of metal-poor stars extending
to [M / H] < - 2.0 is also
present in all the presented MDs. This general similarity over large
areas of
the galaxy (F1 covers a range of galactocentric distances from ~ 2.4 Kpc
to ~ 5 Kpc, F2 from ~ 5.5 Kpc to ~ 8.2 Kpc) is in agreement with
the results by
Kim et al. (2002)
and is reminiscent of what is observed in M 31
(Bellazzini et al.,
2003).
Our MDs are very similar to those obtained by T04. equal to the average
observed
photometric uncertainty at the considered magnitude (as done in
Bellazzini et al.,
2002).
= 0.34 dex,
while the instrumental response curve is well approximated by a Gaussian
distribution with
= 0.23 dex. It may be
concluded that the true
intrinsic dispersion of the main peak of the MD is
0.25 dex. -2.2 ± 0.8 for a
field at a galactocentric distance similar to F2. On the other hand, we
find, for both F1 and F2, < [Fe / H]ZW >
-1.03 ± 0.40, in
excellent agreement with the results by
Davidge (2003),
Cuillandre, Lequeux
& Loinard (1999) and T04.
The difference is partly justified by the
different assumptions about distance
((m - M0) = 24.8 instead of our
(m - M0) = 24.64). However, even adopting their
distance modulus we find
< [Fe / H]ZW >
-1.22 ± 0.40, much
more metal-rich than what was found by
Mould & Kristian
(1986).
We tentatively ascribe this difference to a possible problem in
the absolute calibration of Mould & Kristian's photometry. This
hypothesis is confirmed by the results of T04.
equal to the average
observed
photometric uncertainty at the considered magnitude (as done in
Bellazzini et al.,
2002).
= 0.34 dex,
while the instrumental response curve is well approximated by a Gaussian
distribution with
= 0.23 dex. It may be
concluded that the true
intrinsic dispersion of the main peak of the MD is
0.25 dex. -2.2 ± 0.8 for a
field at a galactocentric distance similar to F2. On the other hand, we
find, for both F1 and F2, < [Fe / H]ZW >
-1.03 ± 0.40, in
excellent agreement with the results by
Davidge (2003),
Cuillandre, Lequeux
& Loinard (1999) and T04.
The difference is partly justified by the
different assumptions about distance
((m - M0) = 24.8 instead of our
(m - M0) = 24.64). However, even adopting their
distance modulus we find
< [Fe / H]ZW >
-1.22 ± 0.40, much
more metal-rich than what was found by
Mould & Kristian
(1986).
We tentatively ascribe this difference to a possible problem in
the absolute calibration of Mould & Kristian's photometry. This
hypothesis is confirmed by the results of T04. < [Fe /
H]ZW >
- 0.86 for 10 fields covering
(approximately) the same radial range than our F1. The agreement with our
results is much better than with Mould & Kristian's one,
still the difference is not
negligible and it is not justified by the different distance modulus
assumed (a larger distance modulus should imply a brighter and hence
more metal-poor RGB). However
Kim et al. (2002)
derived their mean metallicity from the mean (V -
I)0 color at MI = - 3.5. We consider
our median/mean metallicities,
derived from all the RGB stars brighter than
MI = - 2.0 and based on an
accurately checked photometric calibration, as more robust and safer than
those by Kim et
al. (2002). R
5 Kpc (see also T04).
We find no sign of variation of the mean metallicity in the range
2.4 R
8.2 Kpc, but such feeble
differences
may have gone undetected at the level of accuracy of our relative photometry
(e.g. may be hidden in the "instrumental width" of the observed
sequences).
< [Fe /
H]ZW >
- 0.86 for 10 fields covering
(approximately) the same radial range than our F1. The agreement with our
results is much better than with Mould & Kristian's one,
still the difference is not
negligible and it is not justified by the different distance modulus
assumed (a larger distance modulus should imply a brighter and hence
more metal-poor RGB). However
Kim et al. (2002)
derived their mean metallicity from the mean (V -
I)0 color at MI = - 3.5. We consider
our median/mean metallicities,
derived from all the RGB stars brighter than
MI = - 2.0 and based on an
accurately checked photometric calibration, as more robust and safer than
those by Kim et
al. (2002). R
5 Kpc (see also T04).
We find no sign of variation of the mean metallicity in the range
2.4 R
8.2 Kpc, but such feeble
differences
may have gone undetected at the level of accuracy of our relative photometry
(e.g. may be hidden in the "instrumental width" of the observed
sequences).
F1
F2
F1
F2
E(B-V)
0.04
0.08
[Fe / H]ZW
-1.03
-1.03
-1.17
-1.18
ZW0.40
0.40
0.40
0.44
[Fe / H]CG
-0.89
-0.89
-0.97
-0.98
CG0.27
0.28
0.28
0.32
[M / H]
-0.75
-0.74
-0.81
-0.81
M/H0.23
0.23
0.23
0.27
(m - M)0
24.64 ± 0.15
24.59 ± 0.15