


4.2. Nonstandard Expansion Rate: S
 1
(
1
( N
N 0)
0)
The excellent agreement between the SBBN-predicted baryon density
inferred from the primordial-D abundance and that derived from
the CBR and large scale structure
(Spergel et al. 2003),
and also the agreement between predicted and observed D and
3He suggest
that the tension with 4He, if not observational or astrophysical
in origin, may be a sign of new physics. As noted earlier, YP
is sensitive to the early-Universe expansion rate (while D, 3He,
and 7Li are less so). A faster expansion (S > 1,
N ;> 0)
leads to a higher predicted primordial abundance of 4He, and
vice versa for S < 1
(
N <
0). In Figure 12 is shown the
same YP versus yD band as for SBBN in
Figure 10,
along with the corresponding bands for the nonstandard cases of
a faster expansion (
N = 4) and a
slower expansion (
N = 2).
It can be seen that the data "prefer" a slower than standard
early-Universe expansion rate. If both
 and
N are
allowed to be free, it is possible (not surprisingly) to accommodate the
adopted primordial abundances of D and 4He (see
Fig. 2).
Given the similar effects of
N
0 on the BBN-predicted D,
3He, and 7Li abundances, while it is possible to
maintain the good agreement (from SBBN) for 3He, the tension
between 7Li and D cannot
be relieved. In Figure 13 are shown the 1-, 2-,
and 3-
and
N are
allowed to be free, it is possible (not surprisingly) to accommodate the
adopted primordial abundances of D and 4He (see
Fig. 2).
Given the similar effects of
N
0 on the BBN-predicted D,
3He, and 7Li abundances, while it is possible to
maintain the good agreement (from SBBN) for 3He, the tension
between 7Li and D cannot
be relieved. In Figure 13 are shown the 1-, 2-,
and 3- BBN contours in
the -
N plane derived
from the adopted values of yD and
YP. Although the best-fit point is at
N = -0.7
(and 10
= 5.7), it is clear that SBBN
(N = 3) is
acceptable.
BBN contours in
the -
N plane derived
from the adopted values of yD and
YP. Although the best-fit point is at
N = -0.7
(and 10
= 5.7), it is clear that SBBN
(N = 3) is
acceptable.
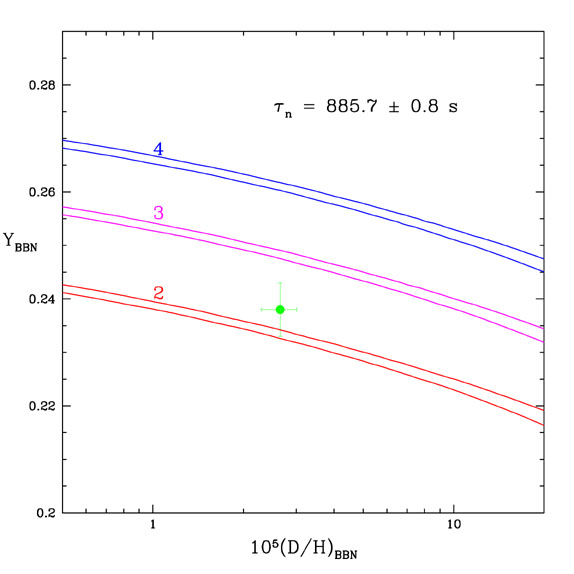 |
Figure 12. As in
Figure 10 for
N |
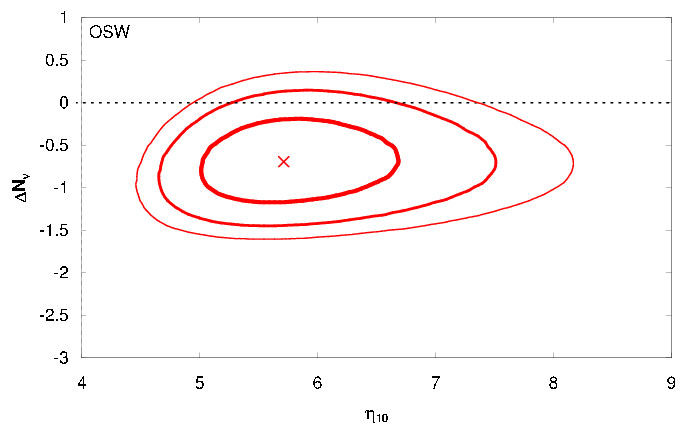 |
Figure 13. The 1-, 2-, and
3- |
The CBR temperature anisotropy spectrum and polarization are also
sensitive to the early-Universe expansion rate (see, e.g.,
Barger et al. 2003a,
and references therein). There is excellent overlap
between the
-
N confidence
contours from BBN as shown in
Figure 13 and from the CBR
(Barger et al. 2003a).
In Figure 14 are shown the confidence contours
in the -
N plane for
a joint BBN - CBR fit
(Barger et al. 2003a).
Again, while the best fit value for
N is negative
(driven largely by the adopted value for YP),
N = 0 is quite
acceptable.
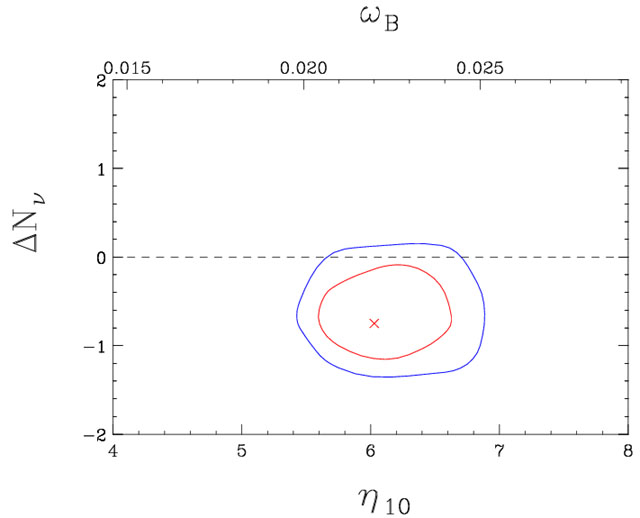 |
Figure 14. The 1- and
2- |