


Some 400 kyr after BBN has ended, when the Universe has expanded and
cooled sufficiently so that the ionized plasma of protons, alphas, and
electrons combines to form neutral hydrogen and helium, the CBR photons
are set free to propagate throughout the Universe. Observations of the
CBR today reveal the anisotropy spectrum of temperature fluctuations
imprinted at that early epoch. The so-called acoustic peaks in the
temperature anisotropy spectrum arise from the competition between
the gravitational potential and the pressure gradients. An increase
in the baryon density increases the inertia of the baryon - photon
fluid shifting the locations and the relative heights of the acoustic
peaks. In Figure 6 are shown three sets of
temperature anisotropy spectra for cosmological models which differ
only in the choice of the baryon density parameter
 B.
Also shown in Figure 6 are the WMAP data from
[Bennett et
al. (2003)].
It is clear from Figure 6 that
the CBR provides a very good baryometer - independent of that
from SBBN and primordial deuterium. Based on the WMAP data alone,
[Barger et
al. (2003a)]
find that the best fit value for the density parameter
is
B.
Also shown in Figure 6 are the WMAP data from
[Bennett et
al. (2003)].
It is clear from Figure 6 that
the CBR provides a very good baryometer - independent of that
from SBBN and primordial deuterium. Based on the WMAP data alone,
[Barger et
al. (2003a)]
find that the best fit value for the density parameter
is  10 =
6.3 (B = 0.023)
and that the
2
10 =
6.3 (B = 0.023)
and that the
2 range extends from
10 =
5.6 to 7.3 (0.020
range extends from
10 =
5.6 to 7.3 (0.020  B
0.026). This is in
excellent (essentially
perfect!) agreement (as it should be) with the CBR-only result
of [Spergel et
al. (2003)].
More importantly, as may be seen clearly in
Figure 7 (courtesy of D. Marfatia), this
independent constraint on the baryon density parameter, sampled
some 400 kyr after BBN, is in excellent agreement with that from
SBBN (see Section 5), providing strong
support for the standard model of cosmology.
B
0.026). This is in
excellent (essentially
perfect!) agreement (as it should be) with the CBR-only result
of [Spergel et
al. (2003)].
More importantly, as may be seen clearly in
Figure 7 (courtesy of D. Marfatia), this
independent constraint on the baryon density parameter, sampled
some 400 kyr after BBN, is in excellent agreement with that from
SBBN (see Section 5), providing strong
support for the standard model of cosmology.
 |
Figure 6. The CBR temperature fluctuation
anisotropy spectra for three choices of the baryon density parameter
|
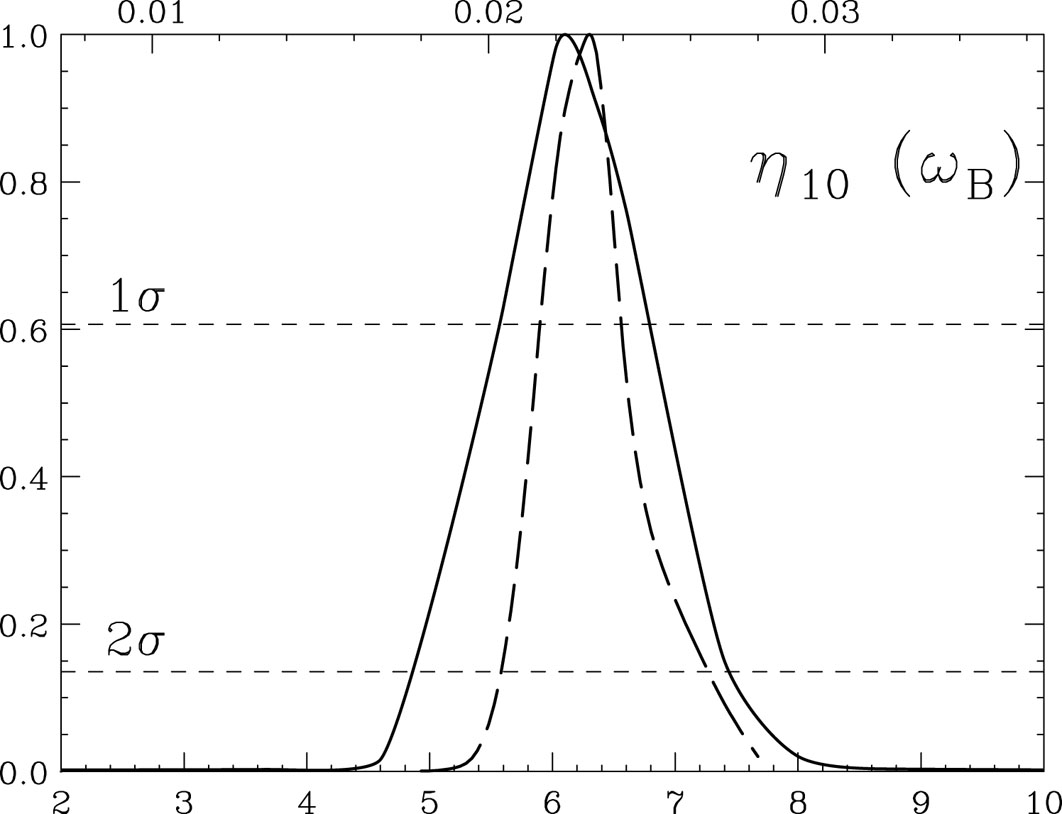 |
Figure 7. The normalized likelihood
distributions for the baryon density parameter
|
The independent determination of the baryon density parameter by
the CBR reinforces the tension between SBBN and the relic abundances
of 4He and 7Li inferred from the observational
data (see Section 5). In the context of
SBBN, the slightly higher best
value of from
the WMAP data (compared to that from D plus SBBN)
increases the expected primordial abundances of 4He
and 7Li
(see Figure 1), widening the gaps
between the SBBN
predictions and the data. Keeping in mind the observational and
theoretical difficulties in deriving the primordial abundances from
the data, it is nonetheless worthwhile to explore a class of nonstandard
alternatives to the standard model of cosmology in which the early
Universe expansion rate is modified (S
 1,
N
1,
N 3).
3).
 B
h2.
B
h2.