


 1,
N
1,
N 3
3
As outlined in Section 3, for fixed
 as S
increases the BBN-predicted abundances of D, 3He, and
4He increase (less time to destroy D and 3He, more
neutrons available for 4He), while that
of 7Li decreases (less time to produce 7Li). Since
it is the 4He
mass fraction that is most sensitive to changes in the early Universe
expansion rate and, since the SBBN-predicted value of YP is
too large when compared to the data, S < 1
(N < 3) is
required. For a
slower than standard expansion rate the predicted abundances
of D and 3He decrease compared to their SBBN values
(at fixed
) while that of
7Li increases. Since the BBN-predicted
abundance of D increases with decreasing baryon density, a decrease
in S can be compensated for by a decrease in
. For
10
as S
increases the BBN-predicted abundances of D, 3He, and
4He increase (less time to destroy D and 3He, more
neutrons available for 4He), while that
of 7Li decreases (less time to produce 7Li). Since
it is the 4He
mass fraction that is most sensitive to changes in the early Universe
expansion rate and, since the SBBN-predicted value of YP is
too large when compared to the data, S < 1
(N < 3) is
required. For a
slower than standard expansion rate the predicted abundances
of D and 3He decrease compared to their SBBN values
(at fixed
) while that of
7Li increases. Since the BBN-predicted
abundance of D increases with decreasing baryon density, a decrease
in S can be compensated for by a decrease in
. For
10
 6 and
S - 1 << 1, a good approximation (for fixed D) is
6 and
S - 1 << 1, a good approximation (for fixed D) is
 10
6(S - 1)
(Kneller & Steigman
2003).
In Figure 8 are shown the 4He - D
(YP versus D/H)
relations for three values of the expansion rate parameterized by
N. To first order,
the combination of
and S that
recovers the SBBN deuterium abundance will leave the 3He
abundance prediction unchanged as well, preserving its good agreement
with the observational data. However, the consequences for
7Li are not so favorable. The BBN abundance of 7Li
increases with decreasing S but decreases with a smaller
; the two
effects nearly cancel leaving essentially the same discrepancy as for
SBBN. For 7Li, a nonstandard expansion rate cannot relieve
the tension between the BBN prediction and the observational data.
10
6(S - 1)
(Kneller & Steigman
2003).
In Figure 8 are shown the 4He - D
(YP versus D/H)
relations for three values of the expansion rate parameterized by
N. To first order,
the combination of
and S that
recovers the SBBN deuterium abundance will leave the 3He
abundance prediction unchanged as well, preserving its good agreement
with the observational data. However, the consequences for
7Li are not so favorable. The BBN abundance of 7Li
increases with decreasing S but decreases with a smaller
; the two
effects nearly cancel leaving essentially the same discrepancy as for
SBBN. For 7Li, a nonstandard expansion rate cannot relieve
the tension between the BBN prediction and the observational data.
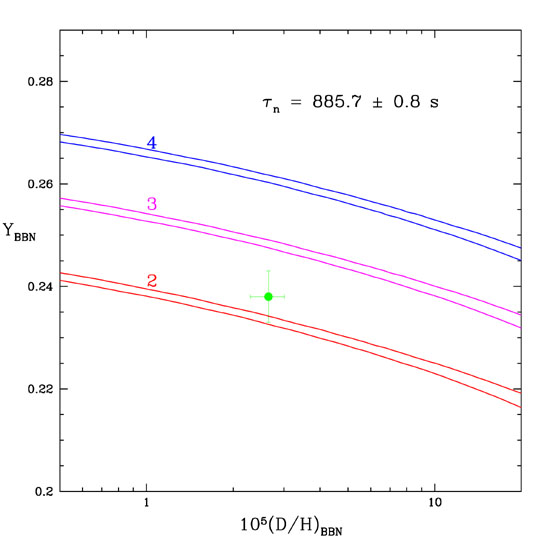 |
Figure 8. The BBN-predicted relation
between the 4He mass fraction YP
and the deuterium abundance yD for three,
early-Universe expansion rates corresponding to
N |
Setting aside 7Li, it is of interest to consider the simultaneous
constraints from BBN on the baryon density parameter and the expansion
rate factor from the abundances of D and 4He; it has already been
noted that for this nonstandard case, D and 3He will remain
consistent. In Figure 9 are shown the
1 ,
2, and
3 contours in the
N -
plane derived from
BBN and the D and 4He relic abundances. As expected from the
discussion above, the best fit value of
(the cross in
Figure 9) has shifted downward to
10
= 5.7 (
,
2, and
3 contours in the
N -
plane derived from
BBN and the D and 4He relic abundances. As expected from the
discussion above, the best fit value of
(the cross in
Figure 9) has shifted downward to
10
= 5.7 ( B =
0.021). While the best fit is for
N = - 0.7
(S = 0.94), it should be noted that the standard case of
N = 3 is
entirely compatible with the data at the
~ 2 level.
B =
0.021). While the best fit is for
N = - 0.7
(S = 0.94), it should be noted that the standard case of
N = 3 is
entirely compatible with the data at the
~ 2 level.
 |
Figure 9. The
1 |