


 1,
N
1,
N 3
3
The CBR temperature fluctuation anisotropy spectrum is sensitive
to the early-Universe radiation density
( R)
as well as to the overall expansion rate. The early Universe is radiation
dominated so that
R)
as well as to the overall expansion rate. The early Universe is radiation
dominated so that
 R
R
 1 +
0.135
1 +
0.135  N (see Eq. 6
and recall that
H2). The late Universe is matter dominated (MD)
(
N (see Eq. 6
and recall that
H2). The late Universe is matter dominated (MD)
( M
M

 M
h2) and the crossover
from RD to MD, important for the growth of fluctuations and for
the age/size of the Universe at recombination, occurs for a redshift
M
h2) and the crossover
from RD to MD, important for the growth of fluctuations and for
the age/size of the Universe at recombination, occurs for a redshift
 |
(8) |
If the matter content is kept fixed while the radiation content is
increased, corresponding to a faster than standard expansion rate,
matter-radiation equality is delayed, modifying the growth of
fluctuations prior to recombination and, also, the Universe is
younger at recombination and has a smaller sound horizon, shifting
the angular location of the acoustic peaks. The degeneracy between
the radiation density (
N or
S) and
M is
broken by the requirement that
M +
 = 1
and the HST Key Project determination of the Hubble parameter
(see [Barger et
al. (2003a)]
for details and further references). In
Figure 10 are shown the
1
= 1
and the HST Key Project determination of the Hubble parameter
(see [Barger et
al. (2003a)]
for details and further references). In
Figure 10 are shown the
1 and
2 contours in the
N -
and
2 contours in the
N -
 plane from the
CBR (WMAP) data; note the very different
N scales and
ranges in Figures 9 and
10. As is the case for BBN (see
Section 7),
the CBR favors a slightly slower than standard expansion. However,
while the "best" fit value for the expansion rate factor is at S
< 1 (
N < 0),
the CBR likelihood distribution of
N values is
very shallow and the WMAP data are fully consistent with S = 1
(
N = 0).
plane from the
CBR (WMAP) data; note the very different
N scales and
ranges in Figures 9 and
10. As is the case for BBN (see
Section 7),
the CBR favors a slightly slower than standard expansion. However,
while the "best" fit value for the expansion rate factor is at S
< 1 (
N < 0),
the CBR likelihood distribution of
N values is
very shallow and the WMAP data are fully consistent with S = 1
(
N = 0).
 |
Figure 10. The
1 |
Comparing Figures 9 and
10,
it is clear that for this variant of the standard cosmology there
is excellent overlap between the
-
N confidence
contours from BBN and those from the CBR (see
Barger et al. 2003a).
This variant of SBBN (S
1) is consistent with the
CBR. In Figure 11 (from
Barger et al. 2003a)
are shown the confidence contours in the
-
N plane for
a joint BBN - CBR fit. Again, while the best fit value for
N is
negative (driven largely by the adopted value for YP),
N = 0
(S = 1) is quite acceptable.
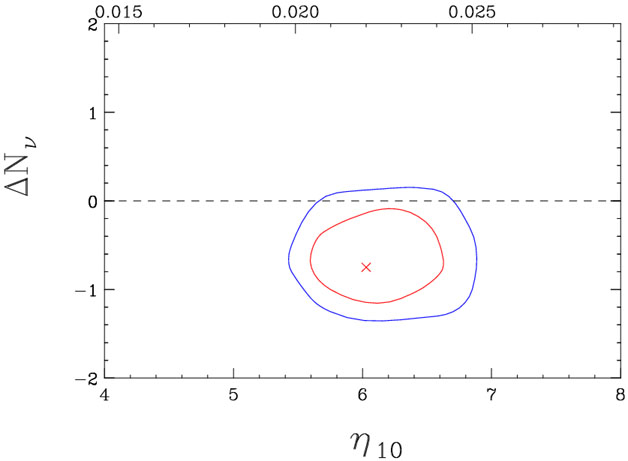 |
Figure 11. As for
Figure 10, but for the
joint BBN - CBR fit. The best fit point
( |