

3. Profile handling
The set of cleaned maps, with or without the continuum radiation of the galaxy, can also be viewed as a set of profiles at various positions in the sky. Most profiles are narrow and have only one peak but in the inner parts of some galaxies the profiles are much broader due to a steep velocity gradient within the beam. We will discuss the influence of the beam in section 4; here we will only consider the determination of HI column density and the intensity weighted mean velocity. As stated before, the 80 channel system has been designed such that these quantities can be derived with a 5% accuracy from a simple summation of the individual profile points. The problems to be solved here are 1) the separation of line signal from continuum signal, and 2) the suppression of the influence of noise.
 |
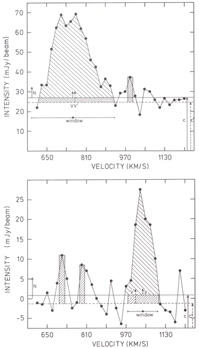
Figure 3. Some examples of WSRT profiles
observed in the galaxy NGC 5033. N denotes noise level
(1 |
Consider a typical profile in Fig. 3a. We can characterize this profile by a baselevel C, a peak signal S, an rms noise level N, the integral, I, under the profile after subtraction of the base level, and the intensity weighted mean velocity V. If we denote the profile intensities at each velocity point as ti we have:
 |
|
 |
with i outside the range with line signal; nc is the number of (continuum) channels outside the line. |
 |
with i inside the range with line signal; nl is the number of channels inside the line. |
 |
|
 |
n is the total number of channels |
It is clear that we have to find, a criterion to determine nc; once nc has been fixed the remaining quantities can be computed. The rms error in C is N nc-1/2; the rms error in I is
 |
The rms error in velocity depends on the signal to noise ratio and nl in a complicated manner; it suffices to remark that for high S/N and small nl the error is small; for low S/N and large nl the error is large.
We will consider four ways of treating the profiles and separating line from continuum:
ad 1 - This method takes a lot of time and adds a slight personal bias into the treatment of low S/N profiles. On the other hand computations can be easily checked, and all the data are examined which increases the possibility that interesting features are noted as such.
ad 2 - This is a good method but a disadvantage is that a fitting procedure generally takes a lot of computing time, even though in most cases a single gaussian profile shape can be assumed. Not all profiles, however, can be described with a gaussian.
ad 3 - This method, called cut-off method, has been used, among others, by Rogstad and Shostak (1971), Rots and Shane (1975), Gottesman and Weliachew (1975), and Winter (1975). The computational advantage is that all calculations can be performed on the entire set of channel maps in one run. The results, however, depend on the applied cut-off, as test calculations show. In these test calculations we add random noise to a preconceived profile, calculate I and V, and compare them with the input values. This is repeated for a large number (~ 100) of cases, from these we calculate the average deviations for I and V. In Fig. 4 we give the value of I as function of cut-off level for various values of S/N. Clearly there is a systematic effect in I for the cut-off values usually used (2 to 4 times N). The resulting V has a bias towards the centre of the velocity range, as shown in Fig. 5. Here we have assumed that the signal is centred around a velocity between the 5th and 12th channel on a baseline of 24 and 32 channels respectively. This simulates quite well the actual situation in galaxies, i.e. most of the profiles are not peaking in the middle of the velocity range but at either side. Clearly the cut-off method produces undesirable systematic effects under such asymmetric conditions and for that reason we did not use it. Test calculations also show that the iterative method to derive the continuum level described by Rots and Shane (1975) is subject to systematic errors.
ad 4 - This method, which we call window method, is in fact the automation of method 1. (Historically, it was developed before method 1 was implemented into the interactive system described by Ekers et al. (1973). This method and the previous test calculations have been suggested by Dr. A. Toomre). The window size is equal to n - nc and is determined by iteration as follows.
The velocity, Vo of the peak of the profile is determined first, a narrow window is centred around it and the velocity
 |
being the form of the window (nearly rectangular) and
 representing
its size, is calculated. Then we make
 larger and larger and
compute C, the value of the mean of the points outside the window,
for each value of
  .
Obviously the values of C converge, and the
iteration is stopped if two subsequent values of C differ in absolute
value by less than
N nc-1. This convergence criterion
has been determined from test calculations. At each step we calculate the
radial velocity Vw as well, and each time
Vo is replaced by the
previous Vw. The accuracy in the final value of
Vw does not depend
very much on the convergence criterion. For the column density
determination we can use either I (without window), or
Iw, the sum
within the window. These numbers do not differ very much in practice,
although their formal errors differ by
(n1 / n)1/2. In practice
nl is about 6 for the vast majority of the
profiles. The final
value of C is a good estimate of the continuum radiation. In
Fig. 3b we give the results of methods 3 and 4
for another profile.
Test calculations show that for gaussian profiles with noise the
accuracy reached with method 4 is only 20% worse than the accuracy
achieved by fitting a gaussian.
Profiles with a S/N ratio less than 3 are not accepted as genuine detections of line signal, but to avoid discrimination against extended emission at a level of 2N we can smooth the profiles in velocity with a 1/4 - 1/2 - 1/4 running mean, thereby increasing S/N with a factor 1.6 and not affecting much the accuracy in the velocities.
For all the data described in this thesis we have adopted
method 4 for the computation of column densities and radial
velocities. In most cases the continuum radiation was calculated in this
way as well. The results have been checked with method 1 on selected
fields, with satisfactory agreement. For a few cases, where
nc  2 to 4, the method fails to converge. This occurs sometimes
in the central parts of a galaxy where the profiles are very broad.
This is immediately noticeable in the HI column density map; the
value found with method 1 can be inserted. In a few other cases
the profiles themselves were distorted considerably.
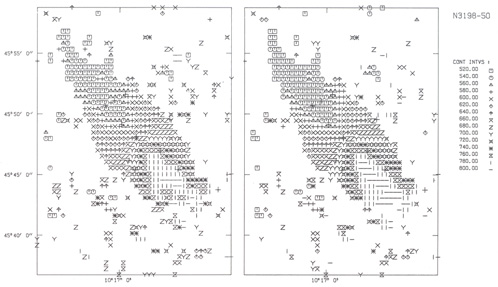
The advantage of the window method above the cut-off method lies in its bias free determination of HI density and radial velocity of a given profile. A comparison of the velocity field of NGC 3198 (at 50" ×70" resolution) derived with both methods in Fig. 6, shows clearly that use of a cut-off will lower the rotation curve of a galaxy. The amplitude of this effect obviously depends on the cut-off level, but is certainly not negligible for most of the published data. Indeed, Visser (1978) finds for M81 that the rotation curve based on window method data is, in the interval 3.25 to 12.5 kpc from the the centre, on the average 8 km s-1 higher than the one given by Rots (1975). Moreover, the scatter in the rotational velocities decreases with about a factor 2. This occurs because the amplitude of the bias depends on the velocity of the noise peaks above the cut-off, which varies from profile to profile.
 |
Figure 6. Velocity fields of NGC 3198. On
the left-hand side a velocity field resulting from a
1.5 |