


4. Spatial resolution effects
It is well known that the radius of turnover of a rotation curve for one and the same galaxy differs when it has been determined optically and by 21 cm line studies (Burbidge and Burbidge, 1975). This is thought to be due to the large beams generally employed in the 21 cm line studies. A suitable parameter to characterize the effect of the beam is the ratio R/B, i.e. the ratio between the (Holmberg) radius R of a galaxy and the half-power beamwidth B (see also Roberts, 1975). During the course of our work we have made maps of the same galaxy at various resolutions; comparison of the rotation curves leads to the conclusion that they are not the same. Since we want to compare galaxies which have been observed with different R/B knowledge of the effects of beam smoothing is desirable.
Visser (1978) has made an extensive study of the smoothing effects on the HI density and radial velocities associated with spiral arms. He concludes that density wave streaming motions cannot be detected if the ratio arm-separation/beamsize is less than about 1.5 in the case of M81. Hence, for a galaxy with R = 20 kpc and an arm spacing of 3 kpc, streaming motions are smoothed out if R/B is smaller than about 15, Note that this is an order of magnitude estimate.
For the study of rotation curves of galaxies the requirements
on R/B may be less severe. We have made test calculations by simulating
a galaxy of radius 10' and inclination 60°. For a given radial
distribution of HI density;
 H(r),
and a given rotation curve, Vc(r), we
constructed channel maps at intervals 20 km s-1; a filter
width of 27.2 km s-1 (between halfpower points) has been
taken into
account. The maps have been sampled on a rectangular grid with
effective resolution of 4.5". Noise has been added from a random
number generator. Then maps of the HI column density and radial
velocity field have been derived; from these maps the radial
distributions of off and V have been calculated. We then smoothed
the channel maps to various resolutions and determined the radial
distribution of HI density and the rotation curve. In
Fig. 7 we compare
the results for two different set of assumed function for
H(r)
and Vc(r). For R/B equal to 5 the output
results do not
resemble the input data anymore. Therefore we have to require a R/B of at
least 7, better even 10, before we can have some confidence in
H(r)
or Vc(r). In Fig. 8 we
give the run of profiles along the major and
minor axes for the various resolutions. Note that the observed profiles
begin to deviate substantially from the true ones at low R/B,
especially in the central parts.
H(r),
and a given rotation curve, Vc(r), we
constructed channel maps at intervals 20 km s-1; a filter
width of 27.2 km s-1 (between halfpower points) has been
taken into
account. The maps have been sampled on a rectangular grid with
effective resolution of 4.5". Noise has been added from a random
number generator. Then maps of the HI column density and radial
velocity field have been derived; from these maps the radial
distributions of off and V have been calculated. We then smoothed
the channel maps to various resolutions and determined the radial
distribution of HI density and the rotation curve. In
Fig. 7 we compare
the results for two different set of assumed function for
H(r)
and Vc(r). For R/B equal to 5 the output
results do not
resemble the input data anymore. Therefore we have to require a R/B of at
least 7, better even 10, before we can have some confidence in
H(r)
or Vc(r). In Fig. 8 we
give the run of profiles along the major and
minor axes for the various resolutions. Note that the observed profiles
begin to deviate substantially from the true ones at low R/B,
especially in the central parts.
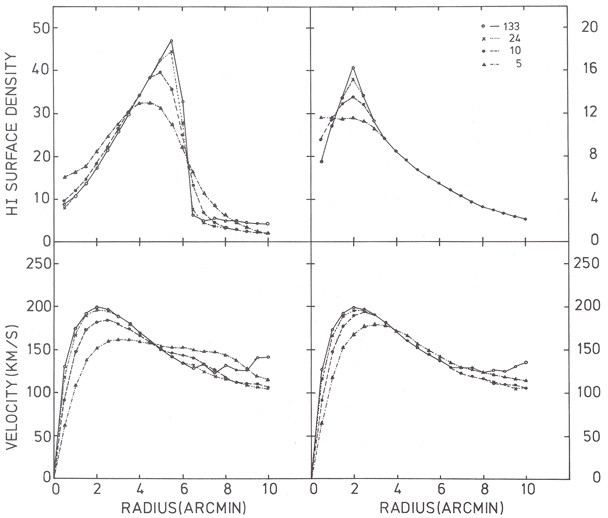 |
Figure 7. Radial distributions of
|
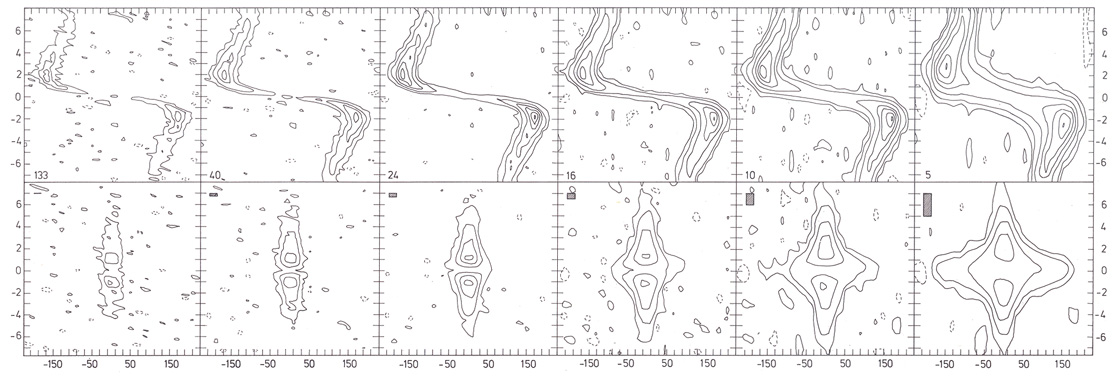 |
Figure 8. Position velocity profiles along the major axis (upper) and minor axis (lower) for the experiment in the right-hand panels of Fig. 7. The contour intervals are selected to illustrate the broadening of the profiles for lower R/B. The R/B value is indicated in the upper panels; the "position-velocity"-beam by the shaded areas in the lower panels. |
In practice the problems associated with beam smoothing are
even worse. In the central parts of galaxies the scalelength over which
H(r)
and Vc(r) are changing is much smaller than in
our simple model. Therefore, if we are interested in the distributions
close to the centre our requirements on R/B should become higher.
The distribution of
H(r)
in the central regions of most galaxies
can only be studied by very high resolution, high sensitivity radio
telescopes. For the rotation curve, however, we sometimes can make
use of optical data from spectroscopy. This has been done for some
of the galaxies described in this thesis. Thus, it is important to
note that the optical data on the velocity field are often complementary
to the radio data, and hence not superfluous. It must be
kept in mind however, that the optical data are derived from a different
kind of physical objects.
Although we require RIB to be larger than about 7 for a rotation curve study, large-scale deviations from circular motions can be noticed with lower relative resolution. For example, Lewis (1968) discovered that the velocity field of M83 indicated that there is a large-scale deviation from circular motion, while the ratio RIB in his study was 2.5. Clearly, there is some progression as R/B increases: if R/B is 2.5 to 6 we can study large-scale deviations, if R/B is 6 to 15 we can derive a rotation curve as well, if R/B is larger than 15 we can study small deviations from circular motion.