


Since hydrogen is the most abundant element in stars and galaxies we might expect that its distribution across a galaxy provides information relevant for the theories of galactic evolution. A very simple theory of the chemical evolution of galaxies (Searle and Sargent, 1972) predicts that the abundance of a heavy element in a given volume element depends on the ratio of total mass to gas mass in the following way:
 |
(1) |
the yield is the ratio of the rate at which heavy elements are
produced by nucleosynthesis and ejected into the interstellar gas
to the net rate at which hydrogen is removed from the interstellar
gas by star formation. More elaborate theories, like those of
Talbot and Arnett (1975),
Lynden-Bell (1975)
and those outlined by
Audouze and Tinsley (1976),
predict similar relationships between
these quantities. If radial mixing is not too important inside a
galaxy we can replace the ratio total mass to gas mass by the
ratio of local mass surface densities:
 M(R) and
G(R)
for mass
and gas mass respectively. Not much is known about the average
yield (the average is a time average from t = 0 until the present
epoch). In principle we can obtain information on the abundances
from the line strength ratios in HII regions at different radii; the ratio
M(R)
/ G(R)
can, to some extent, be estimated from 21-cm
line observations. In this section we present some information on
M(R)
/ HI(R),
where
HI(R) is
the mass surface density of neutral hydrogen, and we compare these
results with available data on line strength ratios.
M(R) and
G(R)
for mass
and gas mass respectively. Not much is known about the average
yield (the average is a time average from t = 0 until the present
epoch). In principle we can obtain information on the abundances
from the line strength ratios in HII regions at different radii; the ratio
M(R)
/ G(R)
can, to some extent, be estimated from 21-cm
line observations. In this section we present some information on
M(R)
/ HI(R),
where
HI(R) is
the mass surface density of neutral hydrogen, and we compare these
results with available data on line strength ratios.
For 14 galaxies in our sample the radial distribution of an,
has been determined from the 21 cm maps by averaging in annuli
over the azimuthal direction. The width of these annuli is usually
taken to be the size of the synthesized beam. We have corrected to
face-on values by a multiplication with the cosine of the
inclination. Note that these results are not corrected for optical depth
effects. As in the case of rotation curves, also the determination of
HI(R)
is hampered by the presence of deviations from
axial symmetry in spiral galaxies; for each type of deviation we have
followed the same procedures as in the case of rotation curves (see
chapter 6). Even more serious is the
beamsmoothing in the central parts, and this results in practice in an
overestimate of
HI in the
centre (cf. chapter 3). The results for
M(R)
/ HI(R)
are, obviously, even more uncertain.
In Fig. 7 we present the curves of
M(R)
/ HI(R)
for various
galaxies. The curves can be divided in two parts: a gradually declining
inner part and a roughly flat outer part. For the galaxies with
large scale asymmetries this outer part is actually not reached. In
addition to the deviations from axial symmetry another problem arises
here: for nearly face-on galaxies the inclination correction for the
velocities is large and hence
M is
uncertain. This problem is illustrated for the case of M51 in
Fig. 7b. The lower curve
of M51 is based on an inclination of 35° (the one
adopted by
Segalovitz, 1976),
the upper curve is based on an inclination of 20° (cf.
Tully, 1974).
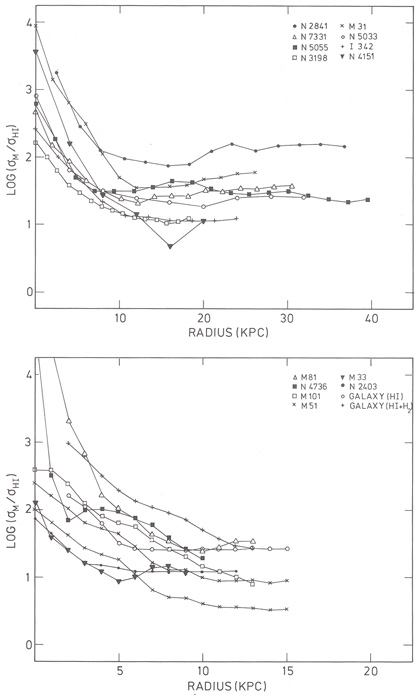 |
Figure 7. Radial variation of the total
mass to HI gas mass surface density ratio in various galaxies.
|
The contributions of gaseous components other than HI to
G(R)
are unknown. For our Galaxy an estimate for the contribution of
H to
G can be
derived from the CO observations (see
Gordon and Burton, 1976).
The lack of knowledge about the conversion
factor from CO-abundance to H2 abundance, however, makes such an
estimate uncertain.
In Fig. 8 we present the variation in
M(R),
HI(R)
and H2(R) in our
Galaxy. Since HI and H2 are the main contributors to the gas
mass we tentatively conclude that
M /
G is roughly
constant beyond R = 5 kpc.
Note that the contribution of H2 dominates in the inner
parts. In our
Galaxy there is a fair agreement between the radial distributions of
molecules and of HII regions, but the HI extends much farther out
(cf. Burton, 1976).
In external galaxies the radial distribution of
HII-regions is also more concentrated to the inner parts than is
the HI distribution It might be conjectured that, similar to our
Galaxy, the ratio of
M(R)
/ G(R)
remains more or less constant
beyond about one-third of the optical radius, but we must again
emphasize that the uncertainty in the contribution of
H2
to
G is quite large.
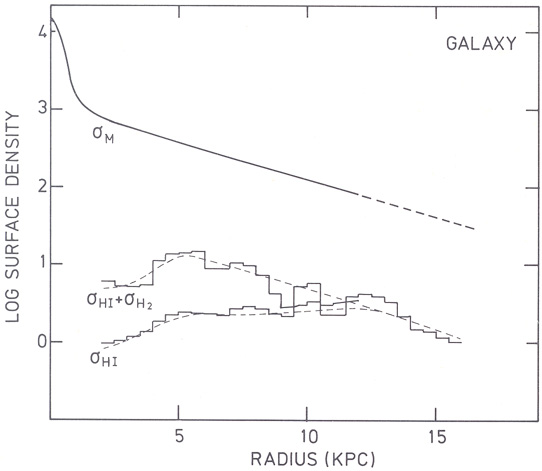 |
Figure 8. Radial variation of mass and gas
mass surface densities in our Galaxy. The histograms are adapted from
Gordon and Burton (1976).
The dashed lines have been used to calculate the
|
b) Variation of
M /
G with type
and size
We assume for the moment that the ratio
M(R)
/ G(R)
is indeed constant in the outer parts of galaxies and that
G(R) is
dominated there by
HI(R).
The value of this ratio seems to correlate with Vm,
as can be seen in Fig. 9. Two difficulties arise
in the interpretation of this figure: 1) the inclination, and therefore
M, might be
in error for the nearly face-on galaxies; 2) part of the mass may
not be distributed in a disk. If these difficulties are not too
important, we conclude that galaxies with large Vm
have a high M /
G
in the outer parts, while galaxies with smaller Vm
have a low M /
G.
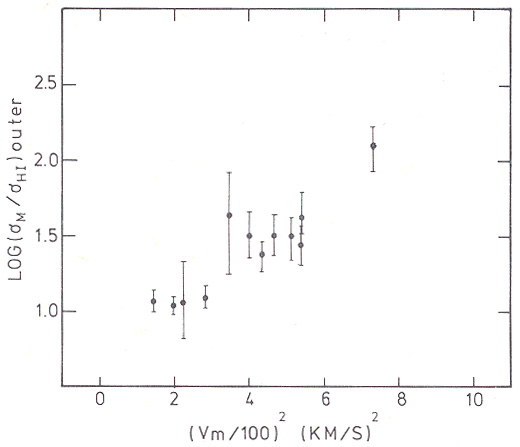 |
Figure 9. Mass to gas mass ratio,
|
Because our sample is small, we do not know whether the correlation in
Fig. 9 is a chance coincidence. We can, however,
test this correlation by noting that, if
M /
HI is
constant, the integrated values
MT / MH should also give us to some
extent the value of this constant. In Fig. 10
we present the values of
MT / MH as function of
Vo, the halfwidth of the 21 cm integral profile, for the sample of
galaxies discussed by
Shostak (1978).
MT / MH in this case is derived
from integral properties, and is therefore not entirely comparable
with the
M
/ HI
discussed above. Nevertheless, it is clear that
there are no galaxies with high Vo and, low
MT / MH. This result also
indicates that in galaxies with high Vm the gas to
mass ratio is lower than in galaxies with low Vm.
 |
Figure 10. Total mass to hydrogen mass ratio vs Vo (half the width of the HI profile divided by sin i) from single dish data by Shostak (1978). |
In the inner parts of galaxies the reliability of the data on
M
/ HI is even
poorer than in the outer parts
because of the beam-smoothing effects, but there is a trend that
M /
HI in the central
region is much larger in earlier type spirals than in later types.
In galaxies with bulges no HI emission has been detected, the upper
limit to the surface density of HI is about
1.0M pc-2. Several explanations may be given to account for this:
1) The absence of HI in galaxies with bulges is reminiscent to the lack of HI in elliptical galaxies. Perhaps a hot galactic wind is present which keeps the bulge clean of the gas shed from evolving stars (see Faber and Gallagher, 1976).
2) Star formation might play an important role too, but it is not clear
which mechanism is responsible for star formation. The fashionable idea
that the star formation is triggered by (stationary Lin-Shu) density waves
(cf. Oort, 1974;
Jensen, Strom and Strom,
1976)
might not be adequate to explain the constant value of
M
/ G
in our Galaxy if the star formation
rate is proportional to the difference in angular velocity of the
gas and that of the wave i.e. proportional to
( -
p). This
mechanism seems also inadequate to explain the absence of gas in the
central parts of the multi-armed spiral NGC 2841 (cf.
chapter 4.6).
-
p). This
mechanism seems also inadequate to explain the absence of gas in the
central parts of the multi-armed spiral NGC 2841 (cf.
chapter 4.6).
3) For later type galaxies, which have a higher content of
population I material, the contribution of molecules may be so high
that M /
G remains
constant even though
M /
HI is
increasing towards
the centre. Quantitative estimates of the contribution of molecules
to G in these
galaxies are necessary to test this possibility.
c) Comparison with abundance determinations
For a few galaxies data are available on the strength of the
emission lines of several HII regions (see review by
Webster, 1977).
In Fig. 11 we have presented the data on log
[OIII] /
H versus radius
for five galaxies in our sample, taken from
Smith (1975) and
Rubin, Kumar and Ford
(1972)
(we have averaged the data of Rubin et al. by
taking means of 4 points at adjacent radii). This line strength ratio
increases with radius. Various theoretical studies indicate that
this, and similar systematic radial variations in other line strength
ratios, can be explained by a decrease of the heavy element abundance
with radius
(Searle, 1971;
Shields and Tinsley, 1976;
Sarazin, 1976).
Recently
Churchwell et al. (1977)
reported a systematic variation of
the temperature of galactic HII regions across the Galaxy which they
interpret as due to an abundance gradient; this result may not be
significant in view of the complications in the analysis of radio
recombination line data (cf.
Lockman and Brown, 1978).
Although the
amplitude of the abundance gradients depends almost entirely on the
assumed HII region models, most authors seem to agree that such
gradients exist.
versus radius
for five galaxies in our sample, taken from
Smith (1975) and
Rubin, Kumar and Ford
(1972)
(we have averaged the data of Rubin et al. by
taking means of 4 points at adjacent radii). This line strength ratio
increases with radius. Various theoretical studies indicate that
this, and similar systematic radial variations in other line strength
ratios, can be explained by a decrease of the heavy element abundance
with radius
(Searle, 1971;
Shields and Tinsley, 1976;
Sarazin, 1976).
Recently
Churchwell et al. (1977)
reported a systematic variation of
the temperature of galactic HII regions across the Galaxy which they
interpret as due to an abundance gradient; this result may not be
significant in view of the complications in the analysis of radio
recombination line data (cf.
Lockman and Brown, 1978).
Although the
amplitude of the abundance gradients depends almost entirely on the
assumed HII region models, most authors seem to agree that such
gradients exist.
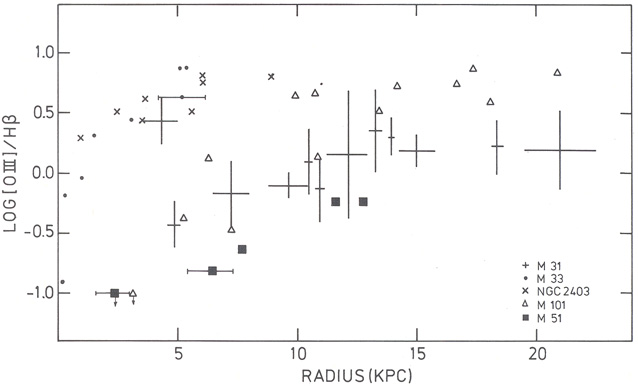 |
Figure 11. Radial variation of the [OIII] /
H |
If such gradients are indeed present, and if the constancy of
M /
G is also
accepted, we must conclude from equation (1) that the
mean yield is decreasing with radius. Thus, the amount of heavy
elements shed from stars into the interstellar medium compared to
the star formation rate must be lower in the outer parts of
galaxies. This suggests that the mass function of stars is a function of
radius; in the outer parts there are fewer massive stars (which
produce more metals in a shorter time than do dwarfs). Note that
this result is consistent with an increase in the mass-to-luminosity
ratio with distance to the centre.
We can also compare the abundance variations among different
galaxies with the mass to gas mass ratio. In
Fig. 12 we have plotted
log [OIII] / H
versus log
M /
HI for
various locations in a number of
galaxies. This plot is more difficult to interpret than
Fig. 11.
Various assumptions are necessary to convert log [OIII] /
H into an
abundance ratio and
M /
HI is in the
inner parts not equal to
M /
G.
Further, we are probably dealing with an atypical sample of galaxies:
in both M51 and M101 large scale asymmetries occur which make the
determination of
M(r)
difficult. If we restrict ourselves
to NGC 2403, M33 and M31 we find that, apart from anomalous inner HII
regions in M31, a loose correlation exists. The inner parts of
M33 and NGC 2403 have about the same linestrength ratio and
HI-gas mass to total mass ratio as the outer parts of M31. The mass-to-luminosity
ratios in these regions are, however, very different: in the inner
parts of M33 and NGC 2403
M
/ LB
 3, and in the outer
parts (10-20 kpc) of M31 it is about 18. In the outer parts of M31 the abundance
of oxygen is about 6 times higher than in the outer parts of M33 (we
have used the conversion plot for log [OIII] /
H
3, and in the outer
parts (10-20 kpc) of M31 it is about 18. In the outer parts of M31 the abundance
of oxygen is about 6 times higher than in the outer parts of M33 (we
have used the conversion plot for log [OIII] /
H
 [O/H] given by
Sarazin (1976)).
Since the ratios of log
M /
HI in these
regions differ by only 1.5 we conclude that the yield in the outer parts of
M31 must have been higher than in the outer parts of
its companion M33. From the comparison of data on our Galaxy, NGC 6822, and the
Magellanic Clouds, however, (see
Lynden-Bell, 1975,
Fig. 1) we find
that the, yield must be higher in the dwarf galaxies than in the
solar neighbourhood. Apparently there is no simple relation between
the yield and a parameter like Vm, which scales with
the mass of a
galaxy. There is also hardly any correlation between the line
strength ratio and morphological type, as can be seen from
Fig. 10. Also the results for NGC 6503 and NGC 2403, both Scd III galaxies, obtained by
Jensen et al. (1976)
show a large difference in line
strength ratio. Hence not much can be concluded from these data
with regard to the yield in different galaxies.
[O/H] given by
Sarazin (1976)).
Since the ratios of log
M /
HI in these
regions differ by only 1.5 we conclude that the yield in the outer parts of
M31 must have been higher than in the outer parts of
its companion M33. From the comparison of data on our Galaxy, NGC 6822, and the
Magellanic Clouds, however, (see
Lynden-Bell, 1975,
Fig. 1) we find
that the, yield must be higher in the dwarf galaxies than in the
solar neighbourhood. Apparently there is no simple relation between
the yield and a parameter like Vm, which scales with
the mass of a
galaxy. There is also hardly any correlation between the line
strength ratio and morphological type, as can be seen from
Fig. 10. Also the results for NGC 6503 and NGC 2403, both Scd III galaxies, obtained by
Jensen et al. (1976)
show a large difference in line
strength ratio. Hence not much can be concluded from these data
with regard to the yield in different galaxies.
 |
Figure 12. Comparison of LOIIIJ/HS ratios and
|
We have presented the above discussion to illustrate the complexity of
the problems we encounter if a simple relation between
the abundances of heavy elements and the total mass to gas mass ratio,
like equation (1), is to be tested. It is very difficult to
draw any conclusions from this discussion other than the obvious
one that the uncertainties are large. We find, however, some interesting
correlations suggesting a variation of the mass function
with radius. No clear relationship exists between the line strength
ratio log [OIII] /
H and type or
size of a galaxy.