


In Fig. 5 we present plots of the total
mass-to-luminosity ratios
Mo / LB and
Mf / LB, also listed in
Table 1, versus Hubble type,
colour and blue luminosity. LB has been calculated
from the corrected magnitudes
BTo given by
De Vaucouleurs et
al. (1976),
and the distance;
mB = 5.43. The magnitude refers to the light
integrated to
= 5.43. The magnitude refers to the light
integrated to  but it is
derived using mean radial luminosity profiles
and may therefore not refer to the same radius as does
Mo or Mf.
But the scatter thus introduced is likely to be small. We conclude
from Fig. 5 that
M / LB is not a function of type, colour or
luminosity.
but it is
derived using mean radial luminosity profiles
and may therefore not refer to the same radius as does
Mo or Mf.
But the scatter thus introduced is likely to be small. We conclude
from Fig. 5 that
M / LB is not a function of type, colour or
luminosity.
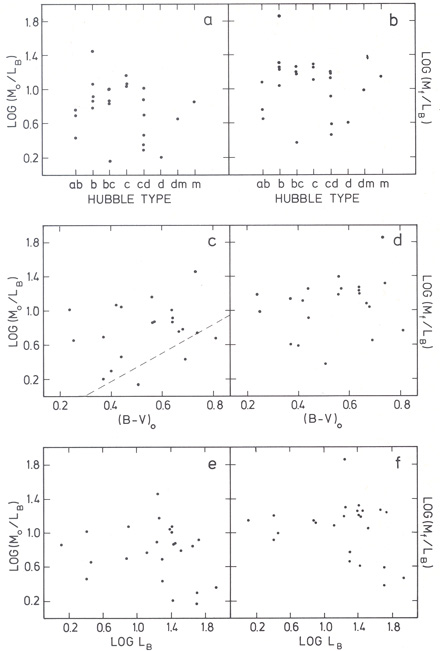 |
Figure 5. Mass-to-luminosity ratios as
function of Hubble type
(upper panels), colour (middle panels) and luminosity (lower
panels). Mo is the mass within the radius of the last
measured point on the rotation curve, determined with Nordsieck's method,
Mf is the mass of the model fit. LB
(units 109
L |
Brosche and Reinhardt (1977) have argued that M / LB is a function of type. They have calculated masses of galaxies from integral HI profiles: M = kG-1 Vmax2 Rmax, with k a constant of order unity, and Vmax the maximum rotational velocity, which occurs at radius Rmax. Such a formula implicitly assumes that the rotation curve declines past Rmax, contrary to the observations. Moreover, they use a correlation of Rmax / Ropt with type, Ropt being the Holmberg radius, noted by Brosche (1973) and Huchtmeier 17975). Thus for early type spiral galaxies they assume a rotation curve with a small value of Rmax, which thus declines in the outer parts, and for late type spirals a rotation curve which reaches its maximum in the outer parts. It is therefore not surprising that they find M / LB increasing with type. In the calculation of masses from integral HI profiles it seems better to use a constant Rmax / Ropt since for early type galaxies the measured Rmax is more related to the central component in the mass distribution, and not to the main disk.
Nordsieck (1973) reported that M / LB is correlated with colour. His sample of galaxies has been selected mainly from the list of galaxies for which Burbidge, Burbidge and Prendergast measured rotation velocities from optical spectroscopy of HII-regions. This sample of galaxies is biased towards luminous Sbc galaxies, and the radius of the last point on the rotation curve is about 5 to 10 kpc, hence the M / LB's are smaller. Omission of the only blue galaxy in his sample (NGC 4490, which forms an interacting pair with NGC 4485) more or less destroys the correlation.
We have compared our results for the dependence of
M / LB on
colour with predictions made by
Sargent and Tinsley
(1974).
They have calculated simple galactic evolution models, using the Salpeter
mass function with an upper mass limit mU and a lower
mass limit mL;
the luminosity of a star in these models varies with the fourth
power of its mass m, and the lifetime of a star is proportional
to m-3.08. This gives a relationship between M /
L and mL. The colour
B - V depends on the coefficient of the mass function. The
dashed line in Fig. 5c gives the predicted
relation for mL = 0.08
M. Since
most of the observed values lie above this line this appears to imply
that the contribution of low mass stars to the mass function
must be higher than given by a Salpeter function with a cut-off of
mL = 0.08
M. Perhaps mL has to be lowered, or
the mass function has
a coefficient different than 2.35. It could even be that the entire
model approach is simply wrong. Nevertheless, the fair amount of
scatter in the diagrams in Fig. 3
suggests that there are different
mass functions in different galaxies.
For the mean M / LB we find < log Mo / LB > = 0.77 ± 0.32 , and < log Mf / LB > = 1.04 ± 0.33. In Fig. 6 we present the variation of the mass-to-light ratio with radius for those galaxies for which we could find photometric data. The photometric data are not very homogeneous: high quality photometry exists only for a few galaxies. We did not correct for galactic absorption except for IC 342: most galaxies are at high latitude, and the correction for internal absorption is difficult to estimate. Nevertheless, there is a clear trend that M / L, increases with radius, although large differences among galaxies are found. The recent, preliminary, data on M / LJ by Bosma and Van der Kruit (1978) shown in Fig. 6b confirm the trend already present in the data on M / LB shown in Fig. 6a. Note that large M / L ratios occur in the outer parts, where the optical light is below the sky-level and the mass models are uncertain. We estimate that there is a factor of 3 uncertainty in the M / L ratios at about 20 to 30 kpc.
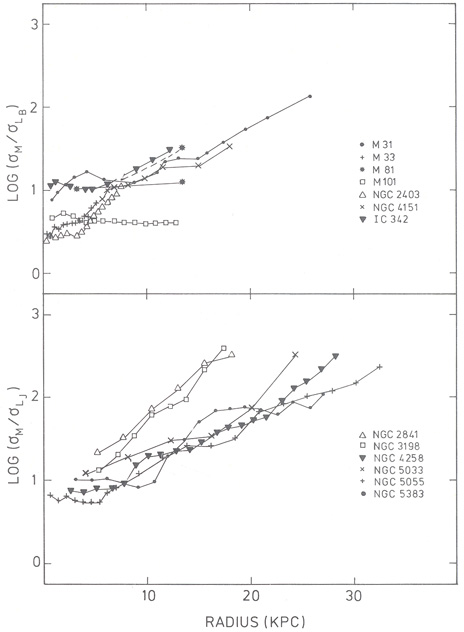 |
Figure 6. Radial variation of the mass-to-luminosity ratio in various galaxies. The luminosity data are not corrected for internal or galactic absorption, except IC 342 (AB = 2.2m). The photometric data in the upper panel have been taken from the literature: M31 (De Vaucouleurs, 1958); M33 (De Vaucouleurs, 1959); M81 (Schweizer, 1976 - the dashed line refers to a Toomre disk model, the dotted line to an exponential model for the mass distribution cf. Visser, 1978); M101 (Okamura et al., 1976); NGC 2403 (Okamura et al., 1977); NGC 4151 (Simkin, 1975 and priv. comm.); IC 342 (Ables, 1971). Data in the lower panel are preliminary results from Bosma and Van der Kruit (1978). |
Having found evidence for an increase in M / L in the outer parts we might ask the question: what is this dark material and is it distributed in a halo or not. The nature of the dark material is unclear but red M-dwarfs could produce such high M / L ratios. The increase in M / L not only occurs in galaxies which are warped, but also in galaxies with oval distortions (NGC 4151, NGC 4258). If all the dark material was distributed in a halo ten times as massive as the disk we would expect the disk to be stable against bar instabilities; the increase in M / L in galaxies with oval distortions is therefore puzzling in this picture. The alternative extreme - a massive disk - presents more difficulties for explaining the existence of warps in relatively isolated galaxies. Note that although warps and ovals occur frequently they do not occur in all spiral galaxies; it is possible that more than one explanation is required to account for invisible mass, warps and ovals at the same time.
Our results on
< Mo / LB > and
< Mf / LB > can
also be compared with the results from binary galaxy statistics.
Turner (1976)
finds from his sample of binaries a value of < M / L
> of 65. Corrected to
Ho = 75 km s-1 Mpc-1 this value
becomes 97.5. Recent work by
Van Albada and Freeman
(1978)
indicates that this high value must be lowered to
< M / LB >
 13.5 for pure spiral
pairs, in good agreement with our value
for < Mf / LB >.
Turner and Ostriker's
(1977)
recent value from the same
sample, but luminosity weighted instead of number weighted, is 150.
The mean luminosity in Turner's sample is about
LB = 2 × 10¹⁰
L, from
Fig. 2a we find then a value for
Vm of 180 km
s-1. Since < M / L > is
independent of LB in our sample, we expect for a galaxy of
this, luminosity that its rotation curve is flat to 0.3 Mpc if we have
to reach a < M / LB> of 100 at that
radius, which means that Turner's
value can only be reached with a rotation curve that is still using
beyond 20 to 30 kpc. If we have to reach a
< M / LB > of 13.5 at 0.3 Mpc, then the
rotation curve may decline according to a Toomre n = 1 disk after
about 1.5 - 2 times the optical radius as given by
De Vaucouleurs et
al. (1976).
Note that in both cases we must have an increase in
the mass-to-luminosity ratio in the outer parts, and that massive
haloes are not excluded. From Van Albada and Freeman's value of
M / L the halo mass may still be 1/2 to 2 times the disk
mass. On the other hand one of the attractive features of a super
massive halo is that the high M / L ratios in clusters of
galaxies can be explained
by having most of the (unseen) mass in galaxies. High sensitivity 21-cm
line observations, and deep surface photometry of a few
regular galaxies, like NGC 2403 or NGC 3198, out to a radius of 5
Ropt may distinguish between the possibility that
M / LB is "normal" (10 to 20) or extremely high
(~ 100).
13.5 for pure spiral
pairs, in good agreement with our value
for < Mf / LB >.
Turner and Ostriker's
(1977)
recent value from the same
sample, but luminosity weighted instead of number weighted, is 150.
The mean luminosity in Turner's sample is about
LB = 2 × 10¹⁰
L, from
Fig. 2a we find then a value for
Vm of 180 km
s-1. Since < M / L > is
independent of LB in our sample, we expect for a galaxy of
this, luminosity that its rotation curve is flat to 0.3 Mpc if we have
to reach a < M / LB> of 100 at that
radius, which means that Turner's
value can only be reached with a rotation curve that is still using
beyond 20 to 30 kpc. If we have to reach a
< M / LB > of 13.5 at 0.3 Mpc, then the
rotation curve may decline according to a Toomre n = 1 disk after
about 1.5 - 2 times the optical radius as given by
De Vaucouleurs et
al. (1976).
Note that in both cases we must have an increase in
the mass-to-luminosity ratio in the outer parts, and that massive
haloes are not excluded. From Van Albada and Freeman's value of
M / L the halo mass may still be 1/2 to 2 times the disk
mass. On the other hand one of the attractive features of a super
massive halo is that the high M / L ratios in clusters of
galaxies can be explained
by having most of the (unseen) mass in galaxies. High sensitivity 21-cm
line observations, and deep surface photometry of a few
regular galaxies, like NGC 2403 or NGC 3198, out to a radius of 5
Ropt may distinguish between the possibility that
M / LB is "normal" (10 to 20) or extremely high
(~ 100).