


3.4. Putting it all together in an idealized evolutionary model
Figure 7 depicts the evolution of the overall
metallicity of the ISM (gas and dust), and that of the dust (silicates
+ carbon dust) in a normal galaxy with an exponential star formation
rate characterized by a decay time of 6 Gyr. Starting with an initial
star formation rate of 80
M yr-1, the galaxy will form about 3 × 10¹¹
M of stars in a
period of 13 Gyr. The silicate and carbon dust yields were calculated
assuming a condensation efficiency of unity in the ejecta, and grain
destruction was neglected. The model therefore represents an idealized
case, in which grain production is maximized, and grain destruction
processes are totally ignored. Also shown in the figure are the separate
contributions of AGB stars to the abundance of silicate and carbon
dust. The onset of the AGB contribution to the silicate abundance starts
when ~ 8
M stars evolve
off the main sequence, whereas the AGB stars start to contribute to the
carbon abundance only when 4
M stars reach
the AGB phase. The figure also presents the dust-to-ISM metallicity
ratio. The ratio is almost constant at a value of ~ 0.36. At t =
14 Gyr, the model gives a silicate-to-gas mass ratio of 0.0048, and a
carbon dust-to-gas mass ratio of 0.0025, in very good agreement to their
values in the local ISM.
yr-1, the galaxy will form about 3 × 10¹¹
M of stars in a
period of 13 Gyr. The silicate and carbon dust yields were calculated
assuming a condensation efficiency of unity in the ejecta, and grain
destruction was neglected. The model therefore represents an idealized
case, in which grain production is maximized, and grain destruction
processes are totally ignored. Also shown in the figure are the separate
contributions of AGB stars to the abundance of silicate and carbon
dust. The onset of the AGB contribution to the silicate abundance starts
when ~ 8
M stars evolve
off the main sequence, whereas the AGB stars start to contribute to the
carbon abundance only when 4
M stars reach
the AGB phase. The figure also presents the dust-to-ISM metallicity
ratio. The ratio is almost constant at a value of ~ 0.36. At t =
14 Gyr, the model gives a silicate-to-gas mass ratio of 0.0048, and a
carbon dust-to-gas mass ratio of 0.0025, in very good agreement to their
values in the local ISM.
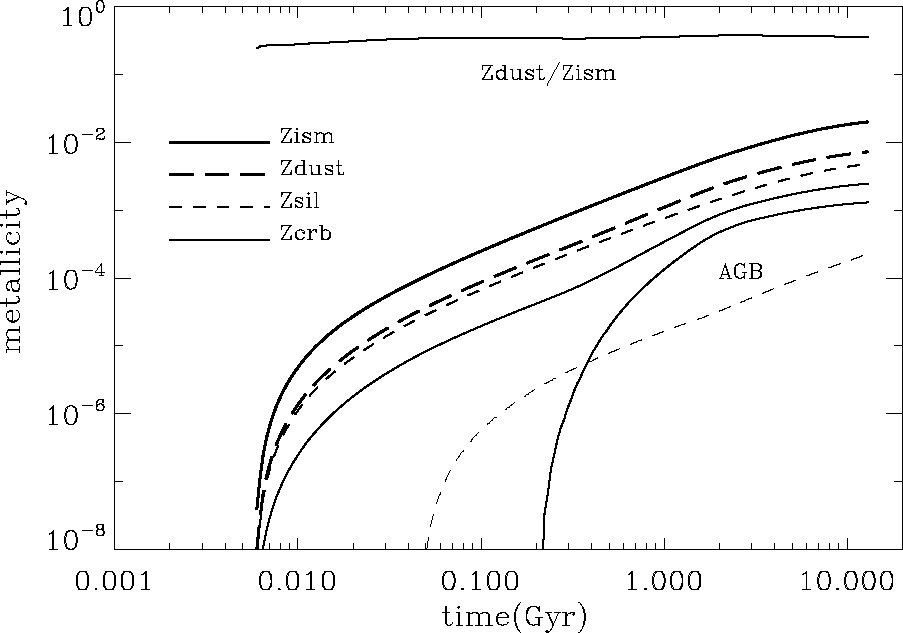 |
Figure 7. The evolution of the metallicity of the ISM and that of the dust as a function of time, Details in Section 3.4 of the text. |
The idealized model presented above highlights several problems concerning the galactic evolution of dust:
Figure 8 is a variation on the previous one,
plotting select quantities as a function of the ISM metallicity.
The figure illustrates an interesting fact: if PAHs are only produced in
AGB stars, then one would expect PAH features to arise in galaxies with
a minimum metallicity of 0.1
Z. This
may be partly the cause for the very low abundance of PAHs in low
metallicity systems
[27,
48],
and for the appearance of PAH features in the spectra of galaxies only
below a metallicity threshold of about 0.1
Z (Rieke
and Engelbracht, private communications).
 |
Figure 8. The evolution of dust as a function of ISM metallicity. Silicates are depicted by dashed lines, and carbon dust by solid lines. Bold lines represent the total contribution from SN II and AGB stars, and the light lines the separate contributions of the latter sources. |
The spectral appearance of a galaxy in the mid-IR and its UV-optical opacity is therefore affected by the delayed injection of carbon dust into the ISM. Figure 9 shows the evolution in the SED of a normal spiral galaxy as calculated by [20], illustrating the evolution of the PAH features with time. The heavy solid line represents the unattenuated stellar spectrum. The thin solid line is the total reradiated dust emission. At early epochs the reradiated IR emission is dominated by emission from H II regions (top two panels), and therefore lack any PAH features. At later times, the contribution of non-ionizing photons dominates the dust heating, and consequently, the IR emission from the diffuse H I gas dominates that from the H II regions (dotted line, lower two panels). Also noticeable in the lower two panels is the difference between the attenuated and unattenuated stellar spectrum.
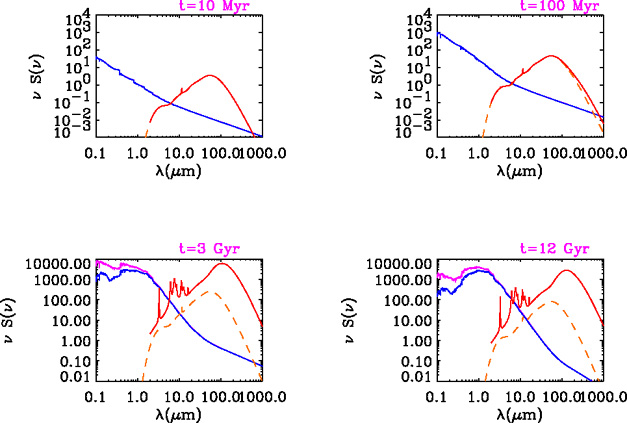 |
Figure 9. The evolution of the SED of a normal spiral galaxy as calculated by [20]. More details in the text. |